ESTIMATION OF THE PREVALENCE OF LATENT
TUBERCULOSIS INFECTION AMONG HOUSEHOLD CONTACTS
OF SPUTUM CULTURE POSITIVE TUBERCULOSIS PATIENTS IN
VELLORE, SOUTH INDIA
DISSERTATION SUBMITTED IN PARTIAL FULFILMENT OF THE
REQUIREMENT OF THE TAMILNADU Dr. M.G.R. MEDICAL
UNIVERSITY FOR THE M.D. BRANCH XV (COMMUNITY MEDICINE)
EXAMINATION
ACKNOWLEDGEMENTS
My sincere thanks to
Dr. K.R. John, my guide and In-Charge of CHAD TB Unit, CMC Vellore, for his valuable guidance and support at every stage.
Dr.Jacob John, for his suggestions and help in analysis.
Dr. Kuryan George , Dr. Vinohar Balraj and Dr. Jasmin Helan for their help in designing the study. Dr.Anu Bose, Dr.Vinod, Dr.Shantidani, Dr.Anu Rose, Dr.Alex, and Dr.Daisy for their concern. All staffs and colleagues in CHAD for their support and concern.
Dr.Joy Sarojini and Ms. Baby Shalini, Dept. of Microbiology, CMC Vellore, for their help in performing QFT and interpretation of the data.
Dr. V.K.Chadha,Senior Epidemiologist and Mr. A.N. Sashidhara,Field Investigator, National TB Institute, Bangalore for their help in training of testers and readers and in analysis.
Dr. P.G.Gopi, Statistician, TB Research Centre, Chennai for his help in analysis.
Mr.Satish, Mr.Anand, Mr. Jayapaul, Mr.Inbaraj and Mr.Ravi for their help in field work.
My friends, Vijay, Meena and Ashwin for their constant motivation and help at critical junctures. My wife, Shubhra, parents and all family members for their patience and encouragement.
TABLE OF CONTENTS
S. No. Content Page No.
1. Introduction 1
2. Justification 3
3. Objectives 5
4. Literature Review 6
4.1 Magnitude of the problem 6
4.2 Diagnosing latent tuberculosis infection (LTBI) 7
4.2.1 Standard tuberculin test 7
4.2.2 Other tuberculin tests 13
4.2.3 New tests to diagnose latent TB infection 20
5. Materials & Methods 33
5.1 Study design 33
5.2 Study area 33
5.3 Sample size 33
5.4 Study population & sampling method 34 5.5 Informed consent 34
6. Results 37
6.1 General profile of the population 38
6.2 Overall prevalence of LTBI 40
6.3 Prevalence of LTBI in relation to sex 43
6.4 Prevalence of LTBI in relation to BCG vaccination 44
6.5 Prevalence of LTBI in relation to proximity of contact 45
6.6 Prevalence of LTBI in relation to educational status 46
6.7 Prevalence of LTBI in relation to occupation 47
6.8 Agreement between TST and QFT 48
7. Discussion 51
7.1 Prevalence of LTBI 51 7.2 Prevalence of LTBI in adult & pediatric age 53
7.3 Difference in prevalence of LTBI in different groups 54
7.4 Comparison between TST and QFT 55
8. Summary 58
9. Limitations 60
1. INTRODUCTION
Tuberculosis still remains a major public health problem despite the fact that the causative organism was discovered some 100 years back and highly effective drugs are available for its treatment.
Worldwide 9.1 million cases are detected annually out of which half are sputum positive .1
South East Asia which account for 25% of the world’s population accounts for 34% of world’s tuberculosis burden.1
WHO has identified 22 high burden countries in terms of tuberculosis incidence which account for 80% of global tuberculosis burden.1
India ranks 17th among 22 high burden countries in terms of tuberculosis incidence rate.1 India is
the country with the highest burden of tuberculosis in the world accounting for 1/8th of the global
incidence of tuberculosis.2 Annually, around 1.9 million cases of tuberculosis are detected in India out
of which 0.8 million are sputum positive infectious cases.2
In India, everyday more than 5000 people develop tuberculosis disease and nearly 1000 die due to tuberculosis i.e. 2 deaths every 3 minutes.2 Deaths due to tuberculosis exceed the combined deaths
due to all other communicable diseases and account for 26% of all avoidable deaths in adults.2
Tuberculosis affects the most productive age group. Of all tuberculosis cases in India 2/3rd are
male and 70% of all patients are aged between 15 and 54 years.3 More than 3,00,000 children are
forced to leave school because their parents have tuberculosis and about 1,00,000 women with tuberculosis are rejected by their families annually.3
Direct and indirect cost of tuberculosis to India for morbidity alone amounts to an estimated $ 3 billion annually (2000).3 Studies suggested on an average 3 to 4 months of work time is lost as a result
There is an increasing concern about drug resistant tuberculosis. Several small surveys conducted across the country have shown the prevalence rates of Multi Drug Resistant Tuberculosis (strains of Mycobacterium tuberculosis resistant to both Isoniazid and Rifampicin) of around 3% among new cases and 12% among retreatment cases.4, 5
With increase in incidence of HIV infection , there is increasing focus on HIV-TB co-infection. An HIV infected person co-infected with tubercle bacilli has 50-60% life time risk of developing tuberculosis disease as compared to a 10% life time risk of developing tuberculosis disease in a non-HIV infected person.6 Tuberculosis infection refers to a positive tuberculin skin test with or without
2. JUSTIFICATION
The status of the disease and disease trends is one of the basic requirements in the development of control programme for that disease and its subsequent evaluation. Subjects in contact with infective pulmonary tuberculosis may be infected if the index case coughs and expels Mycobacteria into the air. Infected contacts will then develop a progressive immune response and some (between 5-10% of those who are exposed) will develop tuberculosis disease within their lifespan. This progression from infection to disease will depend on several factors , such as age, sex, size of tuberculin reaction, immune status, diabetes, smoking, drug treatment and nutritional status.7,8,9,10 The risk of developing
tuberculosis disease from tuberculosis infection is maximum in the first 2 years following infection and decreases with time.11
In all countries the first priority is rapid detection of cases and their prompt treatment. In regions with a high incidence of tuberculosis a search for contacts among the relatives of smear positive cases may succeed in detecting large number of secondary cases, but the search for infected contacts is less of a priority except among close relatives and small children, who may rapidly develop severe forms of the disease.12
Soon after the introduction of antibiotics (as early as 1959), trials were conducted which demonstrated that, if properly prescribed and taken, preventive treatment reduces the risk of future diseaseand is cost-effective.13, 14
In theory at least, if applied rigorously to infected individuals or to whole population with a high rate of latent tuberculosis infection, this policy could be successful in lowering the incidence of tuberculosis in future.16
infection. For nearly a century the screening for latent tuberculosis infection relied on Tuberculin Skin Testing (TST). While TST is a useful guide for identifying tuberculosis infection, it has a number of drawbacks including the need for a repeat visit to read the test, problems in interpretation due to cross-reactivity with other mycobacterial species, the booster effect, and false negative results because of intercurrent immunosupression, as well as the variability inherent in its application and reading.17The
recent introduction of T-cell based interferon gamma assay (IFN-γ) has demonstrated a role in screening for Mycobacterium tuberculosis infection, contact tracing, and has reportedly overcome some of the drawbacks of TST.18,19,20,21
Most of these studies demonstrating the efficacy of interferon gamma assay are in low incidence countries. More studies are needed for finding the prevalence of latent tuberculosis infection in high prevalence countries using TST and the new IGRA test.
3. OBJECTIVES
1. To estimate the prevalence of latent tuberculosis infection in the household contacts of sputum culture positive tuberculosis patients among suspected multi drug resistant tuberculosis patients in a population covered by CHAD Tuberculosis Unit and District Tuberculosis Centre TB Unit in Vellore district using tuberculin skin testing (TST) and whole blood interferon gamma (i.e. Quantiferon TB –Gold).
4. LITERATURE REVIEW
4.1 Magnitude of the Problem
Tuberculosis represents a serious public health issue worldwide. The 2008 World Health Organization Report on tuberculosis states that a total of 9.2 million new cases (139 per 1,00,000 population) and 1.7 million deaths from tuberculosis occurred worldwide in 2006.1 Deaths due to
tuberculosis comprises 25% of all avoidable deaths in developing countries.1 In developing countries
75% of all tuberculosis cases die in the productive age group of 15 – 50 years. 1
The largest number of cases occur in South East Asia which accounts for 34% of all incident cases globally.1 In 2007 there were an estimated 5.7 million cases in this region. Every year, 3 million
people develop active tuberculosis in this region and 50,000 die.1 In South East Asia 80% of all cases
are in the age group of 15-54 years.1 Bangladesh, India, Indonesia, Myanmar and Thailand accounted
for 95% of global tuberculosis burden.1
Tuberculosis is the biggest public health problem in India. With 1.8 million new cases occurring annually, India accounts for a fifth of the world’s new cases and 2/3rd of all the new cases in South East
Asia.2 More than 80% of the burden of tuberculosis is due to premature deaths, as measuredin terms of
Disability Adjusted Life Years (DALY) lost.2Among all cases 70% occur in the economically
productive age group of 15-54 years.2 Tuberculosis causes huge economic loss with about 17 crores
workdays lost due to the disease every year.3
It is estimated that between 2002 and 2020, approximately 1 billion people will be newly infected, over 150 million will get sick and 36 million will die of tuberculosis, if control measures are not strengthened.3
4.2 Diagnosing Latent Tuberculosis Infection
diagnosis of latent tuberculosis infection is TST. 4.2.1 Standard Tuberculin Test
4.2.1.1 Tuberculin
The tuberculin skin test has been the standard method of diagnosing infection with Mycobacterium tuberculosis. Tuberculin skin testing is done using a purified protein derivative (PPD) whose strength is usually expressed in terms of Tuberculin Unit. The commercially available PPD preparation is defined as the dose of that product which is biologically equivalent to that contained in 5 Tuberculin unit of PPD-S ( PPD –Seibert) i.e., it elicits skin reaction of same size as PPD-S with a error of 20%.24 One Tuberculin
Unit of Purified Protein Derivative RT 23 with Tween 80 corresponds fairly well to 3 TU of PPD-S. Therefore, 2TU of PPD RT 23 with Tween 80 is used for diagnosis or survey.26 Tween 80 is a
stabilizing agent to prevent the absorption of tuberculin to glass surfaces. Purified protein derivative (PPD) RT 23 with Tween 80 is prepared from Mycobacterium tuberculosis by Statens Serum Institute, Copenhagen in Denmark and the seed lot is supplied in freeze dried form to laboratories of individual countries. Other tuberculin available in the market may not be standardized.
Tuberculin vials should be always stored at 2°C - 8°C and used before the expiry period, which is about one year after reconstitution and dilution. Exposure to sunlight and heat must be avoided.27 The
tuberculin should not be allowed to freeze or kept at temperatures above 20oC except for very short
period.
4.2.1.2 Administration of the Test
into the superficial layers of the skin. The area chosen should be free of scars, veins and any inflammation. The test site need not be sterilized before injection.28 It can be simply washed with soap
and water and dried before injection. The injection is given with the standard 1 ml tuberculin syringe graduated to hundredth of a millimeter fitted with 26-gauge needle of half an inch length and 20o bevel.
A glass tuberculin syringe or a disposable tuberculin syringe can be used. No other syringe like a insulin syringe should be used for this purpose.
A satisfactory test should raise a flat pea-sized wheel of diameter 6mm to 10mm with clear pits of hair follicles. There should be no leaking of tuberculin. If the test is unsatisfactory i.e., the correct amount has not been injected or the injection has been made into the subcutaneous tissue , then another injection can be given either at a sufficient distance from the first injection site or in the other forearm.
In some atopic individuals, an urticarial wheel may appear within minutes of injection. It usually disappears within 1 to 2 hours. The formation of vesicle, bullae, lymphangitis, ulceration or necrosis at the site, which may occur in a proportion of children, indicates a high degree of tuberculin sensitivity.29
4.2.1.3 Reading of the Test
The injection of the tuberculin antigen leads to migration and proliferation of sensitized T-cell lymphocytes to the test site. These T-cells release lymphokines, which further attracts other lymphocytes and monocytes.30 This reaction along with the increased permeability of the local blood
capillaries leads to an induration at the test site. The size of this induration is maximum between 48-96 hours after the test .31 The reading of the test is done by measuring the transverse diameter of this
induration during this period.31 The reading of the test should be done in good day light with flexed
4.2.1.4 Interpretation of Tuberculin Test
Population surveys have shown that there are two groups of individuals in any community, one consisting of those “infected with M.tuberculosis bacilli”, the rest have no tuberculin sensitivity or sensitivity due to some other causes. The majority of the reactions above a particular cut off point obtained from tuberculin surveys in respective areas signify infection with tuberculosis bacilli and the majority of the reactions below the cut off are due to other causes. However there is some degree of overlapping between the infected group and the rest even around the cut off points. Therefore at any given cut off point some true infections will be missed and some falsely included. These cut off points as obtained during epidemiological surveys have been found to vary between 10mm to 15mm in different parts of the country.32 However it is impractical to conduct
tuberculin surveys all over the country to find suitable cut off points in respective areas. Therefore, the interpretation of reactions in 10mm- 14mm range requires more careful interpretation.32
Summary of Interpretation of the Tuberculin Test30
Size of Indurations 15mm or above
- Signifies infection with tubercle bacilli irrespective of BCG vaccination status Size of Indurations between 10mm- 14mm
- Could be attributable to one of the following causes
a. Cross reactivity induced by environmental mycobacteria b. BCG vaccination induced sensitivity
c. Infection with tubercle bacilli
Size of Indurations between 5mm- 9mm
- Majority of such reactions are attributable to cross-sensitivity induced by environmental mycobacteria and/ or vaccination with BCG
- It could also be attributable to infection with tubercle bacilli in the presence of immunosuppression
Size of Indurations less than 5mm
- Indicates absence of any type of mycobacterial infections except in children with severe type of immune-suppression
4.2.1.5 Causes of False Negative Reactions to TST 33
a. Infections ( viral infections like measles, chicken pox and HCV, bacterial like recent or overwhelming tubercular infection, leprosy,brucellosis,associated fungal infections).
b. Faulty technique
c. Improper storage and dilution of tuberculin
d. Desensitization due to load of antigens as in military tuberculosis and tubercular meningitis e. Attenuated vaccination against viral infections like measles,mumps,polio
f. Metabolic derangements g. Chronic renal failure h. Protein energy malnutrition i. Lymphoreticular disorders
m. Extremes of ages ( newborn or elderly)
n. Stress (surgery, burns, grafts vs. host disorders o. Denatured or contaminated tuberculin
p. Errors in reading / recording
4.2.1.6 Causes of False Positive Test
4.2.1.6.1 Infection with Non-Tuberculous Mycobacteria
Infection with environmental mycobacteria also causes sensitization of the host. The sensitivity induced by these environmental mycobacteria that are generally non-pathogenic, cross reacts with tuberculin and is known as non-specific sensitivity (NSS). This non-specific sensitivity is highly prevalent in most parts of India as in other non tropical countries. During the tuberculosis prevention trial at Chingelpet, India, 61% of children were found to be infected with environmental mycobacteria by the age of 9 years and almost all by 19 years.34 Therefore, much of tuberculin sensitivity in the
community is due to frequent contact with ubiquitous environmental mycobacteria. However, sensitivity induced by these mycobacteria will lead to smaller reactions to tuberculin than from infection with tubercle bacilli.35
4.2.1.6.2 Effect of Vaccination with BCG
The effect of vaccination with BCG on subsequent tuberculin skin test is highly variable as it partly depends on the strain of BCG used. In a study conducted by National Tuberculosis Institute in Bangalore (India), 70% of the children aged 0-9 years,
vaccinated under Universal Immunisation Programme, elicited either no reaction or a reaction less than 10mm.36 Some studies have shown that the effect of vaccination with BCG on tuberculin skin test
likelihood of a positive tuberculin skin test. 38 They also showed that the effect of vaccination with
BCG on TST was less after duration of 15 years and the reactions more than 15mm are more likely to be the result of tuberculosis infections rather than the BCG vaccination.38
4.2.1.6.3 Booster Phenomenon
On sequential tuberculin testing some persons show a marked increase in the size of their skin reactions that may not be due to recent or past infections. This is called “booster” phenomenon. The increase seems to occur as the initial test stimulates the factors that determines reaction size in the subsequent test.39
4.2.2 Other Tuberculin Test 4.2.2.1 Scariform Test40
There are two types of scariform tests – Von Pirquet Test and Trumbusti Test.
Von Pirquet Test
Trumbusti Test
This test is a slight modification of the Von pirquet test. A single puncture is made through the concentrated drop of OT with a wide bore needle with a beveled edge and needle is turned two to three times so that a small puncture is cut by it. Tuberculin is allowed to dry on the spot. The test is read 2-3 days later.
4.2.2.2 Moro Patch Test40
Around 1908 Moro introduced the percutaneous patch test. Old Tuberculin jelly is placed on the skin of the arm or back and is covered with a plaster. A control test with only the jelly is placed next to the test. Both plasters are removed after a day and both tests are read 2-5 days later. Volmer in 1937 still modified the patch test in which the Old
Tuberculin was dried on adhesive tape and was stuck to the skin. A control patch was applied. The patches were removed after 48 hours and the test were read. All these tests were not quantitative. 4.2.2.3 Multiple Puncture Test40
This is a modification of the Von Pirquet’s and Trumbusti tests. There were multiple punctures instead of two punctures.
4.2.2.4 Heaf Test40
4.2.2.5 Stern Needle Test
The stern needle test is a modification of Heaf Test. It uses detachable metal heads, which can be sterilized in bulk.
4.2.2.6 The Tine Test
This test is done with individually prepared sterilized units. Old Tuberculin is dried on sterilized tine point and used once and discarded. This method cannot quantify allergy.
4.2.2.7 The Dermo Spray Method
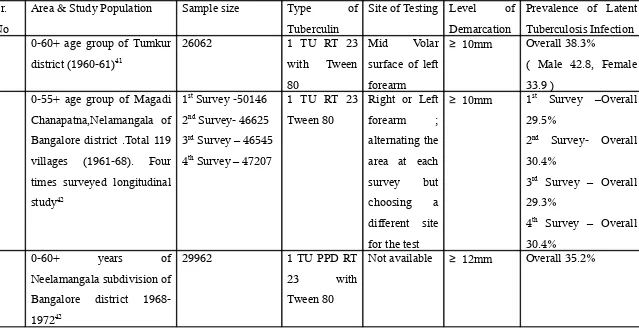
TABLE NO. 1 Latent tuberculosis infection(LTBI) prevalence studies in population using TST
Sr. No
Area & Study Population Sample size Type of Tuberculin
Site of Testing Level of Demarcation
Prevalence of Latent Tuberculosis Infection 1 0-60+ age group of Tumkur
district (1960-61)41
26062 1 TU RT 23 with Tween 80
Mid Volar surface of left forearm
≥ 10mm Overall 38.3%
( Male 42.8, Female 33.9 )
2 0-55+ age group of Magadi Chanapatna,Nelamangala of Bangalore district .Total 119 villages (1961-68). Four times surveyed longitudinal study42
1st Survey -50146
2nd Survey- 46625
3rd Survey – 46545
4th Survey – 47207
1 TU RT 23 Tween 80
Right or Left forearm ; alternating the area at each survey but choosing a different site for the test
≥ 10mm 1st Survey –Overall
29.5%
2nd Survey- Overall
30.4%
3rd Survey – Overall
29.3%
4th Survey – Overall
30.4%
3 0-60+ years of
Neelamangala subdivision of Bangalore district 1968-197242
29962 1 TU PPD RT
23 with
Tween 80
Sr. No Area & Study Population Sample size Type of Tuberculin Site of Testing Level of Demarcation
Prevalence of Latent
Tuberculosis Infection 4 All ages of Chingelpet district of
Tamilnadu in the year 197144
2,63,842 3 TU 0f PPD-S Mid dorsal aspect of forearm
≥ 12mm Overall 50%
5 0-55+ age group of
Magadi,Chanapatna,Nelamangala taluks of Bangalore district
1977-7845
8025 1TU PPD RT 23 with Tween 80
The upper third of the dorsal aspect of the right forearm
≥ 16mm Overall 65.2%
6 All ages of Srinagar, Bramulla and Anantnag district of Kashmir valley in the year 197846
12832 3TU of PPD-S Mid dorsal aspect of the forearm
≥ 12mm Overall 38%
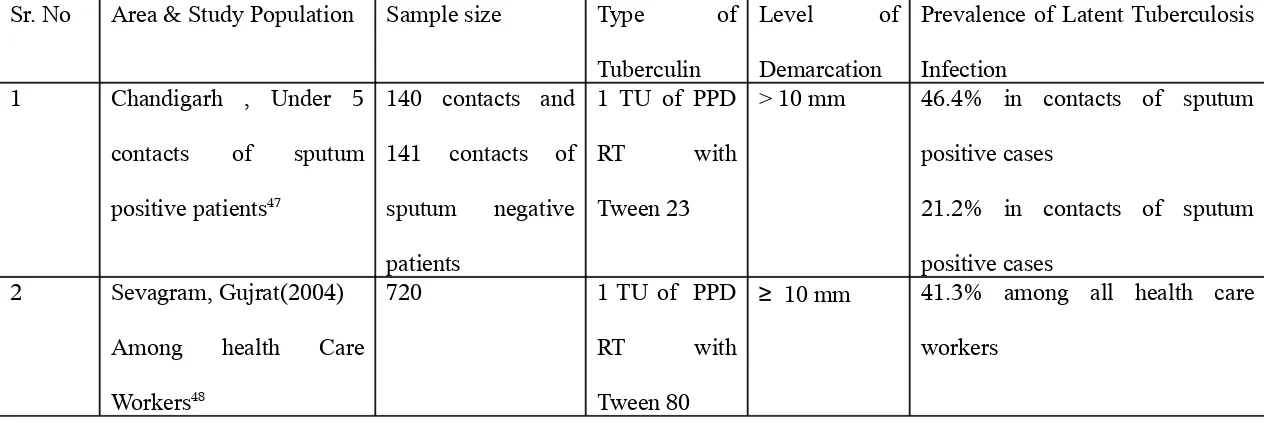
TABLE NO. 2 Prevalence of LTBI among contacts of Infective Tuberculosis
Sr. No Area & Study Population Sample size Type of Tuberculin
Level of Demarcation
Prevalence of Latent Tuberculosis Infection
1 Chandigarh , Under 5 contacts of sputum positive patients47
140 contacts and 141 contacts of sputum negative patients
1 TU of PPD
RT with
Tween 23
> 10 mm 46.4% in contacts of sputum positive cases
21.2% in contacts of sputum positive cases
2 Sevagram, Gujrat(2004) Among health Care Workers48
720 1 TU of PPD
RT with
Tween 80
≥ 10 mm 41.3% among all health care workers
4.2.3 New alternative test to diagnose LTBI
In the absence of a gold standard to diagnose latent tuberculosis infection, it may be difficult to demonstrate that any test is better than the tuberculin skin test. However, the sensitivity of a potential test may be predicted by correlating its result with the degree of exposure (duration and proximity) to a source patient and the likelihood of acquiring infection from that source. A test would be more sensitive than the tuberculin skin test if it is positive in patients with a high risk of exposure. A more specific test could be independent of vaccination with BCG.
Recently new immune – based blood tests were developed for the diagnosis of latent tuberculosis. These tests measures interferon gamma released in response to stimulation of sensitized T-cell by mycobacterial antigens.49 The best studied of these
antigens are Early Secretory Antigenic Target-6 (ESAT-6) and Culture Filtrate Protein- 10 (CFP-10). These tests are called Interferon Gamma Release Assay (IGRA) tests. There are two commercially available diagnostic tests incorporating specific antigens. They are QuantiFERON TB Gold (Cellestis, Australia) and T-SPOT –TB Assay (Oxford Immunotech, UK).
The sensitivity of IGRA tests were studied in patients with active tuberculosis and contacts of infectious tuberculosis patients. From these studies, in patients with active tuberculosis disease , IGRA tests were found to have a sensitivity of 74-96%, while tuberculin skin test (TST) had a sensitivity of 64-69%.51,52,53 In contact tracing studies,
However, in immunocompromised patients, the data is too scarce to make any definite conclusions regarding the agreement between the two tests. One study of 590 HIV- infected patients showed that QuantiFERON TB Gold (QFT-G) test correlated with known risk factors for latent tuberculosis infection or past history of tuberculosis.56
The gold standard proof of latent tuberculosis infection is the eventual development of active tuberculosis disease. This can be observed by conducting a
longitudinal study where tested individuals are followed up for development of active tuberculosis disease. Diel et al, in Germany evaluated 601 close contacts of infective tuberculosis patients of whom 278(46.3%) had vaccination with BCG.57 Tuberculin skin
test was positive in 243(43%), while QFT-G was positive in 66(11%) contacts. All contacts were followed for 2 years. Six of the contacts developed active tuberculosis disease during follow-up and all six were QFT-G positive. None of the QFT-G negative individuals developed tuberculosis. This important study concluded that QFT-G is a more accurate predictor of latent tuberculosis infection than tuberculin skin test (TST).
IGRA tests have several operational advantages over tuberculin skin tests. They require only one visit for blood smpling.57 Automated reading reduces the reader bias in
interpretation. There is no booster effect of the test and, therefore, repeated testing (e.g., in health care workers) does not affect results.57 The test is read in 24 hours. But IGRA
tests need some base laboratory and some technical skills.
The main advantage of IGRA tests is their specificity compared to TST.57 This
they showed good correlation with the degree of exposure to an index case. 54,55,56 In some
studies, sensitivity of IGRA tests was found to be better, particularly among immunocompromised patients.56 Detection of latent tuberculosis infection in these
patients is highly important because of their increased risk of progression to active disease.
The main disadvantage of any IGRA test is their cost. A single assay usually cost around $ 30-40. The cost to the healthcare system may initially increase but the overall cost will decrease, as less latent tuberculosis patients are treated and less visits are required. The question is whether IGRA tests should complement or replace TST. The TST is cheap and sensitive for diagnosing latent tuberculosis infection. However, in BCG vaccinated individuals, its specificity is clearly inferior to that of IGRA tests. The
expensive IGRA test may not be affordable by many developing countries. Therefore, it is likely that TST will remain in use in many parts of the world.
In resource- rich countries, IGRA tests are increasingly utilized. In their, guideline, the Centre for Disease Control and Prevention (USA) has suggested replacing TST with QuantiFERON TB Gold 59 On the other hand British guideline recommend
using IGRA tests as confirmatory tests in those with positive TST results.60 A cost
analysis study in Germany found that screening of contacts by TST followed by QuantiFERON TB Gold Assay in positive TST reactors was the most cost-effective method for screening for latent tuberculosis infection.57
4.2.3.1 QuantiFERON TB GOLD Assay61
heparinised whole blood to release interferon. Detection of interferon- γ (IFN-γ ) by Enzyme Linked Immunosorbent Assay (ELISA) is used to identify in vitro responses to these peptide antigens that are associated with Mycobacterium tuberculosis infection.
QFT is an indirect test for M.tuberculosis infection (including disease) and is intended to be used in conjunction with risk assessment, radiography and other medical and diagnostic evaluation.
4.2.3.2 Steps of QuantiFERON TB GOLD Test61
a. Patient’s blood is collected into blood collection tubes and is mixed by shaking the tubes up and down 10 times to ensure that the entire inner surface of the tube is coated with blood.
QFT TB Gold uses two types of tube for collection of blood namely - Grey cap tube containing nil control
- Red cap tube containing TB Antigen
b. After collection of the blood into the container it is transferred to an incubator as soon as possible and latest within 16 hours of collection. The sample is not
refrigerated or freezed. The tubes are incubated upright at 37°for 16-24 hours. The incubator does no require carbon dioxide or humidification. After incubation at
37°for 16-24 hours, the blood collection tubes may be held between 2 to 27o C for
up to 3 days prior to centrifugation.
c. After incubation of the tubes at 37o C, harvesting of the plasma is facilitated by
separates the cells from the plasma. If this does not occur, the tubes are re-centrifuged at a higher speed. This will separate the plasma and the red cells. d. Plasma samples are loaded directly from blood collection tubes into the QFT-TB
Gold ELISA Plates, especially when automated ELISA workstations are used. e. All plasma samples and regents, except for conjugate 100X Concentrate, are
brought to room temperature (22 – 25o C) before use. At least 60 minutes are
allowed for equilibrium.
f. The freeze dried “kit standard” is reconstituted with equal volume of deionised or distilled water indicated on the label of the standard vial. It is mixed gently to minimize frothing and to ensure complete solubilisation. Reconstitution of the standard to the stated volume produces a solution with a concentration of 8.0 IU/L. The reconstituted kit standard is used to produce a 1 in 4 dilution series of
IFN-γ in Green Dilution (GD).
g. S 1 (Standard I) contains 4 IU/ml , Standard 2 ( S2) contains 1 IU/ml , S3 contains 0.25 IU/ml and S4 contains 0 IU/ml ( Green Dilution).
h. The freeze dried conjugate 100X Concentrate is reconstituted with 0.3 ml of deionised or distilled water. It is mixed gently to minimize frothing and to ensure complete solubilisation of the conjugate.
i. Prior to assay, plasma is mixed to ensure that IFN-γ in evenly distributed throughout the sample.
j. 50 µL of freshly prepared Working Strength Conjugate is added to the required ELISA wells using a multichannel pipette.
pipette. Finally, 50µL each of the Standards 1 to 4 is added.
l. The conjugate and plasma samples / standards are mixed thoroughly using micro plate shaker for 1 minute.
m. Each plate is covered with a lid and incubated at room temperature ( 22o C +- 5oC)
for 120 +- 5 minutes.
n. During the incubation, one part Wash Buffer 20X conjugate is diluted with 19 parts deionosed or distill water and mixed thoroughly. It is washed well with
400µL of working strength wash buffer for at least 6 cycles. An automated plate washer is used.
o. Residual wash buffer is removed by making the plates face down on an absorbent
towel. 100µL of Enzyme Substrate Solution is added to each well and mixed thoroughly using a microplate shaker.
p. Each plate is covered with a lid and incubated at room temperature ( 22o C +- 5oC)
for 30 minutes. Plates are not exposed to direct sunlight during incubation.
q. Following 30 minutes of incubation, 50µL of Enzyme Stopping Solution is added to each well and mixed. Enzyme Stopping Solution is added to the wells in the same order and at approximately the same speed as the substrate.
4.2.3.3 Calculations and Test Interpretation61
QFT –TB Gold IT Analysis software is used to analyse raw data and calculate results. This software is available with Cellistis, Australia. If this software is not used, results can be obtained manually.
The mean OD values of the kit standard replicates on each plate are determined. A standard curve is constructed by plotting the log (e) of the mean OD in the y-axis against
the log (e) of the IFN-γ concentration of the Standard in IU/ml in the x-axis, omitting the 0 standard from the calculation. The line of best fit for the standard curve is calculated by
regression analysis. The standard curve is used to determine the IFN-γ concentration (IU/ml) for each of the test plasma samples, using the OD value of each sample.
TABLE NO. 3 Interpretation of Results when NIL Tube and TB Antigen are used61
NIL (IU/ml)
TB Antigen minus Nil (IU/ml)
QuantiFERON TB ( IU/ml)
Interpretation
≤ 8.0 < 0.35 Negative M.Tuberculosis infection
NOT likely.
≥ 0.35 and < 25% of NIL Value Negative M.Tuberculosis infection NOT likely.
≥ 0.35 and ≥ 25% of NIL Value Positive M.Tuberculosis infection likely.
> 8.0 Any value Indeterminate Results are indeterminate for TB Antigen responsiveness.
4.2.3.4 Cautions and Limitations of Using QFT59
Certain limitations of QFT-TB Gold are similar to that of the TST, but these limitations have not been studied extensively for QFT-TB Gold. Whereas the sensitivity of QFT-TB Gold for detecting M. tuberculosis infection in persons with untreated culture confirmed TB is approximately 80% in published studies, the QFT sensitivity for particular group of TB patients (eg., young children and immunocompromised patients) has not been studied.
QFT-TB Gold sensitivity for detecting latent tuberculosis infection might be less than that of the TST, although the lack of confirmatory test to detect latent TB infection makes it difficult to assess this. Estimating the sensitivity of any indirect test for latent TB infection, like testing the patients who have tuberculosis disease, might be inaccurate because of differences between these conditions. The ability of QFT to predict risk for progress to tuberculosis disease has not been determined.
QFT, as with the TST, cannot differentiate infection associated with TB disease from latent tuberculosis infection. A diagnosis of latent tuberculosis infection requires that tuberculosis disease be excluded by medical evaluation, which should include checking for suggestive signs and symptoms, a chest radiography, and, when indicated examination of sputum or other clinical sample, the presence of M. tuberculosis.
As with a negative TST result, negative QFT result should not be used alone to exclude M.tuberculosis infection in persons with symptoms or signs suggestive of tuberculosis disease. The presence of symptoms or signs suggestive of TB disease increases the likelihood of M.tuberculosis infection, and this decreases the negative predictive value of QFT or TST test in detecting latent tuberculosis infection. Medical evaluation of such persons should include a history and physical examination, chest radiographs, bacteriological studies, serology for human immunodeficiency virus (HIV), and, when indicated , other tests or studies.
The performance of QFT , in particularly its sensitivity, and its rate of indeterminate results, has not been determined in persons who, because of impaired immune function, are at increased risk for M.tuberculosis infection progressing to tuberculosis disease. Impaired immune function can be caused by HIV infection or acquired by immunodeficiency syndrome (AIDS); current treatment with immunosuppressive drugs
including high dose corticosteroids, tumor necrosis factor-α (TNF-α) antagonist and drugs used for managing organ transplantation; selected hematological disorders ( e.g., myeloproliferative disorders, leukemias and lymph node specific malignancies); diabetes ; silicosis; and chronic renal failure. Each of these conditions or limitation is known or suspected to decrease responsiveness to the TST, and that might decrease
production of IFN-γ in the QFT assay. Consequently, as with a negative TST result, negative QFT alone might not be sufficient to exclude M. tuberculosis infection in these persons.
for latent tuberculosis infection. No published data document the performance of QFT in children aged < 17 years.
With any of the testing methods, persons who have a negative result can still have latent tuberculosis infection. Those who have negative but who are likely to have latent TB infection and those who are at a greater risk of developing severe illness or poor outcome from TB disease need treatment or close monitoring for disease.
Potential examples include close contacts who aged less than 5 years; or those who are immunocompromised due to HIV infection or those on any immunosuppressive therapy.
QFT has practical limitations that include the need to draw blood and to ensure its receipt in a qualified laboratory in time for testing. The blood must be incubated with the test antigens < 12 hours after collection to keep the lymphocyte viable. After the blood is incubated with antigens for 16-24 hours, plasma must be collected and either properly stored or tested promptly by ELISA. Collecting the required 5 ml blood sample from young children might not be possible or acceptable
4.2.3.5 Agreement Between Tuberculin Skin Test & QuantiFERON TB Gold
TABLE NO.4 Agreement between QuantiFERON and TST in healthy population with varying risk for LTBI
Study, Year Reference
Country Risk Group Total Participants BCG Vaccinated ( in % )
Brock et al., 2004
Denmark Contacts of persons with TB
45 0
Pai et al., 2005
India Health Care
Workers
719 71
Kang et al., 2005
Korea Close & casual contacts of persons with TB
120 73
Porsa et al.,
2006 USA Prisoners 409
-Ferrara et al.,
2006 Italy Hospitalised adults 286 18
Harada et al., 2006
Japan Health Care
Workers
Study, Year Reference
Country Risk Group Total Participants BCG Vaccinated ( in % )
Dogra et al., 2006
India Hospitalized
children
97 82
Mahomed 2006
South Africa Healthy adults 358 81
Tsiouris et al., 2006
South Africa Pediatric contacts 184 73
Lee et al., 2006
Korea Healthy students 131 100
Nakaoka et al.,
2006 Nigeria Pediatric contacts 179 37
Connell et al.,
[image:33.612.91.608.87.364.2]2006 Australia Pediatric contacts 75 49
5. MATERIALS AND METHODS
5.1 Study Design
The study was done by a cross sectional design. 5.2 Study Area
The study area comprises of population covered by two Tuberculosis Units (TU) in Vellore district: CHAD TU and DTC TU .CHAD (Community Health and Development ) is a 140 bedded hospital run by the Department of Community Health of the Christian Medical College, Vellore. This CHAD TU comprises of 12 peripheral health institutes (PHI) which include CHAD hospital, Narayani hospital and 10 primary health centre (PHCs) run by the government. This TU covers around 6 lakhs population. The other Tuberculosis Unit (TU) is based at District Tuberculosis Centre, Vellore and comprises of 11 PHIs. This includes Christian Medical College and Hospital and 10 other PHCs. This TU covers around 5.5 lakhs populati
5.3 Sample Size
Sample size was calculated using the formula N = 4PQ / d2
Where N= sample size required
P= prevalence of latent tuberculosis infection among contacts from previous studies
Q = 100-P
d= Relative Precision taken as 20% of Prevalence
5.4 Study Population and Sampling Method
Among all the suspected MDR patients in these two TUs a total of 147 were done sputum culture. Out of this 147 patients , 104 found culture positive for M.Tuberculosis. Out of 104 sputum culture positive patients 48 were selected based on the distance of these houses from CHAD within Vellore corporation limits and Kaniyambadi block. 44 of them agreed to participate in the study. From this 44 index cases a total of 154 contacts were identified and subjected to both the tests.
Exclusion Criteria
• Person already diagnosed as having tuberculosis
• Those with signs and symptoms suggestive of tuberculosis
• Those already on chemoprophylaxis for tuberculosis
• Persons known to be immunocompromised
• Children less than 1 year of age
Out of the 38 index cases contacted, 34 agreed to participate in the study. The total number of contacts of these 34 index cases was 154.
5.5 Informed Consent
Information sheet and consent form was written in Tamil and was approved by the
5.6 Methodology
2 Tuberculin Unit (2TU) PPD RT 23 with Tween 80 was used for this study. The standard 2TU PPD is manufactured by Statens Serum Institute (SSI), Copenhagen, Denmark and is not generally licensed for use in India. A license to import and use 2TU PPD from SSI, Copenhagen was obtained from the Drugs Controller General of India.
Two medical laboratory technicians were selected to do the testing and reading. Both the technicians underwent a 7 days training on testing and reading tuberculin skin test under the guidance of Dr.A.N.Sashidhara, Senior Field Investigator at National Tuberculosis Institute, Bangalore.
The houses were visited and formal written consent was taken. A structured questionnaire was administered for obtaining socio demographic parameters.
Blood was collected by venepuncture from cubital vein after cleaning the site with normal saline. The samples were collected into the labeled sample collection tube upto the required marks and were kept at ambient temperature.
The mid volar aspect of right forearm was selected for tuberculin skin testing. The site was identified and cleaned with normal saline. 1 ml 2TU PPD was loaded in the tuberculin syringe. The skin was stretched and the 2TU was applied. In case of unsatisfactory test the procedure was repeated further away from the first site.
The tuberculin skin test was read between 48- 72 hours and the results were reported in millimeter. Any unusual reactions such as abscess, ulceration, necrosis, were also recorded.
5.7 Statistical Analysis
The data were entered and analyzed using EPI INFO 2002 software.
The primary outcome measured was, the prevalence of latent tuberculosis infection using tuberculin skin test with a cut off 10mm and QFT cut off 3.5IU/ml. The data were further stratified into pediatric (<15 years) and adult age group and the prevalence was estimated.
6. RESULTS
Figure No. 1 Study Flow Diagram
1970 sputum positive cases
403 suspected MDR
147 MDR suspects
108 sputum culture
48 contacted
44 agreed to participate
154 contacts screened
4 invalid TST reading 150 valid
results
29 TST – QFT – 01
TST – QFT+ 26
TST + QFT - 94
6.1 General Profile
6.1.1 Characteristics of the study population.
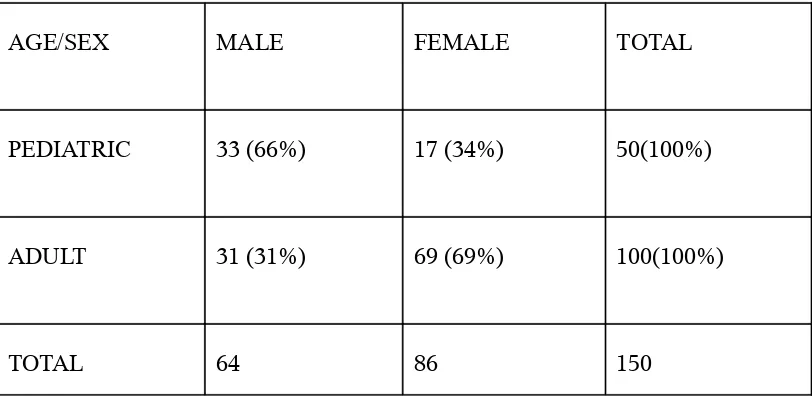
Total number of subjects in the study was 150. Out of this 150, 64 were male constituting 42.7% of the population and 86 were female comprising 57.3% of the population.
TABLE NO.5 Age and sex distribution of the study population.
AGE/SEX MALE FEMALE TOTAL
PEDIATRIC 33 (66%) 17 (34%) 50(100%)
ADULT 31 (31%) 69 (69%) 100(100%)
[image:39.612.122.528.264.464.2]TOTAL 64 86 150
TABLE NO.6 BCG scar status of the study population
AGE GROUP SCAR PRESENT SCAR ABSENT TOTAL
PEDIATRIC 36 (72%) 14 (28%) 50(100%)
ADULT 25 (25%) 75 (75%) 100(100%)
TOTAL 61 89 150
[image:40.612.122.528.127.330.2]6.2 Overall prevalence of LTBI
TABLE NO.7 Prevalence of LTBI by TST
Age Group TST Positive TST Negative TOTAL CHI SQUARE
P VALUE
Pediatric(<15) 32(64%) 18(36%) 50(100%) 12 0.001
Adult 88(88%) 12(12%) 100(100%
)
TOTAL 120(80%) 30(20%) 150(100%
)
[image:41.612.84.521.127.241.2]Above table shows that the TST positivity is higher in adult age group and this difference is significantly higher in comparison to pediatric age group.
TABLE NO. 8 Prevalence of LTBI by QFT
Age Group QFT
POSITIVE
QFT NEGATIVE
TOTAL CHI
SQUARE
P VALUE Pediatric(<15Yrs
)
30(60%) 20(40%) 50(100%)
0.359 0.545
Adult 65(65%) 35(35%) 100(100%
) TOTAL 95(63.3%) 55(36.7%) 150(100%
)
[image:41.612.85.518.377.494.2]TABLE NO.9 Frequency of LTBI by TST and QFT in different age clusters
Table no.9 shows that TST positivity increases with age whereas QFT positivity remains
[image:42.612.102.528.209.431.2]more or less the same which is also seen in figure no. 2 below. Figure 2 Frequency of Latent TB infection with increasing age
6.2.1 Distribution of TST Indurations in the study
Out of 150 individual the TST indurations varies from 0 mm to 25 mm. The frequency distribution is shown in Figure 3.
Figure No. 3. Tuberculin Reaction
0
20
40
60
80
100
120
1 to 5 y rs 6 to 1 0 y rs 1 1 to 1 5 y rs 1 6 to 2 0 y rs 2 1 to 2 5 y rs 2 6 to 3 0 y rs 3 1 to 3 5 y rs 3 6 to 4 0 y rs 4 1 to 4 5 y rs 4 6 to 5 0 y rs 5 1 + y rsDistribution of reaction sizes among contacts
0 5 10 15 20 25
Reaction sizes (0-25 mm)
N
u
m
b
er
o
f
p
er
so
n
s
10 15 20 25
[image:43.612.133.504.94.329.2]5
Figure no. 2 shows the frequency distribution of TST indurations in the study sample. There is a bimodal distribution with a fair antimode. Two clear cut modes are visible. One around the 0 mm mark and another around 20 mm mark.
6.3. Prevalence of Latent Tuberculosis Infection in relation to sex
TABLE NO.10 Prevalence of LTBI by Tuberculin Skin Test (TST) in relation to sex
Above table shows that in both age groups there is no significant difference in different sexes in relation to TST positivity.
TABLE NO.11 Prevalence of LTBI by QFT in relation to sex
6.4 Prevalence of Latent Tuberculosis Infection in relation to BCG vaccination status
TABLE NO. 12 Prevalence of LTBI by TST in relation to BCG vaccination status AGE
GROUP
BCG SCAR
TST
≥10mm TST<10mm TOTAL
CHI
SQUARE P VALUE
Pediatric Present 24(66.7%) 12(33.3%) 36(100%) 0.66 0.797 Absent 8(57.1%) 6(42.9%) 14(100%)
Adult Present 20(80%) 5(20%) 25(100%) 2.02 0.155
Absent 68(90.7%) 7(9.3%) 75(100%)
TOTAL 120(80%) 30(20%) 150(100%
)
[image:44.612.108.556.478.656.2]Above table shows that there is no significant difference in TST positivity in both ages in relation to BCG vaccination status
TABLE NO.13 Prevalence of LTBI by QFT in relation to BCG vaccination
AGE GROUP BCG SCAR QFT POSITIVE QFT NEGATIVE TOTAL CHI SQUARE P VALUE
Pediatric Present 22(61.1%) 14(28.8%) 36(100%) 0.66 0.797 Absent 8(57.1%) 6(42.9%) 14(100%)
Adult Present 16(64%) 9(36%) 25(100%) 0.015 0.904
Absent 49(65.3%) 26(34.7%) 75(100%0
TOTAL 95(63.7%) 55(36.3%) 150(100%)
6.5 Prevalence of Latent Tuberculosis Infection in relation to proximity of contact TABLE NO. 14 Prevalence of LTBI by TST in relation to proximity of contact
AGE GROUP SLEEPING IN -TST Positive TST Negative TOTAL CHI SQUARE P VALUE Pediatric Same
Room 19(70.4%) 8(29.6%) 27(100%) 1.034 0.309 Same
House 13(56.5) 10(43.5%) 23(100%)
Adult
Same
Room 41(97.6%) 1(2.4%) 429100%)
6.345 0.012*
Same
House 47(81%) 11(19%) 58(100%)
TOTAL 120(80%) 30(20%) 150(100%)
* p <0.05
Table no. 14 shows that there is significant difference in latent tuberculosis infection in adults sharing the same room with index case by TST .
TABLE NO. 15 Prevalence of LTBI by QFT in relation to proximity of contact
6.6 Prevalence of Latent Tuberculosis Infection in relation to educational status TABLE NO. 16 Prevalence of LTBI by TST in relation to educational status in adults
EDUCATION TST POSITIVE TST NEGATIVE TOTAL CHI SQUARE P VALUE UPTO
PRIMARY 13(100%) 0(0%) 13(100%)
2.038 0.153 POST
PRIMARY 75(86.2%) 12(13.8%) 87(100%)
TOTAL 88(88%) 12(12%) 100(100%
)
[image:46.612.86.521.392.554.2]Table no. 16 shows that although TST positivity is more in lower educational status, this difference is not statistically difference in both educational group.
TABLE NO. 17 Prevalence of LTBI by QFT in relation to educational status in adults
EDUCATION QFT POSITIVE QFT NEGATIVE TOTAL CHI SQUARE P VALUE UPTO
PRIMARY 10(76.9%) 3(23.1%) 13(100%) 0.934
0.334 POST
PRIMARY 55(63.2%) 32(36.8%) 87(100%)
TOTAL 65(65%) 35(35%) 100(100%
)
6.7 Prevalence of Latent Tuberculosis Infection in relation to occupation TABLE NO. 18 Prevalence of LTBI by TST in relation to occupation in adults
Table no.18 shows that the LTBI in those at home is more than those working, but this difference is not statistically significant.
TABLE NO. 19 Prevalence of LTBI by QFT in relation to occupation in adults
Table no. 19 shows that the LTBI in those at home is more than those working, but this difference is not statistically significant.
[image:47.612.131.529.402.531.2]6.8 Agreement between TST and QFT
TABLE NO. 20 Overall Agreements between TST and QFT
QFT POSITIVE QFT NEGATIVE TOTAL TST POSITIVE
94 26 120
TST NEGATIVE 1 29 30
TOTAL 95 55 150
TABLE NO. 21 Agreement between TST and QFT in BCG vaccinated individuals
QFT POSITIVE QFT NEGATIVE TOTAL
TST POSITIVE 38 6 44
TST NEGATIVE 0 17 17
TOTAL 38 23 61
Table 21 shows that the actual agreement between TST and QFT in detecting latent tuberculosis infection in all those who are BCG vaccinated is 90% and the kappa agreement is 0.779(95% CI 0.613-0.945).
TABLE NO.22 Agreement between TST and QFT in BCG unvaccinated individuals
QFT POSITIVE QFT NEGATIVE TOTAL
TST POSITIVE 56 20 76
TST NEGATIVE 1 12 13
TOTAL 57 32 89
[image:48.612.133.527.418.550.2]TABLE NO. 23 Agreement between TST and QFT in Pediatric Age Group
QFT POSITIVE QFT NEGATIVE TOTAL
TST POSITIVE 30 2 32
TST NEGATIVE 0 18 18
TOTAL 30 20 50
[image:49.612.133.529.364.494.2]Table no. 23 shows the actual agreement between TST and QFT in detecting latent tuberculosis infection in pediatric age group is 96% and the kappa agreement is 0.915(95% CI 0.797- 1.033).
TABLE NO. 24 Agreement between TST and QFT in Adult Age Group
QFT POSITIVE QFT NEGATIVE TOTAL
TST POSITIVE 64 24 88
TST NEGATIVE 1 11 12
TOTAL 65 35 100
7. DISCUSSION
Tuberculosis is a major public health concern in the world and particularly in India. In countries with high incidence of tuberculosis, the priority is early case detection and treatment. Now there is an increasing concern about the benefits of contact investigation to detect people with latent tuberculosis infection, more so with the spread of MDR tuberculosis. The other issue is, which test to use for detecting latent tuberculosis.
The present study was done in keeping two objectives in mind – first, to detect the prevalence of latent tuberculosis infection in contacts of sputum culture positive tuberculosis among suspected MDR cases and secondly, to find the agreement between TST and QFT in detecting the latent tuberculosis infection.
The study was conducted among the household contacts of 44 culture positive tuberculosis patients. The total number of contacts screened were 150 out of which 64(42.6%) were male and 86(57.3%) were female. The total number of patients in the pediatric age (less than 15 years) were 50(33.3%) out of which 33 were male and 17 were female. In the adult age group, a total of 100 subjects were there, out of which 31 were male and 69 were female.
7.1 Prevalence of Latent TB Infection
20mm, are found to be strongly reacting and so they could be logically assumed to compromise of positive reactors specific to tuberculosis infection. From the TST frequency distribution it can be concluded that the TST distribution in the study population more or less follows the same pattern as in general population.70
There are various methods to calculate the prevalence of latent tuberculosis infection from this frequency distribution.71One method is based on
mode-antimode technique. Here, when there is a clear cut antimode, touching the baseline, with two modes, the reactions are identified as those who make up the second mode after the antimode. This method cannot be applied to our study because the antimode touches the baseline twice with a spurt in between.
The other method is the mirror- image technique. In this method, the highest frequency bar is identified from the second mode. The total number of reactors above this is taken (say X). This number is doubled (2X) to make up for both sides of the highest frequency (mirror image). This number (2X) is then added to total number of subjects in the highest frequency (2x + y). This figure is divided by the total number of study subjects (=N) to get the prevalence of latent tuberculosis infection. Using this method the prevalence of latent TB infection is 42%.
According to RNTCP, latent tuberculosis is defined as indurations more than or equal to 10mm.72 As per the RNTCP definition; out of all 150 subjects,
120 have an induration of ≥ 10 mm i.e. 80%. This figure is high in comparison to
other studies done in India.47, 48 Taking a cut-off of TST at ≥ 5mm the prevalence
drops to 60%.From previous studies done in India as illustrated in table no.1, the prevalence of latent Tb infection in general population varies between 29.3% to 65.0%. In studies among contacts of sputum positive patients in India done by, Singh et al47 and Pai et al48 , the prevalence of latent TB varies between 41.3% to
46.4%, as illustrated in table no.2.. This high prevalence (80%) can be explained by the fact that most of the index cases were taken from the “suspect MDR” cases and are likely to have been infective for a longer period. So the contacts have higher chances of getting infection. This is important as we need to know the prevalence of latent infection among contacts of suspected MDR cases as they have potential to develop primary MDR.
7.2 Prevalence of latent TB infection (LTBI) in adult and pediatric age.
due mainly to M. tuberculosis. This may be the reason why QFT also detects the same proportion of positive reactors in the pediatric age group.
In case of adults, due to probable exposure to environmental mycobacterium, which also renders TST to be falsely positive, we get a large number of TST positives. In the same age group, the QFT positivity is only 65% showing that these positives may be those due to M.tuberculosis thus more or less negating the effect of many environmental mycobacteria. With increasing age, the proportion of people with TST positivity increases while the proportion of adults with QFT positive remains more or less the same(Table No.9; Figure No.2). This may also be due to the effect of environmental mycobacterium on TST.
7.3 Difference in prevalence of LTBI in different groups
In relation to sex (Table No.10 & 11) there is no significant difference between male and female in both adult (in TST p value of 0.394 and in QFT p value of 0.153) and pediatric (in TST p value of 0.584 and in QFT p value of 0.900). This shows that both sexes have equal chances of getting latent infection from the infective case in the household.
Comparing the latent tuberculosis infection in adult group in relation to proximity of contact, it is observed that (Table No.14 & 15) contacts sleeping in the same room have a higher chance of getting infection than contacts sleeping in different room(p value with TST is 0.012 and with QFT is 0.030). But in pediatric age group there is no statistically significant difference (p value with TST is 0.309 and with QFT is 0.297) between sleeping in same or different room. From the study it is evident that children are prone to develop LTBI if there is a household contact of infective TB, whether they share the same room or not. This reinforces the stress given to screen household contacts in pediatric group of TB disease.72
In case of adults who are educated up to primary class the LTBI is higher than those who are more educated, but this difference is not statistically significant as illustrated in table no. 16 & 17.
Adults who are home are more prone to infection than those who are working outside. This may be due to longer contact in those staying at home( Table 18 &19).
7.4 Comparison between TST and QFT
Many studies have compared the agreement between whole blood interferon gamma (QFT) assay with tuberculin skin test(TST) in low endemic countries.73 The agreement found in our study ( i.e., 84%) is consistent with the
findings from majority of the studies in the endemic countries.62,74,75,76(Table
agreement between the two tests was found to be 81.4% which is consistent with our study findings.48 Another study in 2006 by Dogra et al. among hospitalized
children in India have found an agreement of 94% between interferon gamma assay and tuberculin skin test.
With regard to BCG vaccination, previous studies have shown that there is
a positive TST/ negative IFN-γ assay discordance in those who are BCG vaccinated. 75, 77 Our study showed that in BCG vaccinated individuals (Table No.
21), the agreement is 90% whereas in BCG non- vaccinated individuals (Table No.22) it is 76%. This discrepancy may be due to misclassification of BCG vaccine status owing to use of scar as a proxy.32 Recent tuberculin survey in India,
involving more than 1 lakh children, have also shown that BCG vaccination does not influence the estimation of annual risk of infection.3 However, BCG
vaccination can have an effect on TST in other populations depending on vaccine strain, timing, frequency and time since vaccination.3 Another factor is the high
prevalence of tubercular mycobacterium in India, which tends to cause non-specific sensitivity.3 Therefore, non tubercular mycobacterium(NTM) infection
might have caused false-positive TST results. Because the QFT assays use RDI antigens, the effect of NTM on the test should be limited. However, the two proteins ( ESAT-6 and CFP-10) used in QFT have potential to cross react with some of the NTM species.59 It has been suggested that these proteins may cross
react with Mycobacterium leprae.78 Therefore, more studies are needed to study
The TST is highly sensitive and moderately specific, depending on the population screened with specificity being more unpredictable. Several studies, have shown a positive association between TST response and subsequent risk of active tuberculosis.8 Randomized trials have shown that treatment of latent
tuberculosis infection, diagnosed using TST, reduces the risk of active tuberculosis by 60-90%.79 TST is simple test with less material cost although it
requires skilled testers.
In contrast, the IFN-γ assay(QFT) have higher specificity than TST, limited cross reactivity due to non-tubercular mycobacterium infections, no cross-reactivity due to BCG vaccinations and therefore better correlations with exposure to M. tuberculosis than TST.18,19,20 Few other advantages of QFT-G includes, only
single visit by patient, elimination of subjective errors and no boosting effect.59
But the most important drawback of QFT-G is the limited evidence of association of QFT is response and subsequent progression to active tuberculosis among contacts of infective TB patients.57 No trials have demonstrated the efficacy of
8. SUMMARY
A cross sectional study was undertaken among the household contacts of sputum culture positive tuberculosis patients among suspected MDR cases in Vellore, South India. Among a total of 147 suspected MDR cases who underwent sputum culture testing, 104 were found culture positive. Of these 44 household were contacted and 40 household agreed to participate in the study. In these 44 household , 154 household contacts were screened. Valid results were available for 150 individuals only. Of 150 for whom valid results are available, 120(80%), were found to be positive for latent tuberculosis infection by TST and 63.3% by QFT. This showed a high prevalence of latent tuberculosis infection among household contacts of infectious tuberculosis patients who are suspected to have MDR TB.
The prevalence of latent tuberculosis infection among pediatric age group ( <15 years) , is 64% and in the adult age group is as high as 88%.This may be due to longer duration of contacts with infective case or due to exposure of adults to environmental mycobacterium. Earlier studies have shown that an early detection and chemoprophylaxis of children with latent tuberculosis infection reduced the incidence of tuberculosis disease and is cost effective. This reinforced the argument that we need to focus on contact tracing, especially among household contacts, to detect more number of latent tuberculosis infections. More studies need to be done to assess the prevalence of LTBI in contacts of special groups like MDR cases.
detecting latent tuberculosis infection. The overall agreement between both the tests is 82% and kappa agreement of 0.571. This high agreement has also been reported by other studies both in endemic and non-endemic countries.
This result has shown that both the tests can be used to detect latent tuberculosis infection. The decision to use any one of them will depend on the setting in which it is used and the resources available. In population, with low tuberculosis infection, where cross-reactivity with other environmental
non-tubercular mycobacterium is an issue IFN-γ assay can be used. IFN-γ assay can also be used where serial testing is needed, as in special groups as healthcare
workers in contacts with tuberculosis patients. Furthermore, the IFN-γ assay may be helpful in screening population in which low return rates for reading TST is a concern.
In high burden, resource limited countries like India, the TST might still serve a useful purpose. In India, a 15-year follow up of 2,80,000 individuals showed that TST response is significantly associated with development of active tuberculosis.8 In India, TST is widely used in diagnosing childhood tuberculosis
9. LIMITATIONS
1. A longer period of training for the readers and testers, as recommended by National Tuberculosis Institute, Bangalore, might have been more
valuable.
2. Important covariates like infection with HIV or other non- tubercular mycobacterium infections were not measured.
10. REFERENCES
1. World Health Organization. Global Tuberculosis Control Report 2009: Epidemiology Strategy Financing. Geneva: World Health Organizatio; 2009.p.7. 2. India. Central TB Division: Directorate of Health Services: Ministry of Health
and Family Welfare. Revised National Tuberculosis Control Program. Status Report 2. New Delhi; March 2009.
3. Ramachandran R, Balasubramanium R. Socio-economic impact of TB on patients and family in India. Int J Tuberc Lung Dis 1999; 3: 869-877.
4. Paramsivam CN. Antituberculosis Drug Resistance Surveillance in TB. Editors SK Sharma and A Mohan. Jaypee Medical Publishers Pvt. Ltd New Delhi; 2001: P 463-476.
5. Tuberculosis Research Centre, Chennai. Trends in initial drug resistance over 3 decades in a rural community in South India. Ind J Tub 2003; 50:75-86.
6. World Health Organization. TB/HIV: A Clinical Manual. 2nd Edition. Geneva:
World Health Organization; 2004.p.37.
7. Horsburg CR Jr. Priorities for the treatment of latent tuberculosis infection in the United States. N Engl J Med 2004; 350(20):2060-67.
8. Radhakrishna S, Frieden TR, Subramani R. Association of initial tuberculin sensitivity, age and sex with the incidence of tuberculosis in South India: a 15-year follow up. Int J Tubec Lung Dis 2003; 7(11):1083-91.