ISOLATION AND CHARACTERIZATION OF
BUCCAL CELL DNA OBTAINED FROM
MOUTHWASH SAMPLES OF HEALTHY,
TOBACCO USERS AND CANCER
PATIENTS.
A Dissertation submitted to
THE TAMILNADU Dr. M.G.R MEDICAL UNIVERSITY,
CHENNAI.
In partial fulfillment for the award of degree of
MASTER OF PHARMACY
(PHARMACEUTICAL BIO-TECNOLOGY)
Submitted by
Reg. No: 26063821
Under the supervision of
Mr. T.SARAVANAN, M.Pharm.,
Asst Professor,
Department of Pharmaceutical Bio-technology
.Nandha College of Pharmacy
Erode – 638 052, (TAMILNADU)
CERTIFICATE
This is to certify that the work embodied in this thesis entitled, “ISOLATION
AND CHARACTERIZATION OF BUCCAL CELL DNA OBTAINED FROM
MOUTHWASH SAMPLES OF HEALTHY, TOBACCO USERS AND
CANCER PATIENTS,
”
submitted to the Tamil Nadu Dr. M.G.R. Medical University, Chennai was carried out by N.V. Britya, in the Department ofPharmaceutical Biotechnology, Nandha College of Pharmacy, Erode-52 for the
partial fulfillment for the award of degree of Master of Pharmacy in Pharmaceutical
Biotechnology under my direct supervision.
This work is original and has not been previously formed the basic for the
award of other degree, diploma, associateship, fellowship or any other similar title
and the dissertation represent entirely an independent work on the part of the
Candidate.
Mr. T. SARAVANAN, M.Pharm., Asst.Professor,
Department of Pharmaceutical Biotechnology, Nandha College of Pharmacy,
DECLARATION
DECLARATION
The work presented in this thesis entitled “ISOLATION AND
CHARACTERIZATION OF BUCCAL CELL DNA OBTAINED FROM
MOUTHWASH SAMPLES OF HEALTHY, TOBACCO USERS AND
CANCER PATIENTS.” was carried out by me in the Department of Pharmaceutical
Biotechnology, Nandha College of Pharmacy, Erode under direct supervision of
Mr. T. Saravanan, M.Pharm., Asst.Professor, Department of Pharmaceutical
Biotechnology, Nandha College of Pharmacy, Erode-52. This work is original and
has not been submitted in part or full for the award of other degree or diploma of any
other university.
Place: N.V. Britya
ACKNOWLEDGEMENTS
ACKNOWLEDGEMENTS
The grace of the almighty and sincere hard work has made the
presentation of this dissertation possible.
On the occasion of presenting this thesis, I take privilege to express my
sincere thanks to my guide T. Saravanan, M.Pharm., Asst Professor Department of
Pharmaceutical Biotechnology, Nandha College of Pharmacy Erode. I am grateful to
Dr. Arumugam Head, Department of Biotechnology Nandha Arts and Science
College, who has provided excellent guidance, valuable advices, and shared
intelligent thoughts, criticisms, and inculcated discipline. I am highly indebted to him
for his valuable presence even in his busy schedule which helped me to complete this
work successfully.
I now take the opportunity to express my deep gratitude towards our
beloved principal Dr. T. Sivakumar M.Pharm., Ph.D., Nandha College of Pharmacy
Erode, for his constant support.
I am thankful to honorable Thiru. V. Shanmugan, B.Com., Chairman
and S. NandhaKumar Pradeep M.B.A., Secretary, Nandha College of Pharmacy,
Erode-52, for providing the required infrastructure.
It is my proud to express my sincere thanks to A. Saravanakumar
M.Pharm., K.KamalaKannan M.Pharm., Asst Professors, Mrs. R. Sumathi
Karthikeyan M.Pharm., Department of Pharmaceutical Biotechnology, for their
timely help and constant guidance throughout my project.
I am very thankful to Dr. Sudhakar MD., RT, HCG Senthil
Multispeciality Cancer centre and Dr. Velavan MD.,RT, Erode Cancer Center for
providing me mouthwash samples of cancer patients and high cooperation in spite of
their busiest schedules.
I express my heartfelt thanks to my friends, N.SaleemBasha, Umesh
Kumar Mishra, Kumud Chandra, S.Princely, John Kirubakaran K.Venkateswaran,
Uma, Ramya, Aruna, and to all my juniors for their cooperation help and useful
discussions during this work.
My beloved thanks to librarian L. Siva Kumar, Computer Staff Mr. P.
Thirumoorthy and Mrs.A.Sasikala and all our staff members for constant
encouragement and kind cooperation.
I like to thank lab technicians Mr. K.M. Senthil Kumar, Mr. N. Nagarajan,
Mr. Gopal and Mrs. Vasugi for their help rendered to me throughout the work. I am
highly indebted to Mr. Hari for helping me in RFLP.
Last but not the least I extend my profound respect and heartful gratitude
to my beloved parents and parents in law Mr. P. Nagarajan, Mrs. Leela Rajan, P.
Arumugam, A. Rajamani and to my better half A. Subramaniam, my beloved brother
N. ManiVannan, M.Sc., my little son S.B.Lohit Aswa, It was their blessing, sacrifice,
patience, encouragement, support, trust and love that kept me going till now.
CONTENTS
CONTENTS
S.NO
PARTICULARS
PAGE NO.
1
.
INTRODUCTION
1
2.
REVIEW OF LITERATURE
32
3.
AIM AND OBJECTIVES
39
4.
PLAN OF WORK
41
5.
MATERIALS AND INSTRUMENTS
43
6.
METHODOLOGY
45
7.
RESULTS AND DISCUSSION
56
8.
SUMMARY AND CONCLUSION
70
ABBREVIATIONS
ABBREVIATIONS
α alpha
β beta
bp base pairs
DNA deoxyribonucleic acid
dATP 2’-deoxyadenosine 5’-triphosphate
dCTP 2’-deoxycytidine 5’-triphosphate
dTTP 2’deoxythymidine-5’-triphosphate
dGTP 2’deoxyguanosine-5’-Triphosphate
EtBr Ethidium bromide
EDTA Ethylene Diamine Tetra Acetate
gDNA genomic Deoxyribonucleic acid
HCl Hydrochloric acid
KCl Potassium chloride
Kb Kilo base
Kbp Kilo base pair
ml Milliliter
µM Micro mole
µg Microgram
µl Micro litre
mM Milli mole
MgSo4 Magnesium sulphate
NaCl Sodium chloride
ng Nano gram
PCR Polymerase chain reaction
rpm Revolutions per minute
RFLP Restriction Fragment Length Polymorphism
RAPD Random Amplification of Polymorphic DNA
RNA Ribonucleic acid
RE Restriction enzyme or Restriction endonucleases
STR Short Tandem Repeats
SNP Single Nucleotide Polymorphism
SDS Sodium Dodecyl sulphate
Taq Thermus aquaticus
TE Tris Ethylene diamine tetraacetate
TBE Tris borate
TAE Tris acetate and EthyleneDiamineTetraAcetate
TPE Tris Phosphate
1.
1.
INTRODUCTION
INTRODUCTION
Deoxyribonuclei acid (DNA) is a molecule present in all living things,
including bacteria, plants, and animals. DNA is the information encoded in genetic
material in other words it carries genetic information that is inherited or passed down
from parents to offspring. It is responsible for determining a person’s hair, eye and
skin color, facial features, complexion, height, blood type, and just about everything
else that makes an individual unique. DNA is responsible for establishing and
maintaining the cellular and biochemical function of an organism1. DNA synthesis is
called replication2.
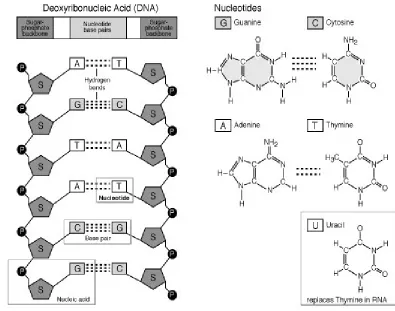
1. STRUCTURE OF DNA3
DNA is a double helix, with bases to the center (like rungs on a ladder) and
sugar-phosphate units along the sides of the helix (like the sides of a twisted ladder).
DNA is a polymer and stores biological information digitally in units called
nucleotides and these specify which proteins an organism will make, as well as when
and where protein synthesis will occur. Each nucleotide consists of a deoxyribose
sugar, a phosphate and a nitrogenous base. The strands are complementary as
deduced by Watson and Crick from Chargaff’s data, A pairs with T and C pairs with
G, the pairs held together by hydrogen bonds. Double ringed purine is always bonded
to a single ring pyrimidine. Purines are Adenine (A) and Guanine (G). Pyrimidines
are Cytosine (C) and Thymine (T). In DNA the sugar is deoxyribose. The bases are
complementary, with A on one side of the molecule the other side is T and similarly
Figure 1. STRUCTURE OF DNA
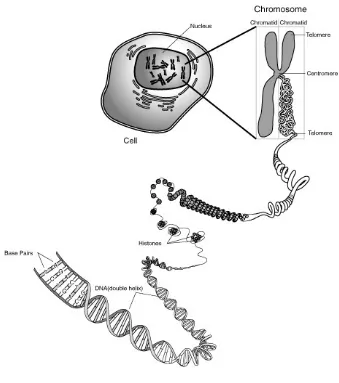
1.1 LOCATION OF DNA
Within cells of an organism, DNA molecules are assembled into
chromosomes, organelles that package and manage the storage, duplication,
expression and evolution of DNA. In the chromosomes of a cell, DNA occurs as fine
spirally coiled threads, that in turn coils around another, like a ladder. The total
length of all DNA in the Cell’s nucleus would be 3km. The entire collection of
chromosomes in each cell of an organism is its genome5. Human cells contain 23
distinct kinds of chromosomes carrying approximately 3×10⁹ base pairs and roughly
hydrogen bonds and hydrophobic interactions established between the stacked base),
it is possible to separate the two strands by treatments involving heating, bringing to
[image:11.595.144.483.201.584.2]alkaline pH6.
Figure 2: Location of DNA
As the Human Genome Project provides the foundation for understanding the
genetic basis of common disease (1) population based genetic studies will provide the
information needed for the practical application of genetic risk factors to chemical and
molecular analyses in epidemiologic studies and surveys in order to identify genetic
risk factors for disease (2) Genomic markers including RFLP, STR, insertion-deletion
polymorphism, SNP and groups of markers inherited together on one chromosome as
haplotypes and being used to locate disease associated genetic loci and studies of the
association between these loci to disease are elucidating the genetic basis for disease.
Once risk associated genotypes are identified the validity of genetic testing for
screening and clinical practice must be assessed7. Interest in genome-wide
association studies to identify susceptibility alleles for cancer is growing, and several
are currently planned or under way. A critical requirement for such large scale studies
is the amount of DNA available from a sample. Traditionally whole blood is the
tissue of choice, as the yield of DNA is quite high (typically 10-15μg/ml). However
obtaining a blood sample is an invasive procedure that requires training in
phlebotomy, and moreover blood samples require refrigerated storage and must be
processed within a week or so of collection. These constraints limit the suitability of
blood collection for some populations which in turn has led to a search for alternative
sources of DNA. The ideal source should meet the following requirements (1) be
non-invasive easy and quick to carry out (2) allow relatively long storage of samples
at ambient temperatures before DNA extraction ( a critical required for field studies)
with minimal loss of DNA quality and finally (3) yield a sufficiently large amount of
DNA for a wide variety of applications. Alternatives that have been investigated to
date, includes dried blood spots, plucked hairs and cheek swabs. However the yield
of DNA is much less than these alternatives than with whole blood, cheek swabs
constitute the highest yielding noninvasive alternative to whole blood as cheek swabs
provide app 5-15μg of DNA8. Although the feasibility of collecting buccal cell
been shown, the validity of using DNA from buccal cells for genome wide scans has
not been assessed9.
Different sample types used in DNA extractions include10
Whole blood, Buffy coats, Blood clots, Serum, Plasma, Cell pellets,
Mouthwash, Buccal swabs, Cytobrushes, Saliva, Bronchial alveolar lavage, Mouse
tails, Plants.
Other solid tissues that can be used for DNA extraction include Breast,
Prostrate, Kidney, Brain, Placental, Heart, Muscle.
Other sample types include Nails, Paraffin embedded tissue, Polyps, Urine, Feces
and sputum. These sample types create great difficulty in isolating DNA.
Normally DNA can be extracted by three methods
1) Non-organic
2) Column Based
3) Organic.
Obtaining high quality genomic DNA is critical for epidemiological studies
that aim to evaluate the role of genetic factors in human disease susceptibility. Blood
samples are an excellent source of large amounts of genomic DNA. However,
epidemiological studies often need alternative sources when study subjects are
reluctant to provide a blood sample, when only a self-administered collection protocol
is logistically or economically feasible or as backup source of DNA in studies that
1.2. BUCCAL CELLS:
Buccal cells are the cells from the inner lining of the mouth, or cheek. These
cells are routinely shed and replaced by new cells. As the old cells die, they
accumulate in the saliva in the mouth and can be easily be collected by a simple
procedure using mouthwash12. The mean number of epithelial cells per 1ml of saliva
is about 4.3x10⁵, whereas the number of nucleated cells in 1ml of whole blood is
about 4.5-11x105. Moreover the turnover of epithelial cells is quite extensive in
mouth, as the surface layer of epithelial cells is replaced on average every 2.7h
suggesting that there is likely to be intact gDNA in saliva samples8.
1.2.1 ADVANTAGES OF BUCCAL CELLS:
Collecting buccal cells enables researchers to better understand the way people
process substances that affect cancer and other diseases and to determine why some
people who are exposed to certain substances develop diseases, whereas others
exposed to the same substances do not. The material in the buccal cell samples,
combined with information on occupational, environmental, and dietary factors,
allows researchers to get a more complete assessment of what is affecting the health
of human population. The buccal cell sample is being collected to study the
differences in genes that may be related to how people process disease-causing
substances and how the effects of diet, lifestyle, environment, race and ethnicity, age,
1.2.2 CHARACTERISTICS OF BUCCAL CELLS
1. Research has shown that sublingual cells correlate well with deep body tissue
such as heart tissue taken during bypass surgery and skeletal muscle biopsies.
2. Buccal cells have high correlation between altered mineral levels and path
physiological conditions in multiple medical syndromes.
3. Sublingual cells provide new and important information as to the status of
cardiac mineral electrolytes in patients with cardiovascular disease.
4. Sublingual epithelial cells offer a rapidly renewing, homogenous cell population
that reflects current total body intracellular mineral status.
5. Buccal cells have a high cytoplasm to nucleus structure facilitating mineral
analysis. Cells contain full metabolic biochemical pathways.
6. Blood and urine levels of minerals and ions do not necessarily reflect what is
happening in the working cellular tissues.
7. Cells contain about 99% of the body’s magnesium and potassium, while serum
contains only 1% of the total.
8. Low intracellular tissue levels of mineral electrolytes may exist wile the serum
levels appear normal.
9. Buccal cells are safe, easy to obtain and use as a smear on specially prepared
slides.
Genomic DNA is identical whether it comes from blood cells or cheek cells.
Buccal cell is viable alternative to isolation from blood. Buccal cell DNA is used for
many diagnostic applications such as epidemiologic studies and paternity testing14.
There are several advantages to buccal cell DNA isolation over blood. First no
needles, are involved, so it is less invasive and painless. It is well suited for young
subjects. Buccal cells provide less of a potential hazard to the people who handle
samples15.
Repeated sampling is not always feasible by blood. With the growing interest
in large scale genomic studies epidemiological studies have become very important in
trying to elucidate gene-environment interaction in individuals prone to multigenic
diseases like cancer and cardiovascular diseases. As already known exfoliated buccal
cells are a good source of DNA and sample collection in such cases is non-invasive
and can be self-administered. The average yield is about 30µg and is sufficient for
more than 300 PCR amplifications. It has been observed that good quality high
molecular weight genomic DNA can be obtained from exfoliated buccal cells in the
early morning mouthwash samples and that the DNA yield from similar samples
decreases during the day, with very low yields obtained in the late evening. This was
due to very few exfoliated cells being present in the oral cavity at the time16. Oral
epithelial cells are constantly exfoliated and may be captured through gentle scraping
of the oral mucosa or by oral rinsing17.
One published study reported the quantity, quality, and stability of hDNA
collected with mouthwash. Specimens yielded a median quantity of at least 32µg
DNA (2-94) if specimens were held for up to 5 days, with yields declining to 21µg
high molecular weight DNA (>23kb) was found in all but 1 out of 24 specimens.
Yields were greater when specimens were collected before brushing teeth7. Self
Collection of oral epithelial cells at a subject’s home or hospital under instruction
from medically trained or untrained personnel is an attractive and efficient approach
for many epidemiologic studies18. Methods for collecting buccal epithelial cells
include cotton swabs, cytology brushes, wooden sticks, and mouthwashes, with
mouthwashes giving greater yields. Several mouthwashes have been tested 3%
sucrose, 5% glucose, saline, water and commercial mouthwash. In addition, clinical
validation studies have shown that DNA diagnostic results from patient-matched
buccal cells and whole blood are comparable. At least 2 main approaches to DNA
purification have been used with mouthwash specimens; (1) a rapid boiling method,
yielding low-quality DNA, and (2) a lengthy phenol-chloroform method using toxic
reagents19.
Method of collection
Median Range SD
Blood 95 10-283 54
Mouthwash 11 4-78 13
Buccal cytobrush 8 4-39 7
(Table 1). According to Neuhas20Total DNA yields (μg) for each
Specimen type
DNA yield Advantages Disadvantages
Blood spots 12-42 ng/μl (adults)
43-78 ng/μl (neonates)
Small sample size Ease of collection Low cost storage
Offers a source for study of exogenous or endogenous compounds other than DNA Genotyping generally requires 10 ng/genotype and with current technology as llittle as 2.5 ng per SNP so that scores to hundreds of genotypes could be obtained from one blood spot
Low DNA yield may not be suitable for whole-genome
amplification. Non renewable Smaller amplicons
Blood cells Whole blood anticoagulated or blood clots Buffy coat
100-400 μg/10ml
200 μg/ml
Relatively low-cost storage Yields large quantities of high quality of genomic DNA
Offers a source for study of exogenous or endogenous compounds other than DNA
Invasive sample collection
Non renewable
Transformed lymphocytes
106cells = 6 μg Renewable source of DNA
Yields large quantities of High-quality genomic DNA
Labor-intensive preparation High cost storage Does not offer a source for study of exogenous or endogenous compounds other than DNA or RNA
Buccal cells 49.7 μg mean; 0.2-134 μg range (total mouthwash DNA) 1-2
μg/cytobrush and swab. 32 μg median; 4-196 μg range human DNA in mouthwash
Noninvasive and easy sample collection. Genotyping generally requires 10 ng/genotype and with current technology as llittle as 2.5 ng per SNP for genotyping for getting more genotypes from buccal cell specimen.
Low DNA yield. Highly variable yield. Does not offer a source for study of exogenous or endogenous compounds other than DNA or RNA.
Bacterial
contamination must be addressed.
1.3. MUTATION
1Mutations are heritable changes in base sequences that modify the information
content of DNA and can alter the amino acid sequence of the protein encoded by the
gene.
1.3.1 Forward mutation:
A mutation that changes the wild type allele of a gene to a different allele is
called a forward mutation.
1.3.2 Reverse mutation or reversion:
Mutation can also cause a novel mutant allele to revert back to wild type.
1.3.3 Substitution:
This occurs when a base at a certain position in one strand of the DNA
molecule is replaced by one of the other three bases. During DNA replication a base
substitution in one strand will cause a new base pair to appear in the daughter
molecule generated from that strand. There are two types
i) Transition: In this a purine replaces the other purine or one
pyrimidine replaces the other.
ii) Transversion: Purine replaces a pyrimidine or vice versa.
1.3.4 Deletion:
Occurs when a block of one or more nucleotide pairs is lost from a DNA
1.3.5 Insertion:
The addition of one or more nucleotide pairs.
1.3.6 Others:
Hydrolysis, Radiation UV and Oxidation can alter the information stored in
DNA.
1.3.7 Depurination:
The hydrolysis of a purine base A or G from the deoxyribose phosphate back
bone occurs 1000times an hour in every human cell. Because the resulting apurinic
sites cannot specify a complementary base the DNA replication process sometimes
introduces a random base opposite the apurinic site causing a mutation in the newly
synthesized complemetary strand 3 quarter of the time.
1.3.8 Deamination:
The removal of an amino group can change cytosine to uracil, the nitrogenous
base found in RNA but not in DNA, and already known U always pairs with A rather
than G deamination follwed by replication may alter a C-G base to T-A pair in future
generation of DNA molecules5. Damaged DNA could mean the failure of important
1.4. DNA Repair mechanisms
The following structural changes occur in DNA during mutation:
• Pyrimidine dimers, in which two adjacent pyrimidines on a DNA strand are
coupled by additional covalent bonds and thus lose their ability to pair.
• Chemical changes of single bases, such as alkylation or deamination, thus
causing changes in the pairing properties of the DNA.
• Crosslinks between the complementary DNA strands, which prevent their
separation in replication.
• Intercalation of mutagenic agents into the DNA causing frameshift
mutations.
• Single strand breaks.
• Double strand breaks22.
DNA repair refers to a collection of processes by which a cell identifies and
corrects damage to the DNA molecules that encode its genome. In human cells, both
normal metabolic activities and environmental factors such as UV light can cause
DNA damage, resulting in as many as 1 million individual molecular lesions per cell
per day. Many of these lesions cause structural damage to the DNA molecule and can
alter or eliminate the cell's ability to transcribe the gene that the affected DNA
encodes. Other lesions induce potentially harmful mutations in the cell's genome,
which affect the survival of its daughter cells after it undergoes mitosis.
rapidly to any damage in the DNA structure. The rate of DNA repair is dependent on
many factors, including the cell type, the age of the cell and the extracellular
environment. A cell that has accumulated a large amount of DNA damage, or one that
no longer effectively repairs damage incurred to its DNA, can enter one of three
possible states:
• an irreversible state of dormancy, known as senescence
• cell suicide, also known as apoptosis or programmed cell death
• unregulated cell division, which can lead to the formation of a tumor
that is cancer.
1.4.1 DNA REPAIR AND CANCER:
Inherited mutations that affect DNA repair genes are strongly associated with
high cancer risks in humans. Hereditary nonpolyposis colorectal cancer (HNPCC) is
strongly associated with specific mutations in the DNA mismatch repair pathway.
BRCA1 and BRCA2, two famous mutations conferring a hugely increased risk of
breast cancer on carriers, are both associated with a large number of DNA repair
pathways, especially NHEJ and homologous recombination. Cancer therapy
procedures such as chemotherapy and radiotherapy work by overwhelming the
capacity of the cell to repair DNA damage, resulting in cell death. Cells that are most
rapidly dividing - most typically cancer cells - are preferentially affected. The side
effect is that other non-cancerous but rapidly dividing cells such as stem cells in the
bone marrow are also affected. Modern cancer treatments attempt to localize the DNA
(concentrating the therapeutic agent in the region of the tumor) or by biochemical
means (exploiting a feature unique to cancer cells in the body)23. ....,...
Worldwide, tobacco kills one human being every six seconds.
• That works out to 560 people every hour, 13,440 people per day and 49 lakh
people per annum.
• Tobacco kills 15 times as many people as suicides, murder or manslaughter45
1.4.2 TOBACCO CHEWING AND SMOKING:
Smoking and tobacco chewing is probably the most obvious factor for adverse
mortality and is perhaps less obvious is that smoking inflicts extensive DNA damage.
Tobacco smoke contains over two hundred chemicals known to cause cancer, known
as carcinogens. The precise mechanism whereby cancer starts is not fully understood.
These DNA mutations are permanent and forever increase the likelihood for
developing lung cancer. Tobacco smoke also contains chemicals in a group called the
polycyclic aromatic hydrocarbons which can lead to specific genetic mutations in a
gene known as ‘p53’. ‘p53’ plays an important role in suppressing tumours and
significantly, mutations in this gene are present in around half of all major human
tumours24. Tobacco smoking is the most important and well documented cause of
cancer currently known. Epidemiological associations have been found for lung,
mouth, pharynx, oesophagus, kidney, bladder, pancreas and cervix cancer. The
relationship with cancer of the mouth, pharynx, oesophagus and lung is easily
explained by their direct contact with smoke. In the light of the fact that over 90%
cancers involve epithelial cells and that DNA damage is considered a crucial
epithelial cells may thus provide a good biomarker of early damage in target tissues21.
Single gene errors account for more than 4,000 known hereditable diseases, and the
list is growing rapidly. A person’s risk for diseases from cystic fibrosis to
Huntington’s disease now can be determined by looking at the DNA.
Given the emphasis on the role of genetics in cancer development and
prevention, simple and cost-effective methods are needed to obtain DNA for
large-scale studies. The methods for buccal cells are of two types: dry procedures that use a
cytobrush or other implements for scraping of the oral mucosa, and wet procedures
that involve swishing liquids in the mouth and spitting into a collection vessel. The
advantages of the swish method appear to be higher average DNA yields, longer DNA
fragments, and possibly higher percentages of human DNA25.
Studies suggest that buccal cell samples remain stable at room temperature for
up to 2 weeks before DNA extraction and they can be successfully analyzed even
after exposure to warm or cold temperatures for 7 days. However evidence from a
study of mouthwash collections suggests that samples should be extracted within 5
days, if possible, to maximize human DNA yields. Extracted DNA samples can be
preserved for several years when store at -20oC.
Among adults studies suggest that mouthwash collections provide buccal cell
DNA of higher quantity and purity than cytobrushes, with the alcohol content serving
as a preservative to retard the growth of bacterial and fungal contaminants. However
mouthwash collection is not an option for infants or toddlers or for adults from
1.5. AGAROSE GEL ELECTROPHORESIS
Agarose is a linear polymer composed of alternating residues of D- and L-
galactose joined by alpha- (1-3) and beta-(1-4) glycosidic linkages. The L-galactose
[image:25.595.201.436.276.353.2]residue has an anhydro bridge between the three and six positions.
Figure 3: Structure of Agarose
Chains of agarose form helical fibers that aggregate into supercoiled structures
with a radius of 20-30nm. Gelation of agarose results in a three-dimensional mesh of
channels whose diameters range from 50nm to 200nm.
1.5.1 THE RATE OF MIGRATION OF DNA THROUGH AGAROSE GELS
The following factors determine the rate of migration of DNA through agarose gels
(i) The molecular size of the DNA:
Molecules of double-stranded DNA migrate through gel matrices at rates that
are inversely proportional to the log10 of the number of base pairs. Larger molecules
migrate more slowly because of greater frictional drag and because they worm their
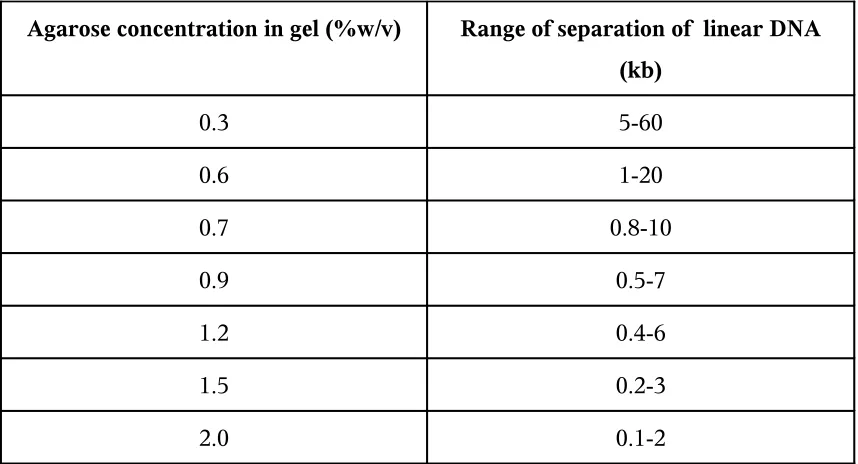
(ii) The concentration of agarose:
A linear DNA fragment of a given size migrates at different rates through gels
containing different concentrations of agarose. There is a linear relationship between
the logarithm of the electrophoretic mobililty of the DNA and the gel concentration.
(iii) The conformation of the DNA:
Superhelical circular (form I), nicked circular (form II), and linear (form III)
DNAs migrate through agarose gels at different rates. The relative mobilities of the
three forms depend primarily on the concentration and type of agarose used to make
the gel, but they are also influenced by the strength of the applied current, the ionic
strength of the buffer, and the density of superhelical twists in the form I DNA.
Under some conditions, form I DNA migrates faster than form III DNA; under other
conditions, the order is reversed. In most cases, the best way to distinguish between
the different conformational forms of DNA is simply to include in the gel a sample of
untreated circular DNA and a sample of the same DNA that has been linearized by
digestion with a restriction enzyme that cleaves the DNA in only one place.
(iv) The presence of ethidium bromide in the gel and electrophoresis buffer:
Intercalation of ethidium bromide causes a decrease in the negative charge of
the double stranded DNA and an increase in both its stiffness and length. The rate of
migration of the linear DNA dye complex through gels is consequently retarded by a
factor approximately 15%. The most convenient and commonly used method to
visualize DNA in agarose gels is stainig with the flouresent dye ethidium bromide
DNA. Ethidium bromide binds to DNA with little or no sequence preference. At
saturation in solutions of high ionic strength, approximately one ethidium molecule is
intercalated per 2.5 bp. After insertion into the helix, the dye lies perpendicular to the
helical axis and makes van der Waals contacts with the base pairs above and below.
The fixed position of the planar group and its close proximity to the bases cause dye
bound to DNA to display an increased fluorescent yield compared to that of dye in
free solution. UV radiation at 254nm is absorbed by the DNA and transmitted to the
dye radiation at 302nm and 366nm is absorbed by the bound dye itself. In both cases,
the energy is re-emitted at 590nm in the red-orange region of the visible spectrum.
Because the fluorescent yield of ethidium bromide-sequence-DNA complexes is
20-30 fold greater than that of unbound dye, bands containing as little as 10ng of DNA
can be detected in the presence of free ethidium bromide (0.5 μg/ml) in the gel.
Ethidium bromide can be used to detect both single and double stranded nucleic acids.
However, the affinity of the dye for single stranded nucleic acid is relatively low and
the fluorescent yield is comparatively poor. In fact, most fluorescence associated
with staining single stranded DNA or RNA is attributable to binding of the dye to
short intrastand duplexes in the molecules.
Ethidium bromide is prepared as a stock solution of 10mg/ml in water, which
is stored at room temperature in dark bottles or bottles wrapped in aluminum foil.
The dye is usually incorporated into agarose gels and electrophoresis buffers at a
concentration of 0.5 μg/ml. Although the electrophoretic mobility of linear
double-stranded DNA is reduced by 15% in the presence of the dye, the ability to examine
the agarose gels directly under UV illumination during or at the end of the run is a
carried out in the absence of ethidium bromide. During restriction digestion the
agarose gel should be run in the absence of ethidium bromide and stained after
electrophoresis is complete. Staining is accomplished by immersing the gel in
electrophoresis buffer or water containing ethidium bromide for 30-45 minutes at
room temperature. Destaining is not usually required. However, detection of very
small amounts (<10ng) of DNA is made easier if the background fluorescence caused
by unbound ethidium bromide is reduced by soaking the stained gel in water or 1mm
MgSO4 for 20 minutes at room temperature.
(v) The applied voltage:
At low voltages, the rate of migration of linear DNA fragments is proportional
to the voltage applied. However, as the strength of the electric field is raised, the
mobility of high-molecular weight fragments increases differentially. Thus, the
effective range of separation in agarose gels decreases as the voltage is increased. To
obtain maximum resolution of DNA fragments >2kb in size, agarose gels should be
run at no more than 5-8V/cm.
(vi) The type of agarose:
The two major classes of agarose are standard agaroses and low-melting
temperature agaroses. A third and growing class consists of intermediate
melting/gelling temperature agaroses, exhibiting properties of each of the two major
(vii) The electrophoresis buffer:
The electrophoretic mobility of DNA is affected by the composition and ionic
strength of the electrophoresis buffer. In the absence of ions electrical conductivity is
minimal and DNA migrates slowly, if at all, In buffer of high ionic strength electrical
conductance is very efficient and significant amounts of heat are generated, even
when moderate voltages are applied. In the worst case, the DNA denature.
1.5.2 TYPES OF ELECTROPHORESIS BUFFER:
Several different buffers are available for electrophoresis of native,
double-stranded DNA. These contain Tris-acetate and EDTA (pH 8.0; TAE) (also called TE
buffer), Tris borate (TBE) or Tris-phosphate (TPE) at a concentration of 50mM (pH
7.5-7.8). Electrophoresis buffers are usually made up as concentrated solutions and
stored at room temperature. All these buffers work well, and the choice among them
is largely a matter of personal preference. TAE has the lowest buffering capacity of
the three and will become exhausted if electrophoresis is carried out for prolonged
periods of time.
When this happens, the anodic portion of the gel becomes acidic and
bromophenol blue migrating through the gel toward the anode changes in color from
bluish-purple to yellow. This change begins at pH 4.6 and is complete at pH 3.0.
Exhaustion of TAE can be avoided by periodic replacement of the buffer during
electrophoresis or by recirculation of the buffer between the two reservoirs. Both
TBE and TPE are slightly more expensive than TAE, but they have significantly
approximately 10% faster through TAE than through TBE or TPE the resolving
power of TAE is slightly better than TBE or TPE for high molecular weight DNAs
and worse for low-molecular weight DNAs. This difference probably explains the
observation that electrophoresis in TAE yields better resolution of DNA fragments in
highly complex mixtures such as mammalian DNA.
Gel loading buffers are mixed with the samples before loading into the slots of
the gel. These buffers serve three purposes They increase the density of the sample,
ensuring that the DNA sinks evenly into the well; they add color to the sample,
thereby simplifying the loading process and they contain dyes that in an electric field,
move toward the anode at predictable rates, Bromophenol blue migrates through
agarose gels approximately 2.2 fold faster than xylene cyanol FF, independent of the
agarose concentration. Bromophenol blue migrates through agarose gels run in 0.5x
TBE at approximately the same rate as linear double stranded DNA 300bp in length,
whereas xylene cyanol FF migrates at approximately the same rate as linear
double-stranded DNA 4 kb in length. These relationships are not significantly affected by the
concentration of agarose in the gel over the range of 0.5-1.4%.
Agarose gels are cast by melting the agarose in the presence of the desired
buffer until a clear, transparent solution is achieve. The melted solution is then
poured into a mold and allowed to harden. Upon hardening, the agarose forms a
Agarose concentration in gel (%w/v) Range of separation of linear DNA (kb)
0.3 5-60
0.6 1-20
0.7 0.8-10
0.9 0.5-7
1.2 0.4-6
1.5 0.2-3
[image:31.595.102.531.107.339.2]2.0 0.1-2
Table 3: Range of separation in Gels containing Different amounts of standard
agarose.
The DNA fragments that results from restriction enzyme cutting are easily
separated and displayed by electrophoresis through agarose gels.
1.6. POLYMERASE CHAIN REACTION
PCR is an invitro method for the enzymatic synthesis of specific DNA
sequences using two oligonucleotides primers that hybridize to opposite strands and
flank the region of interest in the target DNA. A repetitive series of cycles involving
template denaturation, primer annealing and the extension of the annealed primers by
DNA polymerase results in the exponential accumulation of a specific fragment
whose termini are defined by the 5’ends of the primers. Because the primer extension
products synthesized in one cycle can serve as a template in the next, the number of
target DNA copies approximately doubles at every cycle. Thus 20 cycles of PCR
originally applied in Human Genetics department at Cetus to the amplification of
human β-globin DNA and to the prenatal diagnosis of sickle-cell anaemia. PCR was
first proposed in early 1970’s by H. Ghobind Khorana and put in practice by Kary
Mullis and co-workers at Cetus4.
An important property of PCR particularly in diagnostic application is the
capacity to amplify a target sequence from crude DNA preparations as well as from
degraded DNA templates.
1.6.1 ESSENTIAL COMPONENTS OF PCR:
A thermostable DNA polymerase to catalyze template dependent synthesis
of DNA. Taq Polymerase (0.5-2.5U).
A pair of synthetic oligonucleotide to prime DNA synthesis. Primers
should be selected with a random base distribution, and with a GC content
similar to that of fragment being amplified. Primers with stretches of
polypurines polypyrimidines or other unusual sequence should be avoided.
In particularly avoiding primers with 3’end overlaps will reduce the
incidence of primer dimer. Concentration 0.05-0.5μM of primer is
acceptable. Primer dimer is an amplification artificant observed when
many cycles of amplification are performed on a sample containing very
few initial copies of template. It is a double stranded fragment whose
length is very close to the sum of two primers and appears to occur when
one primer is extended by the polymerase over the primer. High
concentration of primers favour mispriming which may lead to nonspecific
dNTPs 200-250 μM of each dNTP are recommended for Taq polymerase
in reactions containing 1.5mM MgCl2.
Buffer to maintain pH : Tris-Cl (pH 8.3-8.8). Monovalent cations:
Standard PCR buffer contains 50 mM KCl and works well or amplification
of segments of DNA >500 bp in length. 1.5 mM MgCl2 is optimal (200
μM each dNTP). Generally excess Mg2+ may results in the accumulation
of non-specific amplification products and insufficient Mg2+ will reduce
the yield.
Template DNA: In case of mammalian gDNA up to 1.0 μg of DNA is
utilized/reaction an amount that contains approximately 3x 10⁵copies of a
single copy autosomal gene.
Thermostable DNA polymerases: This is isolated from two classes of
organisms the thermophilic and hyperthermophilic eubacteria
Archaebacteria. Sometimes cocktails are preferred.
PCR in short is denaturation of the template by heat, annealing of the
oligonucleotide primers to the single stranded target sequence and extension of the
annealed primers by a thermostable DNA polymerase56. Process usually involves the
1.6.2 Denaturation:
dsDNA template denature at a temperature i.e., determined in part by their
G+C content. The higher the proportion of G+C, the higher the temperature required
to separate the strands of template DNA. The longer DNA molecules the longer time
required to separate. If temperature is short or time is short, only AT rich regions of
the template DNA will be denature. When the temperature is reduced later in the
PCR cycle the template DNA will reanneal into a fully native condition. This is
carried out at 94-95 0C which is the highest temperature the enzyme can endure for 30
or more cycles. Higher temperature may be required to denature template that are
rich in G+C content. DNA polymerases isolated from Archae are more heat tolerant
than Taq.
1.6.3 Annealing:
If Annealing temperature is too high the oligonucleotide primers anneal
poorly, yield is also low. If temperature is low nonspecific annealing of primers may
occur, resulting in unwanted amplification.
1.6.4 Extension of oligonucleotide primers:
72-78 0C is the optimum temperature for extension. The polymerization rate
of Taq polymerase in approximately 2000 nucleotides/min and carried for 1 min for
every 1000 bp of product. Result of PCR is not altered by using 3 times longer
Standard reaction
The standard PCR is typically done in a 50 or 100 μl volume an in addition to
the sample DNA contains 50 mM KCl, 10 mM Tris HCl (pH 8.4), 1.5 mM MgCl2, 100
μg/ml gelatin, 0.25 μM of each primer, 200 μM of each deoxynucleotide triphosphate
(dATP, dCTP, dGTP, dTTP) and 2.5 U of Taq polymerase.
1.6.5 RAPD-PCR46
RAPD stands for random amplification of polymorphic DNA. It is a type of
PCR reaction, but the segments of DNA that are amplified are random.No knowledge
of the DNA sequence for the targeted gene is required, as the primers will bind
somewhere in the sequence, but it is not certain where exactly it binds. This makes the
method popular for comparing the DNA of biological systems that have not had the
attention of the scientific community, or in a system in which relatively few DNA
sequences are compared (it is not suitable for forming a DNA databank). Due to the
fact that it relies on a large, intact DNA template sequence, it has some limitations in
the use of degraded DNA samples. Its resolving power is much lower than targeted,
species specific DNA comparison methods, such as short tandem repeats. In recent
years, RAPD is used to characterize, and trace, the phylogeny of diverse plant and
animal species.
1.7. POLYMORPHISMS
Variation whatever may be its cause and however it may be limited, is the
essential phenomenon of evolution. The readiest way, then of solving the problem of
polymorphism has been defined as a ‘Mendelian trait’ that that exists in the
population in at atleast 2 phenotypes, neither of which occurs at a frequency of less
than 1%. Some DNA polymorphisms are neutral single base pair changes detected by
virtue of the consequent introduction or removal of a restriction enzyme recognition.
These are variations in DNA sequence between individuals. There are about
60,000 polymorphisms in human genome27. RFLPs are not rare being distributed
throughout the genome at a frequency of between 1/200 and 1/1000 bp. Not
unexpectedly, the vast majority of polymorphisms occurs in introns or intergenic
regions rather than within coding sequences and may thus be expected to be neutral
with respect to fitness. Those polymorphisms that occur either in coding regions or in
the promoter region may however affect whether the structure or function of the gene
product or the expression of the genes and may have the potential to be of phenotypic
or even pathological significance. Restriction enzymes are named based on the
bacteria in which they are isolated in the following manner:
E Escherichia (genus)
Co coli (species)
R RY13 (strain)
Enzyme Source Recognition sequence Cut Average Fragment Size (Kb) Estimated number of sites
EcoR I Escherichia coli 5’ GAATTC
3’ CTTAAG
5’---G AATTC---3’
3’---CTTAA G---5’
5 6x10⁵
BamHI Bacillus
amyloliquefaciens
5’ CCWGG
3’ GGWCC
5’---G GATCC---3
3’---CCTAG G---5’
5 7.5x10⁵
HindIII Haemophilus
influenza
5’ GGATCC
3’ CCTAGG
5’---A AGCTT---3’
3’---TTCGA A---5’
[image:37.595.107.542.106.381.2]4 6x10⁵
Table 4: Restriction enzymes and their property
1.7.1 RFLPS:
In practice the DNA of many individuals of one lineage is first cleaved with a
restriction enzyme which exhibits a probe. At present approximately 200 different
RFLP probes for a total of 10 restriction enzymes have already been identified and
employed for mapping purpose. Occasionally RFLPs may also be caused by more
complex phenomena such as deletions or insertions. DNA polymorphisms offer a
number of advantages for mapping genomes firstly number of DNA markers already
exceeds that of suitable protein markers, secondly a DNA sequences does not
necessarily have to express a protein in order to be identified by polymorphism
cleavage sites. DNA polymorphisms can of course occur in any DNA sequence
RFLPs are especially useful for identifying genetic defects in humans and can
be exploited for diagnostic purposes as long as the DNA alternations involved do not
occur several times, and are associated with single genes. Most of the RFLPs known
today appear to have occurred randomly and bear no relation to neighboring gene.
RFLPs were first used for characterizing mutant viruses. In humans, RFLPs
were first identified in the vicinity of the globin gene and have been used for
diagnosing sickle cell anaemia. It can be also used for mapping genes and hence for
characterizing genetic defects even if the gene in question is completely unknown28.
1.7.2 Mutation specific RFLPs29:
In some single gene disorder the mutation responsible eliminates a restriction
enzyme recognition site. This direct approach has been used in sickle-cell disease
using the Restriction enzyme Mst II.
Variation in the nucleotide sequence of the human genome is common,
occurring approximately once every 200 bp. These single base pair differences in
DNA nucleotide sequences are inherited in a Mendelian codominant manner and have
no phenotypic effects as they usually occur in intergenic non-coding DNA. If a
difference in DNA sequence occurs within the nucleotide recognition sequence of a
restriction enzyme the DNA fragments produced by that RE will be of different
lengths in different people. This can be recognized by the altered mobility of the
1.7.3 Restriction enzyme digestion:
Restriction digestion is the process of cutting DNA molecules into smaller pieces
with special enzymes called Restriction endonucleases or Restriction enzymes.
Restriction enzymes are bacterial enzymes which cut (hydrolyse) DNA into defined
and reproducible fragments. In bacteria, they form part of the Restriction
modification defense mechanism against foreign DNA. They are basic tool for gene
cloning. These special enzymes recognize specific sequences called palindromic
sequence in the DNA molecule and cleave symmetrically in both strands. Restriction
digestion begins by mixing the DNA and the Restriction enzyme. The actual reaction
conditions vary from one enzyme to the next and include temperature, NaCl and/or
MgCl2, concentration, pH. All of these variables except temperature are optimized by
mixing the enzyme and DNA with a buffer specific for the enzyme of choice. Once
the ingredients are mixed in the reaction tube, the tube is incubated at the reaction
optimal temperature for 1 hour or longer. Then finally when the digest has run for the
appropriate amount of time, the reaction tube is put back on ice to prevent nonspecific
degradation of DNA. The principle behind the technology rests on the possibility of
comparing band profiles generated after Restriction digestion in DNA molecules of
different individuals. Diverse mutations that might have occurred affect DNA
molecules in different ways producing fragments of variable lengths. These
2.
2. REVIEW OF LITERATUREREVIEW OF LITERATURE
Ingrid Meulenbelt et al.,36 (1995), adopted non-invasive DNA sampling and
isolation method involving oral samples taken with cotton swabs. Out of 262
DNA samples isolated using mouth swabs, 257 were successfully used in PCR
reactions of 20 different human loci. They also found that phenol/chloroform
extractions used to isolate uncontaminated genomic DNA without yeast spores or
bacteria could be used for DNA analysis other than PCR. They have used this
method for genetic linkage study, various genetic population studies, and in
zygosity determination of twin pairs.
Amy H. Walker et al,37 (1999), processed 995 buccal swabs for use in PCR based
genotype assays. They processed biosamples for as long as 3 years and found no
appreciable decrease in the rate of PCR success. They concluded that adequate
DNA for PCR-based applications could be obtained from buccal swabs, but
sampling or processing considerations might be important in obtaining optimal
results.
Lea C. Harty et al., 18 (2000), devised a simple, non invasive, cost efficient
technique for collecting buccal cell DNA for molecular epidemiology studies.
Subjects brushed their oral mucosa and expectorated the fluid in their mouths
which was applied to Guthrie cards pretreated to retard bacterial growth and
inhibit nuclease activity. The cards were well suited for transport and storage
because they dry quickly, need no processing and were compact and lightweight.
rinses for collection of buccal cell DNA and offer some advantages over other
methods.
Lea C. Harty et al.,17 (2000), found that self collection of oral epithelial cells
under the direction of a trained interviewer yielded similar quantities of DNA as
clinic based collection by a medical technician and larger quantities of DNA were
obtained from men than from women. Men may have larger buccal mucosal
surface areas or may brush harder, thereby loosening more cells. Thus, self
collection of DNA by using oral rinses could be a suitable method for obtaining
high quality samples and achieving high participation rates.
Loie Le Marchand et al.,38 (2001), assessed the feasibility of obtaining buccal
cell DNA by mail from participants in a large community based cohort study I in
Hawaii. They found that the mean DNA yield was lower in females (41.7µg)
than in males (53.4 µg) and in Japanese (37.8 µg) as compared with Hawaiians
(51.9 µg) and Caucasians (54.8 µg). All samples were successfully genotyped or
polymorphisms in the CYP1A1, CYP2E1, GSTM1, GSTT1 and NQO1 genes by
PCR-RFLP. From these data they concluded that in situations where blood
samples cannot be obtained, mail collection of mouthwash samples should be
considered because it yielded substantial amounts of high quality gDNA for
large number of study subjects.
Heather Spencer Feigelson etal.,29 (2001), used a mouthwash protocol to collect
six daily buccal cell samples from 35 healthy volunteers. They determined total
DNA, human specific(hDNA), degradation of DNA, and ability to amplify by
amount of hDNA by nearly 40%. Their results suggests that buccal cells should
be collected before brushing teeth and processed within 5 days of collection to
maximize hDNA yield.
Schichun Zheng et al.,40 (2001), collected buccal samples from children ranging
in age from 4 months to 15 years. They evaluated a technique that involves
Whole Genome Amplification using the improved primer extension
preamplification method. They reported that the standard buccal protocol failed
to yield successful PCR reactions in 30-51% of specimens whereas WGA buccal
protocol however produced genotyping results fully concordant with the referent
blood or bone marrow DNA results for all fine loci, and is very useful for
improving the efficiency and validity of PCR based genotyping in pediatric
populations.
Ellen M. Heath et al.,19 (2001), developed a noninvasive sampling method for
collectingcells for routine DNA testing in a clinical laboratory setting. Of the five
mouthwashes tested, Scope brand mouthwash received the highest overall
ranking. They found in a 4 week, room temperature stability study, the DNA in
mouthwash samples was stable for at least 2 weeks, yields ranged from around
12-60 µg/ donor, and the DNA was of high quality and the yield was suitable
for use in downstream analytical application such as Southern blotting,
amplification analysis, sequencing and archiving.
Montserrat Garcia-Closas et al.,11 (2001), conducted a two phase study and in
phase I they compared cytobrush and mouthwash samples collected by mail in
case control study of breast cancer (b) Mouthwash samples (n=40) from
prospective cohort of male US farmers. Findings from phase I were confirmed in
phase Ii where they randomized cytobrush (n=28) and (n=25) samples among
participants in the breast cancer study and compared both collection methods.
The median human DNA yield determined by hybridization with a DNA probe
from Phenol chloroform extracts was 1 and 1.6 μ/2 brushes for phase 1and 2, and
27.5 and 16,6 µg per mouthwash samples for phase 1 and 2 respectively. Most
(94-100%) mouthwash extracts contained high molecular weight DNA(>23kb) in
contrast to 55-61% of brush extracts. They concluded that a single mouthwash
sample provided substantially higher molecular weight DNA than two cytobrush
sample.
Stephanie J. London et al.,41 (2001) collected large quantities of buccal cell
DNA in school children. They brushed each buccal surface with a soft toothbrush
and then rinsed with 10ml of water. They preferred the toothbrush method
because of the higher total DNA yields and greater success in generating PCR
products. Out of 1563, samples they obtained results for SNP in the
interleukin-13 gene(at 2044) by RFLP-PCR on 98.8% and in the promoter at the
myeloperoxidase gene (at 463) by real time PCR on 99.7%.
Karen Steinberg et al.,7 (2002), have reviewed current practices for DNA
Banking in Epidemiology studies and focused on 4 types of specimens namely
whole blood preserved as dried blood spots, whole blood from which gDNA is
isolated, immortalized lymphocytes from whole blood or separated lymphocytes
prepared immediately or subsequent to cryopreservation and buccal epithelial
most current and future molecular applications. Buccal cells were considered
when noninvasive self-administered or mailed collection protocols were required.
Satia-Abouta et al.,25 (2002), compared the DNA yield, quality and associated
costs of buccal cell DNA collected using cytobrushes and swish in
self-adminstered procedures. They found a non-statistically significant higher yield
from mouthwash compared with cytobrush collections (15.8 µg vs. 12.0 µg
respectively). They concluded that collection of DNA with cytobrushes using
simple instructions was cost effective in large scale studies and yielded sufficient
quantity and quality of DNA for genotyping.
Tara Engeman Andrisin et al.,42 (2002), determined long term stability, quantity
and quality of genomic DNA samples collected in buccal cells by the mouthwash
method, for use in pharmacogenetic studies. They concluded that genomic DNA
in mouthwash was stable for prolonged periods at room temperature, and was
sufficient for pharmocogenetic studies.
Philip E. Castle et al.,43 (2003), collected buccal cells from 29 participants, by
use of mouthwash rinses and were split into equal aliquots, with one aliquot
irradiated by electron beam irradiation equivalent to the sterilizing dosage of U.S.
Postal services and the other left untreated. They checked that irradiated aliquots
had lower median DNA yields (3.7µg/aliquots) than untreated aliquots (7.6
µg/aliquots) and were more likely to have smaller maximum DNA fragment size
on the basis of genomic integrity gels, than untreated aliquots. They concluded
that E-beam irradiation reduced the yield and quality of buccal cell specimens and
some amplified analyses of many common genomic targets, assays that target
longer DNA fragments (>989 bp) or require whole genome amplification may be
compromised.
T. Neuhas et al.,20 (2004), used Light Cycler technology in analysis of
non-invasively derived DNA. DNA extracted from blood, mouthwash and buccal
cytobrush samples from 100 volunteers were analyzed for the genotypes of
cytochrome P450, CYP1B1, glutathione-S-transferases GSTT1, GSTM1 and
GSTP1. The median amounts of DNA isolated from blood, mouthwash and
buccal cytobrush samples were 95,11 and 8µgrespectively.
Audrey F Saftlas et al.,26 (2004), tested two cytobrush collection methods to
optimize total DNA yield and purity for HLA (Human Leukocyte Antigen)
genotyping in mothers and infants. One was brushing the left and right inner
cheeks and the second was brushing the upper and lower gutters. Mother gutter
samples yielded higher amounts of DNA than cheek samples. While DNA yield
from cheek and gutter collections from infants were equivalent. They also
concluded that cytobrushes stored in paper envelopes yielded significantly more
and higher purity DNA than brushes in plastic bags or tubes.
Clarie Mulot et al.,44 (2004), compared the gDNA obtained from buccal cells
through mouthwash, cytobrush and treated cards. They analyzed the amount and
quality of DNA and the influence of a lag time at room temperature to simulate
delays of sample mailing. They found that mouthwash was more expensive, than
They also demonstrated that cytobrushes could be used for studies with very
young subjects, on a large scale.
Dominique Quinque et al.,8 (2006), developed a simple noninvasive procedure
for saliva sample collection, DNA collection and DNA extraction. The average
amount of human DNA was about 11.4 μg/ml of saliva which was more than the
DNA obtained from other noninvasive samples such as cheek swabs. They
determined the amount of human specific genomic DNA by TaqMan assays
which varied from 5.7 to 100% of the total DNA, suggesting nonhuman DNA was
present in the extracts.
Priya Koppikar et al.,16 (2006), evaluated that good quality high molecular
weight genomic DNA can be obtained from exfoliated cells in the early morning
mouthwash samples, and that the DNA yield from similar samples decreases
during the day, with very low yields obtained in the late evening. They also
determined that DNA so obtained was successfully amplified by PCR, and can be
3. AIM AND OBJECTIVE
3. AIM AND OBJECTIVE
Interest in genome-wide association studies to identify susceptibility alleles
for cancer is growing, and several are currently planned or under way. A critical
requirement for such large scale studies is the amount of DNA available from a
sample. Traditionally whole blood is the tissue of choice, as the yield of DNA is quite
high (typically 10-15 μg/ml). However obtaining a blood sample is an invasive
procedure that requires training in phlebotomy, and moreover blood samples require
refrigerated storage and must be processed within a week or so of collection together
they may cause potential hazard to the handlers.
The present study was aimed at investigating the suitability of analyzing the
genotype by using genomic DNA collected non-invasively by mouthwash in
association with the RAPD-PCR approach and by studying genetic polymorphisms by
RFLP. In the light of the fact that over 90% cancers involve epithelial cells and that
DNA damage is considered a crucial mechanism in cancer development, the
evaluation of DNA damage in buccal epithelial cells may thus provide a good
biomarker of early damage in target tissues.21
Working with human genome, Botstein proposed the use of DNA fragments
as genetic markers for monitoring segregation. The first molecular markers to be used
were fragments produced by digestion of DNA with restriction enzymes. The
variation in fragment size obtained from different individuals after the digestion
created the class of markers called restriction fragment length polymorphism (RFLP).
the DNA of a normal people, we may find that a particular restriction site is present or
absent from the patients.
Molecular markers are DNA fragments that can be used as a fingerprint in the
identification or characterization of individuals. These markers have become an
increasingly helpful tool in genetic research and applications to biotechnology. The
basic premise behind molecular markers is that there is natural genetic variation in
individuals, and many genetic sequences are polymorphic, meaning they differ among
individuals. The objective of this work is to find out the variation i.e., polymorphism
which would be helpful in diagnosing genetic defects. Molecular markers seek to
exploit this variation to identify individuals, traits, or genes on the basis of genetic
differences.
The RFLP performed was to find variation between individuals namely
healthy, tobacco users and cancer patients by exposing their DNA to
Restriction enzymes and running an aliquot of the resulted DNA on 1% Agarose. The
DNA will be separated according to their molecular weight and bands generated
would be useful in tracing out the difference. This property can be used for
4. PLAN OF WORK
4. PLAN OF WORK
A. Selection of volunteers andcollection of mouthwash samples.
Volunteers mainly chosen were healthy persons, tobacco chewers, cancer
patients preferably with oral cancer. The mouthwash chosen were 4% sucrose
solution, 0.9% saline and 2 branded mouthwashes.
B. Isolation of genomic DNA from mouthwash samples using,
i) simple protocol including NaCl, EDTA, NaOH, & Tris Hcl.
ii) a lengthy protocol using phenol chloroform extraction.
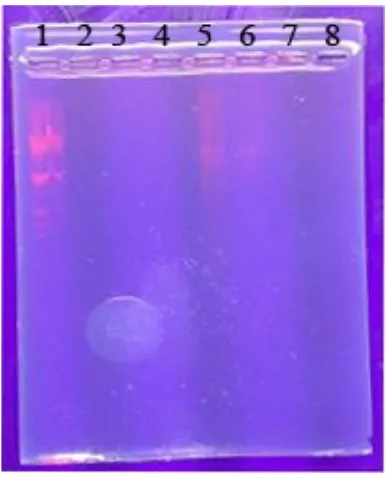
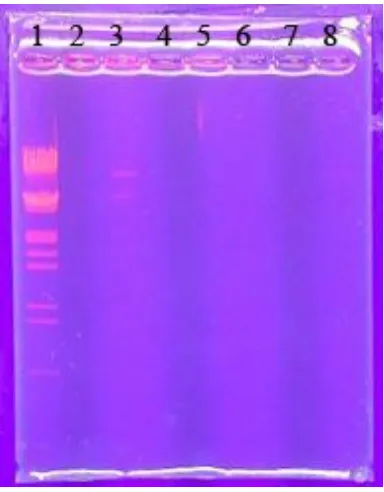
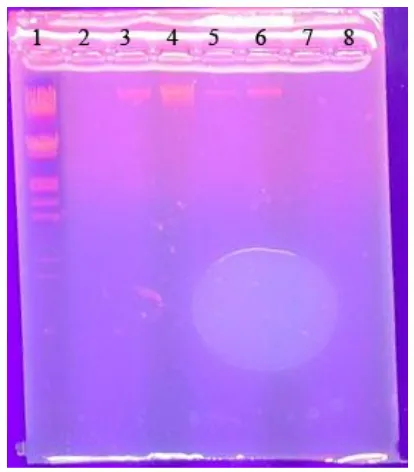
C. Agarose gel electrophoresis
1% agarose gel was used to find out the purity and yield of DNA present in the