A COMPARISON OF PLASTER, DIGITAL AND
RECONSTRUCTED STUDY MODEL ACCURACY
Dissertation submitted to
THE TAMILNADU Dr.M.G.R.MEDICAL UNIVERSITY
In partial fulfillment for the degree of
MASTER OF DENTAL SURGERY
BRANCH V
ORTHODONTICS AND DENTOFACIAL ORTHOPAEDICS
ACKNOWLEDGEMENT
First of all, I wish to thank GOD for his love, grace, mercy and wisdom which form the foundation of my life and all my work.
With deep satisfaction and immense pleasure, I present this work undertaken as a Post Graduate student specializing in Orthodontics and Dentofacial Orthopaedics at Ragas Dental College and Hospital. I would like to acknowledge process of working on this dissertation which has been a wonderful and enriching learning experience.
I am greatly indebted to my professor Dr. N.R.Krishnaswamy, M.D.S., M.Ortho RCS. (Edin), Diplomat of Indian board of Orthodontics, Professor and Head, Department of Orthodontics, Ragas Dental College and Hospital, Chennai., for his guidance and support. He is a pioneer with vast teaching experience who sets an example by his dedication, focus and determination. His words have imprints of genius. His constant guidance in the academic front during my studies has helped me a lot. I have been fortunate to study under his guidance and support. These memories definitely would cherish throughout my life.
I would like to extend my heartfelt gratitude to Dr.S.Venkateswaran, M.D.S., D.N.B. (Ortho)
,
Professor, Department of Orthodontics and Dentofacial Orthopaedics, Ragas Dental College and Hospital, Chennai for his untiring efforts, insight and perspective that has been of invaluable help. His patience, technical expertise, industrious and yet unpretentious nature has always been revered. He paved the royal road for perfect understanding and his pleasant supportive demeanor, simplicity, innovative approaches and impetus throughout the duration of my course has encouraged me in many ways.expert advice and unique style have been helpful in improvising my work and also aided to develop the necessary skills, not only in the profession but also as an individual too. I am proud to have an eminent professor like him during my post graduation days and express my sincere thanks to him.
I express my deepest gratitude to my teacher and guide Dr.M.K.Anand MDS, Reader, Department of Orthodontics and Dentofacial Orthopaedics, Ragas Dental College & Hospital, Chennai for sharing his unparalleled academic & clinical knowledge and constant encouragement and expert advice and motivation who made me work to get the thesis to its best form. I am very grateful to sir for being helpful and instrumental in correcting my work in every part of my thesis and for his whole hearted co-operation instead of his busy schedule for making this thesis a grand success. This thesis is a virtual reality of sir’s dogma and foresight in three dimensional field.
I also wish to convey my heartfelt thanks to Professor, Dr.B.Vikraman,MDS Professor, Department of Oral & Maxillofacial Surgery, Ragas Dental College, Chennai. I express my personal thanks to sir for being so tolerant, encouraging and understanding. I shall remain forever indebted to him for his valuable guidance and input throughout the digital analysis, a portion of my dissertation without which I would have never accomplished this particular research. He has been instrumental in introducing the MIMICS software to our college, using which a lot of 3D virtual work is being done in the field of MRI and CT data simulation.
It is a pleasure to record my gratitude to Dr. Shahul Hameed(Associate professor) , Dr.
Jayakumar(Reader), Dr. Shakeel Ahmed(Reader), Dr. Rekha(Sr Lecturer) , Dr. Rajan(Sr Lecturer),
Dr.Shobana(Sr Lecturer) and Dr. Biju(Sr Lecturer) for their whole hearted co‐operation, valuable
suggestions and for being very amicable and helpful throughout my postgraduate course.
I would like to express my gratitude to Dr. Saravanan, Radiologist, Saravana Advanced MRI and CT Scan, Chennai for undertaking all the work with zeal inspite of his busy schedule. I would like to thank Mr. Grace Rajan & Mr. Sathish, CT & MRI Technicians, for helping me in taking CT scans.
I would like to thank Mr. Bhoopathi for his help and efficiency in preparing the statistical analysis.
I would like to thank my senior colleagues Dr. Preethi, Dr. Biju, Dr. Sam, Dr. Karthik Mani, Dr. Prabhu, Dr. Rajkumar, Dr. Chinthan and Dr. Kaberi and my beloved batchmates Dr. Amey, Dr. Fayyaz, Dr.Goutham, Dr. Subu, Dr. Vashi, Dr. Kavitha and Dr. Ritika for being with me all throughout my course and for being a constant source of encouragement and support at every step. I will remember all that we shared together. I wish each one of them success and happiness as we move forward from here.
I also extend my gratitude to my junior colleagues Dr. Saravanan, Dr. Vinod, Dr. Ashwin, Dr. Sheel, Dr. Ayush, Dr. Sreesan, Dr. Mahalakshmi, Dr. Sabitha, Dr. Siva, Dr. Vijay, Dr. Arthi, Dr. Sakthi, Dr. Deepak, Dr. Ravanth, Dr. Manikandan and Dr. Ashwin.
At this moment I take the opportunity to thank our non teaching staff Mrs. Marina, Mr. Rajendran, Mr. Ashok, Mr. Kamaraj, Mr. Mani, Mr.Baskar, Sisters Lakshmi, Rathi, Kanaka, Haseena, Shalini, and Divya for their help and co-operation throughout my postgraduate course.
There are no words which can equalize the love, affection, dedication and sacrifice of my parents, my husband, my brothers and my daughter and my in-laws have done for me. Their love, understanding, support and blessings, sacrifices are the reasons for me to be what I am today. I would like to dedicate this work to my mother, father and my husband for their constant encouragement.
CONTENTS
TITLE
PAGE
NO.
1.
INTRODUCTION
1
2.
REVIEW
OF
LITERATURE
5
3.
MATERIALS
AND
METHODS
29
4.
RESULTS
35
5.
DISCUSSION
38
6.
SUMMARY & CONCLUSION
49
7.
BIBLIOGRAPHY 52
INTRODUCTION
Since the beginning of modern orthodontics more than 100 years ago, plaster casts have
been used to reproduce the patient’s dentition for diagnostic, therapeutic and research purposes.
These study models have served as a key record of tooth size, dental morphology, arch form,
local soft tissue anatomy and the relationship of the jaws.
These gypsum based study models are heavy, bulky and are labor-intensive to produce.
The fragility of study models is a constant cause for concern; it can also be difficult and time
consuming to measure in plaster model2. In addition, study model storage and retrieval is in
complete contradiction to the benefits afforded by digital photographic and radiographic image
storage and retrieval.
In an age of increased demand on the orthodontist for interdisciplinary care, second
opinions and transfer of records for continuing of care, the limitations of stone casts have
become increasingly apparent. Legislation relating to the retention of patient records after the
completion of treatment has lead to large demands on space for storage that has prompted the
development of alternative methods of recording occlusal relationships and electronic storage of
records.2 In late 1999 OrthoCAD (Cadent, Carlstadt, NJ) developed and released to market
Virtual Digital Dental casts. Then in early 2001, emodels (Geo Digm, Chanhassen, Minn) came
to market. Since then, hardware and software refinement has lowered costs and thus increased
the utilization of virtual models9.
Three dimensional digital study models was developed not to replace stone casts, but in
an attempt to remove the limitations imposed by the traditional casts34. Substitution of plaster
like digital models are easily accessible on the computer and can be retrieved instantly, provides
economical storage, eliminates the problems associated with model breakage, enables accurate,
simple diagnostic set ups, treatment simulation and it can be send anywhere in the world through
internet9 which facilitates ease of communication with patients and colleagues. Magnetic and
optical storage of digital model is particularly efficient and cost effective when compared to
traditional study models34.
The development of Computer Aided Designing and Computer Aided Manufacturing
(CAD/CAM) system using various three dimensional (3D) measuring systems in the
manufacturing industry has been followed by the use of a CAD/CAM system in dentistry using
laser scanning technique. Previous studies showed that the dimensional accuracy of laser surface
scanned digital models is within about 0.05mm45. Rapid prototyping technologies allow the
production of physical models from 3D digital data. An accuracy of Stereolithography (STL)
models based on computed tomography (CT) data of + 0.5mm can be reached22.
Three dimensional imaging of dental tissues will have a major impact in dentistry if the images
are accurate11. Interactive three dimensional images of the soft and hard tissues of dental patients
(virtual dental patients) will provide quantitative evidence to aid dentists in diagnosis, treatment
planning and outcome assessment. If these images are not accurate, the prime purpose will be
compromised. However clinical accuracy requirements vary for different chair side and
laboratory dental procedures. Possibly, the most stringent accuracy requirements are for inter
occlusal contacts, because most dental patients are sensitive to 0.020mm changes in their
occlusal anatomy11. Hence the objective of this study is to assess the accuracy of plaster model,
Aims and Objectives of the study:
1. To assess the reproducibility of a conventional method of using a hand held vernier
caliper to measure plaster study models.
2. To assess the efficiency and reproducibility of converting plaster study model into a 3D
digital study model (virtual model), using spiral computed tomography.
3. To assess the reproducibility of measurements made on 3D digital study models captured
using spiral CT scan using Materialize Interactive Medical Image Control System
(MIMICS) software.
4. To compare the accuracy of measurements made on the 3D digital study models and
plaster study models of the same dentition.
5. To evaluate the feasibility of fabricating accurate 3D physical models from the 3D data
by rapid prototyping (RP) process.
6. To compare the accuracy of 3D reconstructed models with plaster and digital study
model of the same dentition, and to assess reproducibility of measurements made on
reconstructed model using Vernier caliper.
Null Hypotheses:
1. There is no difference in dimensional accuracy of 3D digital study models captured with
spiral CT scan technique described and the plaster study models.
2. There is no difference in the dimensional accuracy of reconstructed model replicas
fabricated from the 3D digital models by RP, and plaster study models.
Review of Literature
REVIEW OF LITERATURE
J.S.Bill et al 22 1995 manufactured stereolithographic model of anatomical structures
from the computed tomography digital data using computer aided manufacturing (CAM)
technology. In this study CT data acquisition was performed using a SONATOM PLUS S with
section intervals of 1mm, section thickness in spiral mode of 2mm and 512 X 512 matrix for
sufficient resolution. Data transfer was provided by laser disc, image processing was performed
using a medical image processor and the advanced version of an image processing software (Kon
form, KOLN, Germany) to prepare STL. The models were fabricated by the SLA-250
stereolithographic unit by polymerization of liquid U-V sensitive resin using a UV laser beam.
The manufactured STL models had high precision and accuracy and aided in accurate treatment
planning.
Eufinger et al 13 1995 described Computer aided designing and manufacturing
(CAD/CAM)-techniques based on helical computed tomography (CT) data, which was
successfully used for the prefabrication of prostheses. An individual computer based
3-dimensional model of the bony defect is generated after acquisition, transfer and evaluation of
the CT data; from this freeform surface geometry, an individual and "idealized"
prosthesis-geometry was derived and fabricated by a numerically controlled milling machine using modern
industrial CAD/CAM-systems and design software. The margins of this prosthesis-geometry are
generated by the borders of the defect and the surface by considering the non-affected
neighboring contours.
Takayuki Kuroda et al 45 1996 used three dimensional dental cast analyzing system
are high speed measuring and processing, high accuracy besides the conventional linear and
angular measurements of dental cast, they are also able to demonstrate the size of the palatal
surface area and the volume of the oral cavity. Disadvantage of this system is the impossibility of
the sampling beneath the overhangs and also parallax angle between laser emitter and receiver
causes blind region around deep grooves with an overhang.
Schrimer, William A. Wiltshire et al 42 1997, compared manual and computer aided
space analysis. In this study they have measured manually mesiodistal width of all the teeth with
vernier caliper and scanned the models on a Photostat (Xerox machine). The scanned models
were digitized with dedicated computer aided software and made measurements. They concluded
that the computer aided measuring is reliable but, accurate mesio-distal measurement cannot be
made from photocopies of dental models. Manual measurements that use calibrated gauge
produce the more accurate, reliable and reproducible results. The mean arch length
measurements differed by 4.7 mm in maxilla and 3.1mm in the mandible. This difference
between manual and digitized analysis may be due to photocopying process. They regarded that
the measurement difference between alternative measurement methods of less than 0.20mm as
clinically acceptable.
Kevin H.Y. Mok and Michael S.Cooke et al 23 1998, did a comparative space analysis
study between sonic digitization (Digi Graph workstation) and the digital caliper. They
compared the reproducibility of the mesio-distal total tooth width and the arch perimeter values,
on plaster casts, given by the Digi graphTM work station and by digital calipers. They found
that there was an overestimation of the total tooth width by 1mm in mandible and 0.5 mm in
maxilla and an arch perimeter discrepancy of 1.6mm in the mandible and 0.4 mm in the maxilla
digital caliper and its clinical usefulness in evaluating the space problem of an individual
malocclusion should be interpreted with caution.
Marcel0 G.P. Cavalcanti et al 27 1999 stated that linear measurements done on the
3D CT with the CAD software is accurate. He evaluated the measurement accuracy of
three-dimensional (3D) volumetric images from spiral computed tomography (CT) in vitro. The
study sample consisted of nine cadaver heads that were submitted to an impact force by a
special device to promote blunt traumatic craniofacial fractures. The heads were
subsequently scanned by a spiral CT scanner. The visualization software was used to make
interactive linear measurements on the 3D images. Measurements were made on the images
twice by two observers, based on conventional craniofacial anatomic landmarks. The soft
tissues were subsequently removed, and the same measurements were repeated on the
cadaver heads with an electromagnetic digitizer. It is concluded that measurement of the
skull and facial bone landmarks by 3D reconstruction is quantitatively accurate for surgical
planning and treatment evaluation of craniofacial fractures.
Nobuyoshi Motohashi and Takayaki Kuroda et al 31 1999 applied 3D computer aided
designing system in diagnosis and treatment planning in orthodontics and orthognathic surgery.
This system comprises a measuring unit which obtains 3D information from the dental study
model using laser scanning and a personal computer to generate 3D graphics for computed
simulation of tooth movements, the representative planes defined by anatomical reference points
are formed for each individual tooth and outline of each individual tooth containing the
anatomical medial and distal contact points is cut down. Then orthodontic tooth movement is
necessary orthognathic surgery can be simulated by moving the mandibular dental arch three
dimensionally to establish the optimum occlusal relationship.
Sontoro M et al 40 2000 evaluated the mesio distal crown dimension and tooth size
discrepancy of the permanent dentition of the Dominican Americans. They have shown that the
measurement errors in the repeated single operator clinical measurements of plaster casts average
0.2mm.
Demetrios J. Hanzonetis et al 10 2001, analyzed the methods of acquisition of three
dimensional shapes from images. They have described and selected methods which include
stereo analysis, shapes from shadowing, photometric stereo, structured lighting. They state that
speed and accuracy are important when choosing appropriate method for acquiring 3D shape of
face and teeth. The laser scanning may cause damage to eyes, and it takes 2 hours and 4 minutes
to scan one upper model and accuracy is inadequate for scanning dental casts. The cost of
scanning a dental cast is about $23,000.
James J. Tomassetti, Louis J. Taloumis et al 20 2001, did a comparison of three
computerized Bolton tooth size analysis with a commonly used vernier caliper manual method.
The mean vernier caliper results were compared with the following computerized methods quick
ceph, Hamilton arch tooth system (HATS) and OrthoCAD. In this study to determine examiner
reliability, 3 sets of measurements made with vernier caliper were compared using absolute
differences. It revealed that 72.7% of the calculations were within 0.9mm of each other. The
mean difference was 0.77mm and the range was 0.0mm to 2.4 mm. The quick ceph overall
analysis differed from vernier caliper by a mean of 1.84mm. HATS differed from vernier caliper
author attributed that these deviations are due to less familiarity with the computerized system
than with the calipers and difficulty in pinpointing the exact mesial and distal points to be used
for the measurement.
Roanld Redmond et al 34 2001, enlightened the paradigm shift in orthodontic practice
management due to advances in computer and digital records. The author advocates 3D digital
model and its advantages using orthoCAD software include measurement analysis, midline
analysis, overbite and overjet analysis, occlusograms, magnification, anteroposterior and
transverse adjustments. The file size of the 3D study model is approximately 3 MB and we can
store upto 200 three dimensional study models in one compact disc. He also stated that we can
download the models from anywhere in the world within seconds. Orthodontic treatment and
interdisciplinary care will benefit from the improved flow and digital patient information.
Sean Curry, Sheldon Baumrind et al 41 2001, worked on developing practical system
for generating integrated three dimensional cranio facial maps by merging information from
x-ray cephalograms, study casts and facial photographs. He used radioopaque tie points on the
teeth and impressions were taken with poly vinyl siloxane material. Three dimensional digital
models were made using Align technology using VOPL/CRIL software the tie points from the
model, x-ray and facial photographs were merged together to form three dimensional model. The
resulting integrated 3D craniofacial model can be viewed interactively by using Align’s TREAT
software.
Budi Kusnoto and Carla Evans et al 4 in 2002 had done a study to check the reliability
of 3D surface laser scanner for orthodontic applications. In this study accuracy and
plaster facial model taken from alginate impression. All the scanned data were taken in to Sketch
Up soft ware (@Last Software, Boulder, Colo) in DXF format to be measured. In this study they
have found out that in all cases that the scanner produced more accurate measurements In height
(x) and width (y) but less accurate measurements in the depth (Z). For example while measuring
intermolar width, the scanner tended to produce smaller value than manual measurements, but
produced larger values when measuring palatal depth. The increased accuracy in measuring
height and width is due to the unit’s horizontal laser beam source. The depth was acquired while
the horizontal laser beams moves from top to bottom of the scanned object; time discrepancy
occurs between the emitting part of the laser beam to the photosensitive censor while scanning
the object’s depth; this causes a slight increase in the Z enlargement and the X and Y reduction
to get as close as possible to the original dimensions of the scanned object. Therefore they
introduced 1.0001 correction factor to reduce the effect of Z enlargement and the X and Y
reduction to get as close as possible to the original dimension of the scanned object. While
measuring they had a maximum error level 0f 2.4mm and minimum error was 0.1mm – the
accuracy is adequate for reconstructing 3D soft tissues. The self correcting mechanism provides
greater help in reducing distortion, regardless of object to scanner distance . The spread of the
Laser Beam over the object makes the scanner more accurate for smaller objects than for larger
objects. Many applications are possible in studying facial soft tissue growth, functional facial
muscle movements, dental casts, and arch form changes and head shape.
Choi J.Y.and Kim et al 6 in 2002 analyzed about various errors in medical rapid
prototyping of models. They explained that potential errors can occur during CT scan, 3D
modeler reconstruction in software, and in RP machine. Errors occurring in CT machine are
algorithm, Patient movement, and Metal artifact. Errors in 3D modeler are Threshold value,
Decimination Ratio, Interpolation algorithm, Smoothing algorithm, Tesselations, Triangular
edge. Errors during rapid prototyping are residual polymerization and transformation, Creation
and removal of supporting structure, Laser diameter, Laser path, Thickness of Layer, Surface
finishing.
Margherita Santoro et al 28 2003 compared the measurement made on digital and
plaster models. Two sets of alginate impressions were taken from patient’s mouth, one is asked
to make plaster models, and the other impression is scanned to make digital model using
OrthoCAD software. There was a statistical significant difference between tooth width and
overbite measurement made by the two methods, with all digital model measurements smaller
than the corresponding plaster model measurements. But the magnitude of difference does not
appear clinically relevant. They concluded that digital models seem to be clinically acceptable
alternative to stone cast for the routine measurement used in orthodontic practice. They attributed
that the difference may be due to error in operative measurement or incorrective probe
angulation.
L. Vrielinck et al 47 2003 This article presents and validates a planning system for
implant insertion based on preoperative CT imaging transferred to Surgicase® software
(Materialise,Leveun,Belgium). It allows the surgeon to determine the desired position of
different kinds of implants. Finally a customized drill guide is produced by stereolithography. In
this study, zygoma, pterygoid and regular platform implants were used. The treatment protocol is
validated through 12 case studies, selected at random from the total patient group (n=29 patients). From postoperative images, the exact implant location is determined and the deviation
varying according to the type of implant and the location of the implants, were observed. From a
clinical standpoint, most of the inserted implants were judged to be adequately sited. A
prospective clinical follow-up study was performed on all 29 patients. Although all patients
presented with severe maxillary atrophy, excellent cumulative survival rates 92% for the zygoma
implants and 93% for regular platform implants have been obtained.
R.Delong, M.Heinzen et al 11 2003 evaluated the accuracy of a system for creating 3D
computer models of dental arches. They made 10 stone casts using Vinyl polysiloxane
impression material and improved dental stone. The impressions and stone casts were scanned
using Comet-100 optical laser scanner from 20 different views and total time to scan was 20
minutes. Accuracy and precision for the cast and impression was evaluated. They have found
that the impression models were nearly twice accurate as the stone models. In this study they
concluded that 3D models provided permanent, quantitative record that with accuracy equivalent
to the measured occlusal sensitivity of the patients. (Accuracy of cast computer model was 0.024
+ 0.002mm and that of impression computer model was 0.013 + 0.003mm. The difference in
value was attributed to a setting expansion of dental stone.
M. Y. Hajeer et al 17 2004 claimed that the storage of dental casts need a larger space in
a hospital, but if the casts are stored in a digital format, after laser scanning or CT, they can be
converted into digital format and stored in a CD which requires a smaller space and
communication between professionals can be easier.
Federico Cesarani et al 15 2004 had taken CT’s for Egygptian mummies without
removing their bandages, and skull and soft tissue reconstruction were done for them. This
E Nkenke et al 30 2004 Fused CT derived virtual skeletal models and optical 3D
images of teeth to eliminate scattering due to metal restorations in process of obtaining CT
images. This technique gives better detail about the contour of teeth and occlusion and this
technique can be used in virtual orthognathic surgery planning.
Meredith L. Quimby et al 29 in 2004 measured the accuracy and reliability of
measurements made on computer-based digital models (Ortho-Cad). In this study a plastic model
occlusion i.e., Dentoform, served as a gold standard to evaluate the systematic errors associated
with producing either plaster or computer-based models. Accuracy, reproducibility, efficacy, and
effectiveness were tested by comparing the measurements of the computer-based models with
the measurements of the plaster models—(1) Accuracy: one examiner measuring 10 models
made from a Dentoform, twice; (2) Reproducibility and efficacy: two examiners measuring 50
models made from patients, twice; and (3) Effectiveness: 10 examiners measuring 10 models
made from patients, twice. Reproducibility (reliability) was tested by using the intraclass
correlation coefficient. Repeated measures of analysis of variance for multiple repeated
measurements and Student’s t test were used to test for validity. Only measurements of maxillary
and mandibular space available made on computer-based models differed from the
measurements made on the Dentoform gold standard. There was significantly greater variance
for measurements made from computer-based models. Reproducibility was high for
measurements made on both computer-based and plaster models. In conclusion, measurements
made from computer-based models appear to be generally as accurate and reliable as
measurements made from plaster models. Efficacy and effectiveness were similar to those of
plaster models. Therefore, computer-based models appear to be a clinically acceptable
Hauthuille et al 18 2005 Compared between computer assisted surgery and surgical
planning with rapid prototyping model using MIMICS has been done for distraction osteogenisis
and the article claims that the group who were planned with RP model had a better outcome.
Ronald Redmond et al 38 2006 discussed about internet based treatment planning and
communications. He said that one of the basic things we do is to make digital records of patient
examination findings, photographs of patients face and dentition, perhaps supplementing these
with digital radiographs and models. Dolphin imaging is used to show the patient’s and parents
the orthodontic problem and the potential treatment solution and even we can give a print out of
our initial findings and recommendations for them to take home. Internet communication
enterprises (ICE) dental system software allows us to perform all computer based treatment
planning and store in ICE server and we can even take copies of our data on DVD. It also
provides animation of the proposed treatment; the patient can sign informed consent on screen
using digital signature tables. The voice recording capability of the system can be used to record
critical conversation with patients and parents.
Daron R.Stevenset al9 in 2006 studied validity, reliablility and reproducibility of plaster
versus digital study models by comparing peer assessment rating and Bolton analysis and their
constituent measurements. In this study they have compared standard plaster models with digital
counterparts made with e-model software for tooth sizes and occlusal relationships.
Measurements were made with digital caliper to nearest 0.01mm from plaster models and with
e-software from the digital models. They have concluded that although statistically difference in
some measurements were found for the reliability and validity of the digital models via the
average of means of absolute differences of repeated measurements none was clinically
Ronald Redmond et al 37 2006 discussed about the evolution of digital study models. He
states that plaster casts served a limited purpose unless they were related to the face. He states
that studies comparing digital models with plaster casts have shown that there was no difference
in diagnostic accuracy and have concluded that digital models do not compromise orthodontic
diagnosis or treatment planning. Cone beam computed tomography (CBCT) has recently enabled
3D visualization of the entire craniofacial complex and virtual study models can be produced
from CBCT data. Studies have found no significant differences in orthodontic model analysis
between plaster study models and 3D images of the dentition taken from CBCT. Rapid
prototyping technologies allow the production of physical models from 3D data. The AAO
bulletin reported that courts and juries also have been strongly supportive of digital records for
reasons including the ability to back up, search, transport, store and standardize the records.
Pham et al 33 2007 presented case reports which used recent advances in
computer-modeling software that allows reconstruction of facial symmetry in a virtual environment. He
evaluated the use of preoperative computer modeling and intraoperative navigation to guide
reconstruction of the maxillofacial skeleton. Three patients with traumatic maxillofacial
deformities received preoperative, thin-cut axial CT scans. Three-dimensional reconstructions,
virtual osteotomies, and bony reductions were performed using MIMICS planning software
(Materialise, Ann Arbor, MI). The original and "repaired" virtual datasets were then imported
into an intraoperative navigation system and used to guide the surgical repair. Postoperative CT
scans and photographs reveal excellent correction of enophthalmos to within 1 mm in patient 1,
significant improvement in symmetry of the nasoethmoid complex in patient 2, and
Computer modeling and intraoperative navigation is a relatively new tool that can assist surgeons
with reconstruction of the maxillofacial skeleton.
Andrew P. Keating et al 2 2008, evaluated the accuracy and reproducibility of three
dimensional optic laser scanning device to record the surface detail of plaster study models.
Linear measurements were made using hand held digital caliper on thirty randomly selected
plaster study models in x,y and z planes. These values were compared with those measured on
digital models of the same plaster casts. The mean difference in all planes was 0.14mm and was
not statistically different. Subsequently they generated stereolithographic model from digital
surface model and the same measurements were made. All z plane reconstructed models were
significantly smaller than the corresponding plaster and 3D digital surface model measurements.
It was attributed to loss of surface detail particularly of the cervical margin, errors in the data
conversion and data manipulation while converting digital surface models to stereolithography
file format and errors in RP technique due to model shrinkage during building and post curing.
They also have concluded the use of using hand held vernier caliper to measure plaster study
models was reliable and reproducible.
Khemachit Sena et al 24 2008 had used MIMICS Meterialise to evaluate the average
measurements of Thai skulls. This was done to produce standardized skull implants for Thai
patients. This prevents CT procedure for all the patients as the implants are prefabricated.
Akther Hussain et al 1 2008, described an alternative imaging of plaster casts with flat
bed scanner instead of conventional photography. The perceived advantages of this method are
several sets of models can be scanned simultaneously to obtain right and left lateral, frontal and
alternative imaging method eliminates the need for expensive digital cameras, macro lenses,
lighting systems and table top setups.
Noortje I. Regensburg et al 32 2008 evaluated MIMICS (Materialise) as a valuable
tool for the calculations of orbital soft tissue volume. Because it can be used on any stack of
images, comparisons of CT scans and MRI scans were possible. Intraobserver variability was
less than 5% for the calculations of Fat Volume, Muscle Volume, and Bony Orbital Volume.
Interobserver variability did improve with better knowledge of anatomy and strict adherence to
the segmentation protocol.
Stephan Jacobs et al 44 2008 described the use of 3D reconstruction in Cardiac
surgery. Based on computer tomography (CT) and magnetic resonance imaging (MRI) images,
regions of interest were segmented using the MIMICS 9.0 software. The segmented regions were
the target volume and structures at risk. After generating an STL-file out of the patient’s data set,
a 3D plaster model was created. The patient’s individual 3D printed RPT-models were used to
plan the resection of a left ventricular aneurysm and right ventricular tumor. The surgeon was
able to identify risk structures, assess the ideal resection lines and determine the residual shape
after a reconstructive procedure (LV remodeling, infiltrating tumor resection). Using a 3D-print
of the LV-aneurysm, reshaping of the left ventricle ensuring sufficient LV volume was easily
accomplished. The use of the 3D rapid prototyping model (RPT-model) during resection of
ventricular aneurysm and malignant cardiac tumors may facilitate the surgical procedure due to
better planning and improved orientation.
Ronald Redmond et al 39 2009, discussed about securing digital data against computer
computer and are also used illegally to obtain passwords and encryption keys and they can also
change computer settings, resulting in reduced connection speeds, unwanted pop up
advertisements and loss of access to the internet and other program. He stresses that in an
institution such as dental school, malware can spread rapidly, even to non network computers
through the use of flash drives to transfer data. No security software suite can provide total
immunity to malware, even if the data base of virus definition is kept up to date. He advises to
take up back up of important files regularly.
Timon Mallepree et al 46 in 2009 explained about the technology on which the CT
machine, RP(Rapid Prototyping) machine works and about various parameters affecting the
accuracy in Digital and reconstructed models. Slice thickness and slice increment are the two
important parameters that have to be considered during CT scanning for a proper reconstruction
of 3D model in RP. If the space between two slices is too large, information about the real
geometry is lost and it results in a poor edge resolution of structures. So the reconstructed model
will have a staircase effect due to poor resolution, blurred edges due to partial volume effect and
surfaces not well shaped due to noise of an image. Slice thickness is kept at 0.5mm so that there
will not be any stair case effect. When these values are kept in optimal values, the accuracy of
the RP models is more.
Li WZ et al 26 2009 provided information about the use of MIMICS a CAD based
medical software in surgical treatment of trauma patient. For a Zygomatico-facial collapse
deformity resulting from a zygomatico-orbito-maxillary complex (ZOMC) fracture, CT scan data
were processed for three-dimensional (3D) reconstruction. The reduction design was aided by
3D virtual imaging and the 3D skull model was reproduced using the RP technique. In line with
from the presurgery. Postoperative CT images revealed significantly modified zygomatic
collapse and zygomatic arch rise and well-modified facial symmetry. The CAD/CAM and RP
technique is a relatively useful tool that can assist surgeons with reconstruction of the
maxillofacial skeleton, especially in repairs of ZOMC fracture.
Eldho Markose et al 14 2009 had conducted experiments on three different materials,
acrylic block, dry mandible and goat’s head with soft tissue. CT was taken for all the three
materials and measurements were done, he checked for accuracy and reproducibility of the
measurements in 3D CT, and found that the measurements were accurate and reproducible.
Yoon-Ah Kook et al 49 in 2009 compared the amounts of anatomical overjet measured
from facial axis (FA) points with the amounts of bracket overjet measured from bracket slot
centre (BSC) points. In this study they have scanned 27 patients with normal occlusion whose
models were fabricated in a three dimensional scanner and 3XTer program(Orapix Co Ltd, Seoul
Korea) 3D Virtual brackets (0.022” slot, MBT set up, 3M Unitek, Monrvia, Calif) constructed
with a 3D –CAD program were placed on FA point with the 3XTer program. The arch
dimensions and the amount of overjet from FA and Bsc points were measured. No significant
difference in arch width depth was observed between FA and Bsc points. Although the amounts
of overjet measured from FA points showed homogenous distribution, a tendency to decrease
from anterior segment (2.3mm) to the posterior one (2.0) was noted. However, the amounts of
overjet measured from Bsc points were variable, especially in the premolars and molar areas.
Significant discrepancies in the amounts of overjet in most of the areas between FA and Bsc
points (more than p<.05), except the lower second premolar and second molar area were reported
even though insets and offsets are part of prescription for the base of straight wire appliance
3mm through the whole segments and that distribution of the amount of overjet from Bsc points
was the same as that from FA points were rejected.
Dr.Vishal Dang et al 48 2009, discussed about the fundamentals of cone beam
computerized tomography and stated that CBCT produces high resolution 3D volumetric
imaging at high speed scanning with low radiation dose. But he stated that the quality of the
image is superior in computed tomography than in CBCT. He also stated that CBCT has poor
soft tissue visualization. He stated that routine CBCT study in orthodontics delivering an
effective dose of 61.1 µSv compared with 429.7 µSv for multisection computed tomography.
Lateral cephalograms deliver 10.4 µSv in comparison, thought without the benefit of 3D
structural visualization.
Dong Soon Choi et al 11 in 2010 evaluated the accuracy of superimposition of 3D digital
models using the palatal surface as a reference for measuring tooth movements. In this study they
have used Orapix 3D laser scanner accuracy of + 20 micro meter for scanning the models and 3D
reverse modeling software program-Rapidform to measure the models. They have used first,
second and third palatal rugae for superimposition. Van der Linden evaluated the changes in
rugae and inter rugal dimensions in 65 normally growing children and in 6 orthodontically
treated patients. The authors noted little or no change in the length of individual rugae and inter
rugae distances. Results in the study suggest that superimposition of 3D digital models using
surface to surface matching technology in the palatal area can result in accurate and reliable
measurements for assessment of orthodontic tooth movements. The present study investigated
the accuracy of the best fit method when identical palatal surfaces were scanned twice and
superimposed. Whether similar accuracy can be achieved when repeated impressions made in
Sridevi Padmanabhan et al 43 2010 concluded that CT measurements did not show a
significant difference from the direct skull measurements (P , 0.05) in all three planes except for
two midsagittal measurements in the anteroposterior plane. Cephalometric measurements were
comparable to direct skull measurements for midsagittal measurements in the anteroposterior
plane, but showed a significant difference when bilateral measurements were considered.
Cephalometric measurements also showed a significant difference in the transverse plane from
direct measurements and CT measurements; however, they did not display a significant
difference between direct skull measurements and CT measurements for most parameters in the
vertical plane. Linear measurements on the spiral CT were comparable to anatomical
measurements and were more reliable than cephalometric measurements. Cephalometric
measurements were acceptable for midsagittal measurements in the anteroposterior plane, but
showed a significant variation from anatomical and CT measurements in most other parameters.
Chung How Kau, Jay Little Field, Neal Rainy et al 7 in 2010 evaluated the use of
CBCT Digital models by comparing it with traditional OrthoCAD generated models. In this
study the imaging device they have used was Sirona Galileos (Bensheim, Germany). The
Galileos X-Ray detector receives cone shaped cone-beam radiation beams, which results in 200
individual exposures from a 14 second cycle in a 200 segment. Volume dimensions of
15X15X15 cm cube capture an image at high level of detail. The technology also allows for
small region close up views at double the detail without an additional scan. The large dental
volume ranges from bridge of the nose to the tip of the chin and the mandibular joints. It protects
the bone structures with the same reliability as the soft tissue. The voxel size is between 0.15mm
and 0.30mm. The image reconstruction time was approximately 4.5minutes. CBCT images were
files were converted to volume rendering software, and a final 3D-generated model of teeth was
produced and analysis made on proprietary software package. Alginate impression were taken
and sent to OrthoCAD for digital conversion. The scans were then taken electronically returned
in Digital format for analysis. Littles irregularity index was used to measure distances between
teeth. Measurements were made by measuring the linear displacement of the anatomical contact
points between the anterior six teeth on the maxilla and mandible in the horizontal occlusal
plane. The results from this study showed that digital models generated from CBCT imaging not
only offer diagnostic information but also other information such as bone levels, root resorption
and TMJ status are also captured. They are not present on OrthoCAD models. Orthodontists can
also eliminate the use of dental impression for diagnostic casts. The idea of gathering all
diagnostic records from a single CBCT scan is most intriguing to the orthodontic profession. As
computer technology improves, the occlusal distortion in the CBCT models should also improve
with constantly improving CBCT technology, the ability to gather all diagnostic records from a
single CBCT scan seems imminent. Future research needs to be conducted for surface shape and
volumes of CBCT images. They have concluded CBCT digital models are as accurate as
OrthoCAD digital models in making linear measurements for overjet, overbite and crowding
measurements.
Bootvong, Z.Liu et al 3 in 2010 studied virtual model analysis as an alternative approach
to plaster model analysis. He compared virtual dental models obtained from OrthoCAD and
corresponding plaster models of 80 patients in permanent dentition were randomly selected from
patients seeking orthodontic care. Inter examiner error was assessed by measuring tooth width,
overjet, overbite, intermolar width, intercanine width and mid line discrepancy. Both intra and
measuring the above mentioned parameters. There were substantial agreements for canine and
molar relationship classifications. The results suggest that analysis performed on virtual models
was a valid as traditional plaster models for intra and inter arch relationship.
Daniel S .German and Julia German8 in 2010 had overviewed about the uses of CBCT
in orthodontics. CBCT has an advantage over normal CT as its radiation exposure is only 20% of
that from CT. The required data is acquired in one minute, technician positions the patient in the
same way as for panoramic or cephalogram imaging. More than 30 different machines are
available. Using CBCT obtained images a third party software such as Anatomage allows digital
reconstruction of dental casts, trimmed according to ABO (American Board of Orthodontics)
standards. An additional benefit of these views is the ability to evaluate the roots and some of the
alveolar structure. The occlusion in the digital models is identical to that displayed in the saggital
TMJ view and the cephalometric images.
MATERIALS AND METHODS
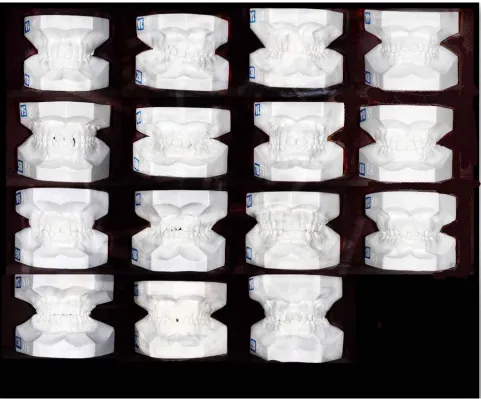
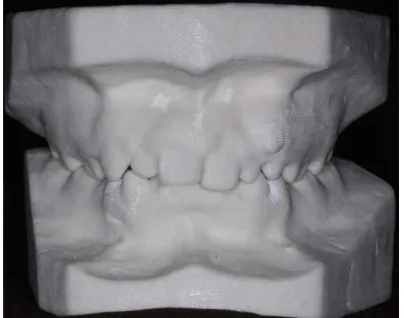
Fifteen pairs of randomly selected plaster study models from the orthodontic department
of Ragas Dental College, Chennai, were used in the study. Each plaster study model was made of
OrthoKal® (Registered trade mark of Kalabhai, orthodontic stone class III), with proportional
bases, made from same base former (Leone®) (Fig.1).
INCLUSION CRITERIA:
The inclusion criteria were:
I. The plaster study models should completely reproduce the arch.
II. All the teeth should be in permanent dentition.
III. Mesial cusp of the upper and lower second molar should be erupted.
IV. No missing teeth or no existing orthodontic appliance.
V. The models can have varying degrees of contact points and bucco-lingual
displacements.
VI. The models should not show any surface marks, loss of tooth material, voids or
fractures.
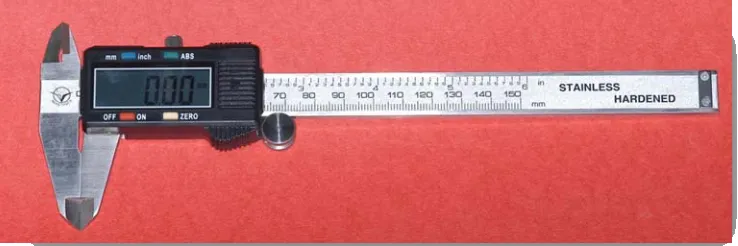
MANUAL MEASUREMENTS
Hand held Digital Vernier Caliper (Aero Space) (Fig 5) was used in the study to
manually measure the plaster models by two examiners on two different occasions. This caliper
manually. All plaster models were measured in a bright room without magnification. The plaster
models were not prepared in anyway prior to measuring and anatomical landmarks used in the
measurement were not pre marked. Two examiners independently conducted all the
measurements after an initial training period. Twenty linear dimensions were measured on each
model in each of three planes (X, Y, Z) with all measurements recorded to the nearest of
0.01mm. (Fig 4)
The following dimensions were selected for measurement:
X PLANE:
1. Intercanine distance - measured at the distance between:
(i) The occlusal tips of upper canines;
(ii) The occlusal tips of lower canines.
2. Interpremolar distances - measured as the distance between:
(i) The buccal cusp tips of the upper and lower first and second premolars;
(ii) The palatal cusp tips of the upper first and second premolars;
(iii) The lingual cusp tips of the lower first premolars;
(iv) The mesiolingual cusp tips of the lower second premolars.
3. Intermolar distances- measured as the distance between:
(i) The mesiopalatal cusp tips of upper first and second molars;
(ii) The mesiobuccal cusp tips of upper and lower first and second molars;
(iii) The mesiolingual cusp tips of lower first and second molars;
Y PLANE:
1. On both sides of the upper arch the distance from the mesiopalatal cusp tip of the upper
second molar to:
(i) The mesiopalatal cusp tip of the upper first molar;
(ii) The palatal cusp tip of the upper first and second premolar;
(iii) The cusp tip of the upper canine;
(iv) The mesio-incisal corner of the upper lateral incisor were measured.
2. On both sides of the lower arch the distance from the mesiolingual cusp tip of the lower
second molar to:
(i) The mesiolingual cusp tip of lower first molar and second premolar;
(ii) The lingual cusp tip of lower first premolar;
(iii) The cusp tip of lower canine;
(iv) The mesio-incisal corner of the lower lateral incisor were measured.
Z PLANE:
The clinical crown height of all the teeth, in both upper and lower arches, from second
premolar to second premolar inclusive, measured as the distance between the cusp tip and the
maximum point of concavity of the gingival margin on the labial surface.
VIRTUAL MEASUREMENTS
A 3D computed tomography scanner (Siemens SOMATOM Sensation 64 Slice) was used
to record the 3D detail of each of the 15 pairs of study models in single scan with high resolution
lateral), H70h). The CT images were saved in standard Digital Imaging for Communication in
Medicine (DICOM) format in a compact disc (CD).
The CT data are imported in to Computer Aided Designing (CAD)-based medical
software, Materialize Interactive Medical Image Control System
(MIMICS-MATERIALISE-BELGIUM) for multiplanar reconstruction. All the measurements are done in software.
Protocols during CT scan:
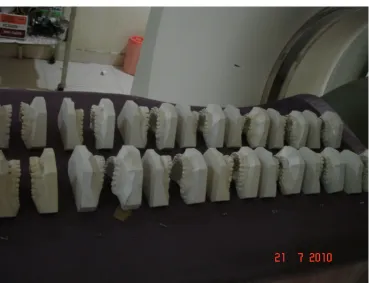
15 pairs of dental models were placed on the scanner bed (Fig 2) with a cardboard
underneath the models, as the scanner bed was not flat. The models were placed in upright
position. This position was selected because more number of models could be placed in single
exposure. Models were placed in columns with the arches facing each other (Fig 3). Adequate
space was maintained between the models such that the images would not overlap. To identify
the models, a lead alphabet was placed next to it. The images were taken in the sharpest
algorithm in the CT machine (sinus algorithm, slice thickness, 0.50mm: 120kv and 225 and
250mA (anterio-posterior-latero lateral, H70h). Each row data was stored in a separate CD in
DICOM format. Each CD was labeled according to model number.
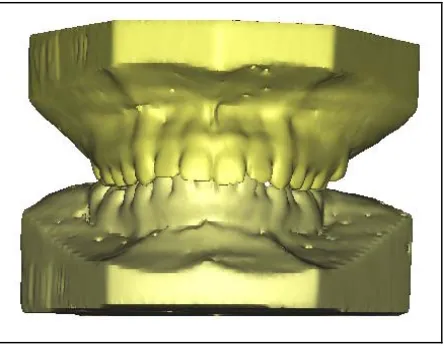
Protocols and Measuring Technique in MIMICS Software:
Computed tomography data were imported into MIMICS software. The software
reconstructed the data into three dimensional (3D) digital models. Each study model can be
given different colours for identification. The 3D reconstructed models can be rotated and also
and Y axis measurements were taken in occlusal view and Z axis measurement were taken in
frontal, right and left views. For measuring the distances between teeth, a built in tool (measure
3D distance tool) was selected and just by clicking and dragging on the selected points, the
measurement between the points was (Fig 10,11) obtained. While measuring the Z axis (clinical
crown height) of each tooth, the model can be given “transparency view” by clicking an in built
transparency tool, since the cervical margin of tooth was more clear in that view (Fig 12a,b) All
the measurements were noted down. The measurements were repeated by another operator at a
different time.
MEASUREMENTS OF RECONSTRUCTED MODELS:
One sample of 3D data was selected and Rapid prototyping model was prepared. For this
purpose the DICOM data in the computer was imported to MIMICS software in which the
DICOM data was converted into “Virtual Object”. This virtual object can be exported as STL
(Standard Triangulation Language) file. This file was sent to the Rapid prototyping (RP)
manufacturing unit. The rapid prototyping machine (3D printer Z corp.) converted the STL file
into Composite physical model (Composite powder and binder) (Fig 13). Measurements were
carried out on the Rapid prototyping model using vernier caliper and the values were compared
with that of the manual and digital measurements (Fig 14, 15). This was a pilot study done on
only one sample and further studies can be carried out using different prototype materials.
FLOW CHART OF STUDY
Comparision of
values of digital and
RP model with that
of manual.
15 Pairs of Polished OrthoKal dental study
models
CT scan imaging and stored in DICOM
format in CD
Manual measurements
using vernier caliper in
X,Y and Z axis.
DICOM Images Imported to MIMICS
software and reconstructed in to three
dimensional model.
Digital measurements in
MIMICS software in X,Y
and Z axis.
One sample 3D DICOM file was converted to
STL file and imported into Rapid
Prototyping(RP)machine(3D Printer, Z‐Corp,
USA)– to construct a rapid prototype model.
Manual measurements of
RP model using Vernier
Figures
Fig.
1
:
15
pairs
of
plaster
study
models
used
in
the
study
[image:39.612.66.547.113.512.2]
Fig.
2
:
Models
positioned
in
3D
CT
Scanner
[image:40.612.73.443.72.349.2] [image:40.612.122.491.384.667.2]
Fig.
4
:
Pictures
showing
measurements
taken
in
X,
Y
and
Z
axis
[image:41.612.124.510.137.610.2]
Manual
Measurements
of
Plaster
Study
Model
Fig.
5
:
Aerospace
Vernier
Caliper
[image:42.612.117.486.142.265.2] [image:42.612.122.480.369.630.2]
Fig.
7
:
Y
–
axis
measurement
from
mesiopalatal
cusp
tip
of
upper
second
molar
to
mesiopalatal
cusp
tip
of
upper
first
molar
Fig.
8
:
Z
–
axis
measurement
clinical
crown
height
of
upper
right
second
[image:43.612.123.491.70.317.2] [image:43.612.145.469.378.624.2]
Fig.
9
:
Digital
Models
reconstructed
using
MIMICS
software
[image:44.612.196.418.160.333.2]
Digital
Model
Measurements
Fig.10
:
X
–
axis
intercanine
Fig.
11
:
Y
–
axis
measurement
measurement
from
mesiopalatal
cusp
tip
of
upper
second
molar
to
mesiopalatal
cusp
tip
of
upper
first
molar
Fig.
12a
Z
–
axis
measurement
Fig.
12b
:Z
–
axis
measurement
clinical
crown
height
of
upper
clinical
crown
height
of
upper
right
second
premolar
right
second
premolar
[image:45.612.47.262.143.313.2]
Fig.
13
:
Composite
Prototype
models
[image:46.612.216.418.189.348.2]
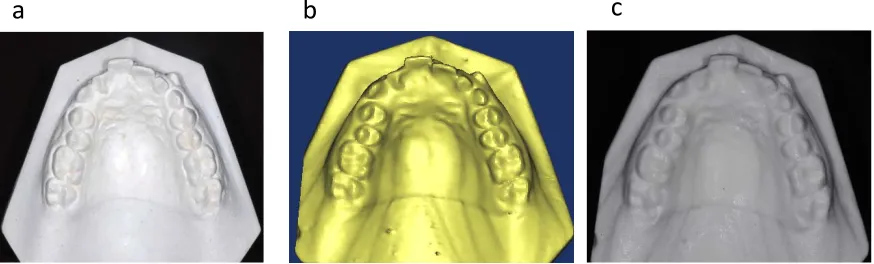
Fig.
14
:
Comparison
of
Plaster,
Digital
and
Reconstructed
upper
study
model
a
–
Plaster
Model
b
–
Digital
Model
c
–Reconstructed
Study
Model
[image:47.612.73.510.116.248.2]
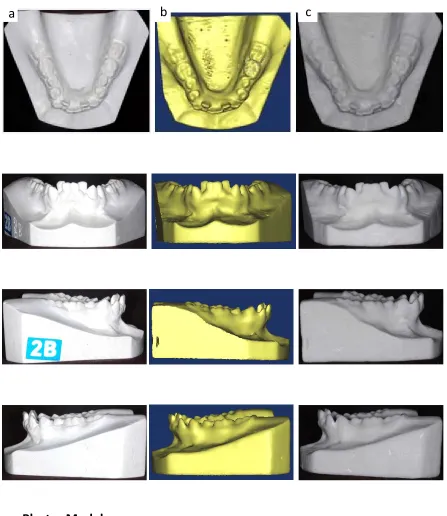
Fig.
15
:
Comparison
of
Plaster,
Digital
and
Reconstructed
lower
study
model
a
–
Plaster
Model
b
–
Digital
Model
c
–Reconstructed
Study
Model
[image:48.612.70.517.110.626.2]
Results
RESULTS
Data analysis in our study demonstrated a non-normal distribution of results; therefore
non parametric tests were employed in the statistical analysis. A Wilcoxon signed rank test was
undertaken to determine agreement between repeat model measurements and inter rater
reliability. The same above test was used to determine the significance of difference between the
plaster, digital and reconstructed models.
Manual measurements were made with vernier caliper on plaster dental casts and
reconstructed model in this study. To establish this method as a reliable and consistent way to
measure the linear variables in the X, Y and Z axis, the measurements were done by two
different operators at two different time points in all the 15 pairs of plaster study models and one
pair of reconstructed model. The linear measurements in the digital model were done by
measuring tools in the MIMICS software, by two different operators measured at two different
time points in all the 15 pairs of digital casts.
The data obtained with plaster model, digital model and reconstructed models were
stored in computer and presented as an excel page. A statistical package SPSS (SPSS 16.0
version, Chicago, ILLINOIS, USA) was used to analyse the comparison. The differences were
compared using Wilcoxon signed rank test. P value less than 0.05 was considered statistically
significant.
The mean absolute difference in repeat measurements of plaster models in X, Y, Z planes
were 0.19mm (p = 0.067) , 0.23mm (p = 0.083), 0.03mm (p = 0.128) respectively. The overall
statistically significant difference between the repeat measurements in plaster model. It is shown
in Table 1. and Graph 1.
The mean absolute difference in repeat measurements of digital models in X, Y, Z planes
were 0.19mm (p = 0.296), 0.15mm (p = 0.073), 0.07mm (p = 0.351) respectively. The overall
mean absolute difference is 0.14 mm. The P value was 0.124 which indicates that there was no
statistically significant difference between the repeat measurements in digital model. The values
are displayed in Table 2.and Graph 2.
The mean absolute difference in repeat measurements of reconstructed model in X, Y, Z
planes were 0.27mm (p = 0.211), 0.95mm (p = 0.062) , 0.31mm (p = 0.211) respectively. The
overall mean absolute difference was 0.51 mm. The P value was 0.189. These values established
that there was no statistically significant difference between the repeat measurements in
reconstructed model. It is depicted in Table 3. and Graph 3.
When plaster models and digital models were compared there was no statistically
significant difference in the X, Y and Z plane. The mean difference in the X, Y and Z plane were
0.17mm (P = 0.225), 0.16mm ( p = 0.083) and 0.08mm (p = 0.279) respectively. The
overall mean absolute difference was 0.14mm and p value was 0.114. The results showed that
there was no statistically significant difference between plaster and digital in all three
dimensions. It is given in table 4 and Graph 4.
The comparison between plaster and reconstructed model showed that statistically
significant difference was found between plaster and reconstructed model. The mean difference
in X, Y, and Z planes were 3.39mm (p = 0.044), 1.32mm (p < 0.001), 0.70mm (p = 0.007)
value is less than 0.001. It showed that statistically significant difference was found in all three
planes between plaster and reconstructed model. The values are shown in table 5 and Graph 5.
Finally, the difference between digital and reconstructed model showed that there was
significant difference were found in Y and Z planes. The mean difference in X plane was 3.47 (p
= 0.093) and in Y, Z planes were 1.32mm (p = 0.002) and 0.69mm (p = 0.037) respectively. The
overall absolute difference in X, Y, Z plane was 1.83mm. The P value was 0.011. These values
showed that the difference between digital and reconstructed model was statistically significant
in Y, Z planes and it was not statistically significant in X plane. The results are displayed in
Table 6 and Graph 6.
Table 1. Variation in repeat measurements of plaster model ‐ 20 measurements in each plane
repeated on 15 models
Plane N Mean Std. Dev P ‐ value
X ‐ Plane 20 0.185 0.200 0.067
Y ‐ Plane 20 0.227 0.162 0.083
Z ‐ Plane 20 0.025 0.027 0.128
X, Y, Z ‐ Planes 60 0.146 0.1716 0.099
Graph 1.
0.185 0.227 0.025 0.146 0 0.1 0.2 0.3 M ean Val u es
X (n=20) Y (n=20) Z (n=20) X, Y, Z (n=60) Planes
Variation in repeat measurements of plaster model
[image:54.612.97.437.454.689.2]Table 2. Variation in repeat measurements of digital model ‐ 20 measurements in each
plane repeated on 15 models
Plane N Mean Std. Dev P ‐ value
X ‐ Plane 20 0.188 0.379 0.296
Y ‐ Plane 20 0.148 0.124 0.073
Z ‐ Plane 20 0.068 0.052 0.351
X, Y, Z ‐ Planes 60 0.135 0.234 0.124
Graph 2.
0.188 0.148 0.068 0.135 0 0.1 0.2 0.3 M e a n V a lu es
X (n=20) Y (n=20) Z (n=20) X, Y, Z (n=60)
Planes
Variation in repeat measurements of virtual model
[image:55.612.97.440.451.684.2]
Table 3. Variation in repeat measurements of reconstructed model ‐ 20 measurements in each plane
repeated on one model
Plane N Mean Std. Dev P ‐ value
X ‐ Plane 20 0.273 0.168 0.211
Y ‐ Plane 20 0.950 1.620 0.062
Z – Plane 20 0.312 0.296 0.211
X, Y, Z ‐ Planes 60 0.512 0.990 0.189
Graph 3.
0.273 0.950 0.312 0.512 0.000 0.200 0.400 0.600 0.800 1.000 1.200 M e an Values
X (n=20) Y (n=20) Z (n=20) X, Y, Z (n=60)
Planes
Variation in repeat measurements of reconstructed model
[image:56.612.96.456.486.699.2]Table 4. Difference between plaster and digital model measurements means of 20 measurements in
each plane compared
Plane N Mean Std. Dev P ‐�