R E S E A R C H A R T I C L E
Open Access
Practice sensitive quality indicators in RAI-MDS
2.0 nursing home data
Carole A Estabrooks
1*, Jennifer A Knopp-Sihota
1,2and Peter G Norton
3Abstract
Background:In recent years, improving the quality of care for nursing home residents has generated a considerable amount of attention. In response, quality indicators (QIs), based on available evidence and expert consensus, have been identified within the Resident Assessment Instrument–Minimum Data Set 2.0 (RAI-MDS 2.0), and validated as proxy measures for quality of nursing home care. We sought to identify practice sensitive QIs; that is, those QIs believed to be the most sensitive to clinical practice.
Method:We enlisted two experts to review a list of 35 validated QIs and to select those that they believed to be the most sensitive to practice. We then asked separate groups of practicing physicians, nurses, and policy makers to (1) rank the items on the list for overall“practice sensitivity”and then, (2) to identify the domain to which the QI was most sensitive (nursing care, physician care, or policy maker).
Results:After combining results of all three groups, pressure ulcers were identified as the most practice sensitive QI followed by worsening pain, physical restraint use, the use of antipsychotic medications without a diagnosis of psychosis, and indwelling catheters. When stratified by informant group, although the top five QIs stayed the same, the ranking of the 13 QIs differed by group.
Conclusions:In addition to identifying a reduced and manageable set of QIs for regular reporting, we believe that focusing on these 13 practice sensitive QIs provides both the greatest potential for improving resident function and slowing the trajectory of decline that most residents experience.
Keywords:Nursing home, Performance measurement, RAI-MDS, Quality indicators
Background
Increasing numbers of older adults, primarily due to ad-vanced age and frailty, are in need of nursing home (NH) care. At the same time, concerns about the quality of care provided to this vulnerable population persist. As a means of measuring and evaluating NH care, a standardized data collection and monitoring system, the Resident Assessment Instrument –Minimum Data Set 2.0 (RAI-MDS 2.0) was developed by the Centre for Medicare and Medicaid in the US. This system is now used in several countries including Canada. It allows for a valid, reliable, and standardized as-sessment of resident outcomes measured at the person level over time [1]. The use of standardized data, such as the RAI-MDS 2.0, makes it possible to define, compare, monitor, and report quality indicators (QIs) for clinical
planning and decision making in NHs [2]. Although the RAI-MDS 3.0 is now used in the US, at present all jurisdic-tions in Canada use 2.0 with no immediate plans to change. In our ongoing program of research, Translating Research in Elder Care (TREC), we focus on improving the quality and safety of care delivered to residents of NHs. Protocols for this program have been published elsewhere [3,4]. Briefly, TREC closely follows a representative cohort of urban nursing homes in the Canadian Prairie Provinces, capturing RAI-MDS 2.0 data from those nursing homes from 2007 onward. As part of this research, the Safer Care for Older Persons [in residential] Environments (SCOPE) was developed with the goal of engaging frontline staff to become involved in the quality improvement process [5].
What is a quality indicator?
A QI is a computed measure based on a clinical outcome that is believed to be reflective of the quality of care. In * Correspondence:carole.estabrooks@ualberta.ca
1Faculty of Nursing, University of Alberta, Edmonton, Alberta T6G 1C9, Canada
Full list of author information is available at the end of the article
other words, QIs are used as proxy or surrogate measures for quality of care. Outcomes can be undesirable, such as falls or pressure ulcers, or they may be desirable such as physical independence or improved continence. QIs were central in the original conceptualization of the RAI-MDS 2.0 assessment system. Public reporting of QIs has been done for many years in the US and is beginning to be used in Ontario long-term care [6]. Public reporting is thought to be a driver of improved quality either through consumer empowerment, or by‘naming and shaming’ [7]. But more importantly, QIs give individual facilities or operators a stan-dardized and comparable measure by which to target and monitor quality improvement activities. When reported with transparency, poor performers can identify facilities with good performance, and seek to learn from them. Researchers can use QIs as a metric to shed light on the effects of owner-ship, funding, policy, care culture, and other factors.
Some QIs are strictly cross-sectional (e.g.,use of indwell-ing catheters), while others use consecutive assessments to identify individual-level improvement or decline. Central to QI construction is the issue of risk adjustment, which arises from understood risk factors associated with poor out-comes, and these risk factors being unevenly distributed among facilities. Risk-adjusted QIs are designed to allow comparison of facility results with those of other facilities and to overall populations of interest. They take into ac-count differences in the risk profiles of resident populations within individual facilities [2]. Methods for developing RAI-MDS 2.0 based QIs for use in NHs have been developed in the US [8] and have been applied in Canadian settings [9]. More recently 3rd generation risk adjustment techniques have been adopted [10,11].
Practice sensitive QIs
In Canada, there are 35 validated QIs identified in the RAI-MDS 2.0 system; however, not all of them are equally sensitive to changes in practice, be it nursing, medical, allied or combined interventions. As our intent in the TREC program of research is to work withmodifiable
outcomes, we aimed to develop a set of what we term
practice sensitive QIs. Similar to the SCOPE project [12], we intend to use the list of practice sensitive QIs and assess them for strength of evidence that would support developing or refining interventions in the NH population. This paper describes the process used to identify and develop this list of practice sensitive QIs.
Method
We began with the list of the 35 Canadian 3rdgeneration quality indicators for RAI-MDS 2.0 [10]. First we sought the opinions of two experts (Poss [13,14] and Hirdes [15,16]) familiar with the selection and construction of these indicators and they identified 10 as sensitive to nursing practice, two to physician practice, and one policy/
legislation intervention (see Table 1 for the RAI-MDS 2.0 codes). Second using a modified Delphi technique [17], we then recruited informants based on their repu-tation as experts within the NH sector. The informant groups included practicing physicians (n = 4), nurses (n = 8), and decision/policy-makers (n = 4) all of whom were familiar with the RAI-MDS 2.0. More specifically, the physician group included two geriatric specialists and two family physicians with a specific interest in geriatric medicine, the nursing group included six nationally recog-nized nurse scholars with active research portfolios in the NH area and two practicing geriatric clinical nurse spe-cialists, and the decision/policy makers were either NH Directors of Care or government level policy makers with a NH portfolio. We then submitted the 13-item list to informants (n = 16) via electronic mail asking them to anonymously and independently rank the items for (1) overall “practice sensitivity” and then, (2) to identify the domain to which the QI was most sensitive (nursing care, physician care, or policy maker).
Ethics
Ethics and operational approvals were obtained from Health Research Ethics Board of the University of Alberta and from the participating sites respectively.
Results
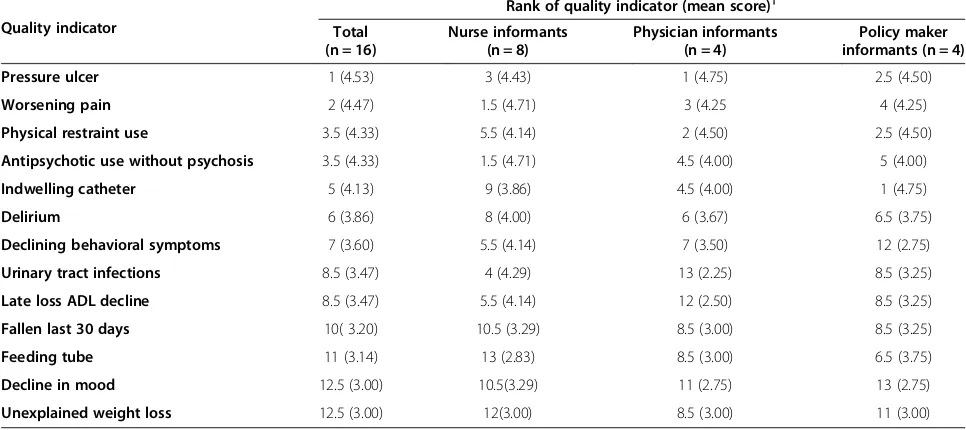
Results of the exercise are presented in Table 2. Overall, informants (n = 16) identified pressure ulcers as the most practice sensitive QI, followed by worsening pain, physical restraint use, the use of antipsychotic medications without a diagnosis of psychosis, and indwelling catheters. Add-itionally, the groups identified pressure ulcers, worsening pain, physical restraint use, declining behavioral symptoms, urinary tract infections, a decline in late loss activities of daily living (ADL) function (e.g., bed mobility, eating, toilet use), falls in the last 30 days, a decline in mood, and unexplained weight loss as most sensitive to nursing care. The use of antipsychotics–without a diagnosis of psych-osis, indwelling catheters, delirium, and feeding tubes were deemed most sensitive to physician care. Lastly, none of the 13 QIs were deemed to bemostsensitive to policy/ decision makers. Use of antipsychotics, without a diagno-sis of psychodiagno-sis, followed closely by physical restraint use, and feeding tubes were the QIs identified as being the most sensitive to all domains of care (nursing, physician, and policy makers). Decline in mood and unexplained weight loss were acknowledged as the QIs least sensitive by any of the examined groups.
physicians ranked pressure ulcers most sensitive, while policy makers saw indwelling catheters as themostpractice sensitive of the QIs.
Discussion
Improving the quality of care for NH residents has generated a considerable amount of attention in recent
[image:3.595.60.534.99.628.2]years. In response, QIs, based on available evidence and expert consensus, have been constructed and validated as reflections of both the process and outcome of care. In this paper, we described the process used for selecting and ranking the 13 practice sensitive QIs from an initial list of 35 indicators, all of which have been previously validated for use within the RAI-MDS 2.0. In addition, the QIs we
Table 1 RAI-MDS codes and definitions of practice sensitive quality indicators
Quality indicator RAI-MDS 2.0 assessment items Definition
Antipsychotic use without psychosis O4a–Number of days during last 7 days receiving antipsychotic medication
Percent of residents on antipsychotics without a diagnosis of psychosis
Decline in mood E1a–Negative statements Percent of residents who decline in mood from symptoms of depression
E1d–Persistent anger with self or others
E1f–Expressions of unrealistic fears
E1h–Repetitive health complaints
E1i–Repetitive anxious non-health complaints or concerns
E1l–Sad pained or worried facial expressions
E1m–Crying, tearfulness
Declining behavioral symptoms E4a–Wandering Percent of residents who have declining behaviour symptoms. Where 1 or more of the indicators are greater at the target assessment than the prior assessment E4b–Verbally abusive
E4c–Physically abusive
E4d–Socially inappropriate behaviour
Fallen last 30 days J4a–Resident has fallen in the last 30 days Percent of residents who have fallen in the last 30 days
Feeding tube K5b–Feeding tube Percent of residents with a feeding tube
Indwelling catheter H3d–Indwelling catheter Percent of residents with indwelling catheter
Late loss ADL decline G1a–Bed mobility Percent of residents with loss in 1 or more of the ADL late loss self-performance categories
G1b–Transfer
G1h–Eating
G1i–Toilet use
Physical restraint use P4c–Trunk restraint Percent of residents in physical restraints on a daily basis
P4d–Limb restraint
P4e–Chair prevents rising
Pressure ulcer M2a–Stage of pressure ulcer (0 for none) Percent of residents who have a stage 2 to 4 pressure ulcer
Symptoms of delirium B5a–Easily distracted Percent of residents with symptoms of delirium
B5b–Periods of altered perception or awareness of surroundings
B5c–Episodes of disorganized speech
B5d–Periods of restlessness
B5e–Periods of lethargy
B5f–Mental function varies over the course of the day
Unexplained weight loss K3a–Weight loss Percent of residents who have unexplained weight loss
Urinary tract infections I2j–Urinary tract infection Percent of residents with urinary tract infections
Quality indicator RAI-MDS 2.0 assessment items Definition
Worsening pain J2a–Frequency of pain Residents with greater pain at target assessment relative to prior assessment
J2b–Intensity of pain
have identified are congruent with those identified by the US Centre for Medicare and Medicaid Services [18] and the Health Quality Ontario [19]. These agencies utilize QIs primarily for public reporting purposes; therefore, the QIs identified have been judged to be both important
[image:4.595.62.540.106.321.2]and sufficiently valid (e.g. QIs included as parts of public reporting reflect the highest level of measurement quality). Table 4 provides a summary of the key indications of validity for the 13 QIs. While this work is based on RAI-MDS 2.0 data, we believe the process used to identify and
Table 2 Results of the modified Delphi exercise to identify themostpractice sensitive quality indicators*
Quality indicator Rank order of practicesensitive QIs†
Number of times quality indicator chosen asmostpractice sensitive to nursing care, physician care, or policy*
Nursing care n (%) Physician care n (%) Policy maker n (%) Total‡
Pressure ulcer 1 13 (81) 1 (1) 2 (13) 16
Worsening pain 2 11 (69) 4 (25) 1 (1) 16
Physical restraint use 3.5 10 (63)± 3 (19) 7 (44) 20
Antipsychotic use without psychosis 3.5 5 (31) 13 (81) 3 (19) 21
Indwelling catheter 5 4 (25) 10 (63) 1 (1) 15
Delirium 6 4 (25) 9 (56) 0 13
Declining behavioral symptoms 7 11 (69) 1 (1) 0 12
Urinary tract infections 8.5 10 (63) 2 (13) 2 (13) 14
Late loss ADL decline 8.5 12 (75) 0 0 12
Fallen last 30 days 10 8 (50) 2 (13) 2 (13) 12
Feeding tube 11 2 (13) 12 (75) 4 (25) 18
Decline in mood 12.5 6 (38) 2 (13) 1(1) 9
Unexplained weight loss 12.5 8 (50) 2 (13) 0 10
ADL, activities of daily living; QI, quality indicator.
*
Rater sample size = 16 (Physicians = 4; Nurses = 8, Decision/Policy makers = 4).
†Where ties occurred during ranking process, the rank values are represented in decimal place form.
‡Total counts of number of times QIs are seen asmostpractice sensitive can exceed the total sample size due to double rating.
±
[image:4.595.56.539.485.700.2]For example, physical restraint use was ranked most sensitive to nursing care by 10/16 raters, to physician care by 3/16 and policy makers by 7/16. The bold numbers identify the indicators that are either sensitive to Nursing Care, Physician care, or Policy makers.
Table 3 Ranking and mean scores ofmostpractice sensitive quality indicators as identified by informant group*
Quality indicator
Rank of quality indicator (mean score)†
Total (n = 16)
Nurse informants (n = 8)
Physician informants (n = 4)
Policy maker informants (n = 4)
Pressure ulcer 1 (4.53) 3 (4.43) 1 (4.75) 2.5 (4.50)
Worsening pain 2 (4.47) 1.5 (4.71) 3 (4.25 4 (4.25)
Physical restraint use 3.5 (4.33) 5.5 (4.14) 2 (4.50) 2.5 (4.50)
Antipsychotic use without psychosis 3.5 (4.33) 1.5 (4.71) 4.5 (4.00) 5 (4.00)
Indwelling catheter 5 (4.13) 9 (3.86) 4.5 (4.00) 1 (4.75)
Delirium 6 (3.86) 8 (4.00) 6 (3.67) 6.5 (3.75)
Declining behavioral symptoms 7 (3.60) 5.5 (4.14) 7 (3.50) 12 (2.75)
Urinary tract infections 8.5 (3.47) 4 (4.29) 13 (2.25) 8.5 (3.25)
Late loss ADL decline 8.5 (3.47) 5.5 (4.14) 12 (2.50) 8.5 (3.25)
Fallen last 30 days 10( 3.20) 10.5 (3.29) 8.5 (3.00) 8.5 (3.25)
Feeding tube 11 (3.14) 13 (2.83) 8.5 (3.00) 6.5 (3.75)
Decline in mood 12.5 (3.00) 10.5(3.29) 11 (2.75) 13 (2.75)
Unexplained weight loss 12.5 (3.00) 12(3.00) 8.5 (3.00) 11 (3.00)
ADL, activities of daily living.
*
To identify which of the quality indicators were consideredmostsensitive to practice, informants were provided the statement“This quality indicator is practice sensitive”. Responses ranged from 1 to 5 (1 = strongly disagree, 5 = strongly agree).
rank the practice sensitive QIs as well as the actual indica-tors that we have identified will also be of interest to those using RAI- MDS 3.0.
Conclusion
While we have the ability to generate all 35 indicators we believe that focusing on these 13 practice sensitive QIs, not only provides a reduced and more manageable list of QIs for reporting purposes but also have the greatest potential for functional improvement and the slowing of the trajectory of decline that most NH
residents experience. Using this information, combined with data related to the frequency of“events” and our ability to measure them sufficiently well enough to see change, we will generate a short list of 3–5 topical areas in which to focus future quality improvement interventions.
Abbreviations
[image:5.595.58.534.99.568.2]QI:Quality indicator; RAI-MDS: Resident Assessment Instrument Minimum Data Set; NH: Nursing home; TREC: Translating Research in Elder Care; SCOPE: Safer Care for Older Persons [in residential] Environments; ADL: Activities of daily living.
Table 4 Evidence of validity for practice sensitive quality indicators
Quality indicator Evidence of quality indicator validity
Antipsychotic use without psychosis CMS: percentage of long-stay residents who received an antipsychotic medication.
Decline in mood CMS: percentage of residents who have depressive symptoms.
A (non-supportive) paper [20], reported that they found notable under-reporting; although, they agreed this QI was useful for reporting because of the clinical importance of the domain.
Declining behavioral symptoms There is little yet reported to support the validity of this indicator, however it is clinically importance, and associated with resident safety.
Delirium There is little yet reported to support the validity of this indicator, however it is clinically importance, and associated with resident safety.
Fallen last 30 days HQO: percentage of residents who had a recent fall.
Some data [21] suggests RAI-MDS data on falls over longer intervals (e.g.falls in last 180 days) may be more accurate and also cautions that falls tend to be underreported in the MDS data compared to in the chart [22].
Feeding tube There is little yet reported to support the validity of this indicator, however it is clinically importance, and associated with resident safety.
Indwelling catheter CMS: residents who have/had a catheter inserted and left in their bladder.
Found to have the highest level of validity and highly recommended for use by CMS and nursing homes [22].
Late loss ADL decline CMS: percentage of long-stay residents whose need for help with daily activities has increased.
HQO: percentage of residents with increasing difficulty carrying out normal everyday tasks.
Physical restraint use HQO: percentage of residents who were physically restrained.
CMS: percent of residents who were physically restrained.
Pressure ulcer HQO: percentage of residents who had worsening pressure ulcer status.
CMS: pressure ulcer prevalence.
Unexplained weight loss CMS: percentage of long-stay residents who lose too much weight. One study [23] concluded that the RAI-MDS weight loss QI is able to discriminate differences in prevalence of weight loss between facilities, suggesting concurrent validity of the QI.
Urinary tract infections CMS: percentage of long-stay residents with a urinary tract infection.
Found to have the highest level of validity and highly recommended for use by CMS and nursing homes [22].
One study [24] comparing the RAI-MDS data for urinary tract infection (UTI), with data arising from active prospective surveillance in LTC facilities (n = 16) concluded that the RAI-MDS overestimated the number of cases. However, suggestions to use more explicit definition to reduce false positives have been instituted in 2008.
Worsening pain HQO: percentage of residents with pain that recently got worse.
The RAI-MDSpainQI*has been found to accurately differentiate the prevalence of pain between facilities however it has been suggested that high pain prevalence scores were associated with more frequent pain assessment and appropriate pain-related care practices, as opposed to poor care quality [25].
ADL, activities of daily living; CMS, US Centre for Medicare and Medicaid Services; HQO, Health Quality Ontario; QI, quality indicator.
*
Competing interests
The authors declare that they have no competing interest.
Authors’contributions
CAE and PGN participated in conceptualizing the TREC program and in securing the grant that provided its funding. CAE and PGN conceptualized the exercise and led the data collection process. JKS drafted the initial manuscript and all authors approved the final version.
Acknowledgements
The authors acknowledge the Translating Research in Elder Care (TREC) team for its contributions to this study. Funding was provided by the Canadian Institutes of Health Research (CIHR; MOP #53107).
Author details
1
Faculty of Nursing, University of Alberta, Edmonton, Alberta T6G 1C9, Canada. 2Faculty of Health Disciplines, Athabasca University, Edmonton, Alberta T5K 2J8,
Canada.3Department of Family Medicine, University of Calgary, Calgary, Alberta T2N 4N1, Canada.
Received: 1 August 2013 Accepted: 5 November 2013 Published: 13 November 2013
References
1. Poss JW, Jutan NM, Hirdes JP, Fries BE, Morris JN, Teare GF, Reidel K:A review of evidence on the reliability and validity of Minimum Data Set data. Healthc Manage Forum2008,21(1):33–39.
2. Canadian Institute for Health Information:Continuing care reporting system (CCRS) quality indicators risk adjustment methodology.Ottawa, ON: Canadian Institute for Health Information; 2013.
3. Estabrooks CA, Hutchinson AM, Squires JE, Birdsell J, Cummings GG, Degner L, Morgan D, Norton PG:Translating Research in Elder Care: an introduction to a study protocol series.Implement Sci2009,4:51. 4. Estabrooks CA, Squires JE, Cummings GG, Teare GF, Norton PG:Study
protocol for the Translating Research in Elder Care (TREC): building context - an organizational monitoring program in long-term care project (project one).Implement Sci2009,4:52.
5. Cranley LA, Norton PG, Cummings GG, Barnard D, Estabrooks CA:SCOPE: Safer Care for Older Persons (in residential) Environments: a study protocol.Implement Sci2011,6:71.
6. Hutchinson AM, Draper K, Sales AE:Public reporting of nursing home quality of care: lessons from the United States experience for Canadian policy discussion.Healthc Policy2009,5(2):87–105.
7. Totten A, Wagner J, Tiwari A, O’Haire C, Griffin J, Walker M:Public reporting as a quality improvement strategy.Rockville, MD: Agency for Healthcare Research and Quality; 2012.
8. Berg K, Mor V, Morris J, Murphy KM, Moore T, Harris Y:Identification and evaluation of existing nursing homes quality indicators.Health Care Financ Rev2002,23(4):19–36.
9. Wodchis WP, Teare GF, Anderson GM:Cost and quality: evidence from Ontario long term care hospitals.Med Care2007,45(10):981–988. 10. Jones RN, Hirdes JP, Poss JW, Kelly M, Berg K, Fries BE, Morris JN:Adjustment
of nursing home quality indicators.BMC Health Serv Res2010,10:96. 11. Canadian Institute for Health Information.http://www.cihi.ca.
12. Cranley LA, Norton PG, Cummings GG, Barnard D, Batra-Garga N, Estabrooks CA:Identifying resident care areas for a quality improvement intervention in long-term care: a collaborative approach.BMC Geriatrics2012,12:59. 13. Poss J, Murphy KM, Woodbury MG, Orsted H, Stevenson K, Williams G, MacAlpine S, Curtin-Telegdi N, Hirdes JP:Development of the interRAI Pressure Ulcer Risk Scale (PURS) for use in long-term care and home care settings.BMC Geriatrics2010,10:67.
14. Poss JW, Hirdes JP, Fries BE, McKillop I, Chase M:Validation of resource utilization groups version III for home care (RUG-III/HC): evidence from a Canadian home care jurisdiction.Med Care2008,46(4):380–387. 15. Hirdes JP, Ljunggren G, Morris JN, Frijters DH, Finne Soveri H, Gray L,
Bjorkgren M, Gilgen R:Reliability of the interRAI suite of assessment instruments: a 12-country study of an integrated health information system.BMC Health Serv Res2008,8:277.
16. Hirdes JP, Fries BE, Morris JN, Ikegami N, Zimmerman D, Dalby DM, Aliaga P, Hammer S, Jones R:Home care quality indicators (HCQIs) based on the MDS-HC.Gerontologist2004,44(5):665–679.
17. Boulkedid R, Abdoul H, Loustau M, Sibony O, Alberti C:Using and reporting the Delphi method for selecting healthcare quality indicators: a systematic review.PloS One2011,6(6):e20476.
18. Centers for Medicare & Medicaid Services:MDS 3.0 quality measures: user’s manual.Research Triangle Park, NC: RTI International; 2013.
19. Long-term care public reporting website technical report.http://www. hqontario.ca/public-reporting/long-term-care.
20. Simmons SF, Cadogan MP, Cabrera GR, Al-Samarrai NR, Jorge JS, Levy-Storms L, Osterweil D, Schnelle JF:The Minimum Data Set depression quality indicator: does it reflect differences in care processes?Gerontologist2004,
44(4):554–564.
21. Hill-Westmoreland EE, Gruber-Baldini AL:Falls documentation in nursing homes: agreement between the minimum data set and chart abstractions of medical and nursing documentation.J Am Geriatr Soc2005,53(2):268–273. 22. Hutchinson A, Milke D, Maisey S, Johnson C, Squires J, Teare G, Estabrooks
C:The Resident Assessment Instrument-Minimum Data Set 2.0 quality indicators: a systematic review.BMC Health Serv Res2010,10:166. 23. Simmons SF, Garcia ET, Cadogan MP, Al-Samarrai NR, Levy-Storms LF, Osterweil
D, Schnelle JF:The Minimum Data Set weight-loss quality indicator: does It reflect differences in care processes related to weight loss?J Am Geriatr Soc 2003,51(10):1410–1418.
24. Stevenson KB, Moore JW, Sleeper B:Validity of the Minimum Data Set in identifying urinary tract infections in residents of long-term care facilities.J Am Geriatr Soc2004,52(5):707–711.
25. Cadogan MP, Schnelle JF, Yamamoto-Mitani N, Cabrera G, Simmons SF:A Minimum Data Set prevalence of pain quality indicator: is It accurate and does It reflect differences in care processes?J Gerontol A Biol Sci Med Sci2004,59(3):M281–M285.
doi:10.1186/1756-0500-6-460
Cite this article as:Estabrookset al.:Practice sensitive quality indicators in RAI-MDS 2.0 nursing home data.BMC Research Notes20136:460.
Submit your next manuscript to BioMed Central and take full advantage of:
• Convenient online submission
• Thorough peer review
• No space constraints or color figure charges
• Immediate publication on acceptance
• Inclusion in PubMed, CAS, Scopus and Google Scholar
• Research which is freely available for redistribution