RESEARCH
Mediation of the effect of serum uric
acid on the risk of developing hypertension:
a population-based cohort study
Zhi Cao
1, Yangyang Cheng
1, Shu Li
1, Hongxi Yang
2, Li Sun
1, Ying Gao
3, Pei Yu
4, Weidong Li
5and Yaogang Wang
1*Abstract
Background: Serum uric acid (SUA) had been associated with incident hypertension, but it is uncertain whether and to what extent the effect of SUA is mediated by other metabolic factors.
Methods: Data from the China Health and Retirement Longitudinal Study (CHARLS) during 2011 to 2015 was employed for this study. A total of 7639 participants aged between 35 and 96 years without hypertension was included. Cox proportional hazards model was used to investigate the association between elevated SUA and hypertension. A mediation model was used to separately explore mediating effects (MEs) of metabolic factors on the association between SUA and incident hypertension.
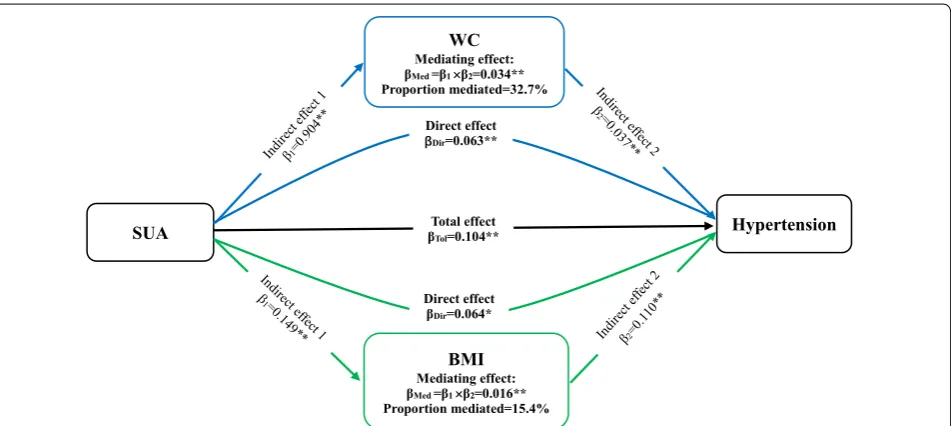
Results: During a median 4.0 years of follow-up, 2348 individuals were diagnosed with hypertension. After adjust-ment for metabolic confounders, participants with the highest SUA quartile had a hazard ratio of 1.16 (1.02–1.33) compared with the lowest category for incident hypertension. The association between SUA and incident hyperten-sion were partially mediated by waist circumference (WC; ME = 0.034), body mass index (BMI; ME = 0.016), triglyc-erides (TG; ME = 0.024), total cholesterol (TC; ME = 0.009), high density lipoprotein cholesterol (HDL-C; ME = 0.009), fasting plasma glucose (FPG; ME = 0.005), and glycated hemoglobin (HbA1c; ME =− 0.002). Additionally, proportional mediation was 32.7% by WC and 15.4% by BMI for obesity indicators; 23.1% by TG, 8.7% by TC, and 8.7% by HDL-C for blood lipid; and 4.8% by FPG and − 1.9% by HbA1c for blood glucose.
Conclusions: The positive association between elevated SUA concentration and hypertension was reconfirmed in a Chinese population. Obesity indicators, blood lipids, and blood glucose may play important mediating roles in the pathways.
Keywords: Uric acid, Hypertension, Metabolic factors, Mediating effect
© The Author(s) 2019. This article is distributed under the terms of the Creative Commons Attribution 4.0 International License (http://creat iveco mmons .org/licen ses/by/4.0/), which permits unrestricted use, distribution, and reproduction in any medium, provided you give appropriate credit to the original author(s) and the source, provide a link to the Creative Commons license, and indicate if changes were made. The Creative Commons Public Domain Dedication waiver (http://creat iveco mmons .org/ publi cdoma in/zero/1.0/) applies to the data made available in this article, unless otherwise stated.
Background
Hyperuricemia has a major public health burden world-wide due to its high prevalence and clinical significance influence on a cluster of cardiometabolic abnormali-ties including hypertension, diabetes and dyslipidemia [1]. Many studies have shown that elevated serum uric acid (SUA) is associated with increased incidence
of hypertension [2–4]. The potential mechanisms to account for this pathway may be adverse, such as inflam-mation and vascular smooth muscle cell proliferation in the renal microcirculation, endothelial dysfunction, and insulin resistance [5, 6].
Although evidences have suggested that elevated SUA concentration might play a role in new-onset hyper-tension, the pathways from SUA to hypertension are mediated by numerous metabolic factors. For instance, in subjects with general obesity or abdominal obesity, hyperinsulinemia attributed to insulin resistance may enhance the reabsorption of uric acid, and fat cells
Open Access
*Correspondence: [email protected]
1 School of Public Health, Tianjin Medical University, 22 Qixiangtai Road, Heping District, Tianjin 300070, China
contribute to the association between hyperuricemia and hypertension [7, 8]. Therefore, despite an associa-tion between SUA and hypertension, SUA may not only be considered as a direct contributor to hypertension, but rather as biologically inert or, possibly, as anti-inflammatory, because it can function as an antioxidant [9–11]. We hypothesize that obesity, blood lipids, and blood glucose may play critical mediating roles in the association between SUA and hypertension.
Mediation analysis is a statistical procedure that can be used to clarify the processes underlying an asso-ciation between two variables and the extent to which the association can be modified or mediated by a third variable. A mediating effect occurs when a third vari-able (the mediator) is responsible for the influence of a given independent variable on a given dependent vari-able, and the contribution of mediators in the pathways can be quantified [12]. Thus, in our study, we revisited the association between elevated SUA concentration and new-onset hypertension among Chinese adults in a representative, nationwide cohort, with a primary aim of exploring the longitudinal mediating effects of association between SUA and the risk of developing hypertension.
Methods
Data source and study population
We used data derived from the China Health and Retire-ment Longitudinal Study (CHARLS) from 2011 to 2015. Designed as a part of a set of international longitudinal aging surveys, CHARLS is a biennial survey of a nation-ally representative population that aims to provide a high-quality public database that reflects current aging-related issues in China. The study collected survey data of approximately 17,500 residents from 450 villages across 28 provinces in mainland China. Details of the sam-pling procedure and descriptions of CHARLS are avail-able elsewhere [13]. All participants were interviewed about demographic characteristics, medical history, life-style, and health behaviors, and physical examinations with a standardized questionnaire and relevant instru-ments. Participants with laboratory biomarkers at base-line totaled 11,847, of whom 215 died and 344 were lost to follow-up in the subsequent waves of the study. Next, participants whose systolic blood pressure or diastolic blood pressure was higher than 140 mmHg or 90 mmHg at baseline, respectively (n = 1767), and those taking
antihypertensive agents (n = 1026) were also excluded.
Finally, we excluded samples with missing covariate data of uric acid (n = 25), mediating factors (n = 544) and
blood pressure (n = 287), leaving a subset of 7639
partici-pants for inclusion in the final analysis.
Identification of hypertension
After participants had rested for at least 5 min, research assistants measured their blood pressure using an elec-tronic blood pressure monitor (Omron HEM-7112; Omron [Dalian] Co, Dalian, China). Participants were asked to sit, relax, and refrain from speaking during the measurement, and their blood pressure was measured three times consecutively. The average of the three blood pressure values was used to represent the blood pressure estimates for analysis. Participants with systolic blood pressure above 140 mmHg, diastolic blood pressure above 90 mmHg, or self-reported use of antihypertensive agents were diagnosed with hypertension.
Biomarkers and covariates assessment
CHARLS included the collection of blood samples from fasting participants. SUA, fasting plasma glucose (FPG), glycated hemoglobin (HbA1c), total cholesterol (TC), triglycerides (TG), high density lipoprotein cholesterol (HDL-C), low density lipoprotein cholesterol (LDL-C), creatinine (CRE), blood urea nitrogen (BUN), and C reactive protein (CRP) were tested from a subset of blood samples (n = 11,847) by professional staff.
Sociodemographic variables included age, sex, marital status (married, divorced, widowed), and education level (primary school or lower, secondary school, and univer-sity degree or higher). Health behavior variables included smoking status (never, former, current), alcohol intake (never, light: less than thrice a month, moderate: less than twice a week, high: more than thrice a week), and sleep duration (short: less than 6 h, moderate: 6 to 8 h, long: more than 8 h). Anthropometric indicators included body mass index (BMI), waist circumference (WC), systolic blood pressure (SBP), diastolic blood pressure (DBP), grip strength, and pulse rate (PR). Health-related variables measured included disability and depressive symptoms. Disability was assessed by the Basic Activities of Daily Living Scale (BADL) and the Instrumental Activ-ities of Daily Living Scale (IADL) [14, 15]. The depressive symptoms of the respondents were evaluated using the ten-item Center for Epidemiologic Studies Depression Scale short form, which has been reviewed as a valid and reliable instrument for the assessment of depression in China [16].
Statistical analyses
statistical differences between SUA level and each char-acteristic using Chi square test or one-way analysis of variance (ANOVA). Additionally, SBP, DBP, PR, BUN, FPG, TC, TG, HDL-C, and LDL-C values were normal-ized with a natural logarithm transformation in further analysis.
We calculated each participant’s person-time from the date of the baseline questionnaire to whichever came first of the date of diagnosis of hypertension, lost to follow-up, or end of the follow-up period. Cox proportional hazards regression model was used to calculate the hazard ratios (HRs) and 95% confi-dence intervals (CIs) for each quartile, using the low-est quartile as the reference category for all analyses. Schoenfeld residuals were used to assess whether pro-portionality assumptions were satisfied, the results of which suggested that the assumptions were not vio-lated. The regression models included follow-up dura-tion as the time scale, stratified by age. Simultaneously, we adjusted for confounders including gender, marital status, educational level, cigarette smoking, alcohol intake, depressive symptoms, disability, grip strength, sleep duration, baseline SBP, and baseline DBP, BMI, WC, PR, TC, TG, HDL-C, LDL-C, FPG, HbA1c, BUN, CRE, and CRP. Linear trends were assessed using the Mantel extension test, with the median value of each category of SUA level included in the model as a con-tinuous variable.
Once the temporal relationship between SUA and hypertension had been established, mediation mod-els were constructed to examine whether the asso-ciation between SUA and hypertension were mediated by metabolism factors. Mediation analysis was con-ducted according to a bootstrap approach proposed by Preacher and Hayes [17]. This statistical approach has been applied successfully in previous studies to dem-onstrate the role of mediators [18–21]. We included demographics, health behaviors and physical measure-ments as covariates to adjust for the mediating effect of these biomarkers on the association between SUA level and incident hypertension, as it’s necessarily for media-tion models that baseline covariates are sufficient to control for exposure-outcome, mediator-outcome, and exposure-mediator confounding [22, 23]. Additionally, we assessed the interaction effect by including inter-action terms between SUA and each mediator in the model, testing with the likelihood ratio test. We used STATA 15.0 and SPSS PROCESS for the statistical anal-yses. All statistical tests were two-sided, with P < 0.05 considered to indicate statistical significance.
Results
A total of 7639 participants (males, n = 3546) were
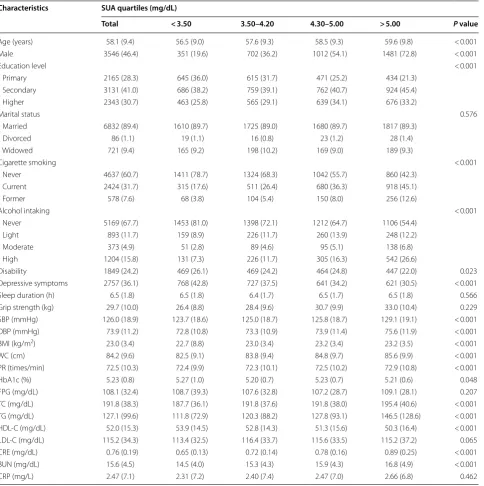
included in the final analysis. During a total of 29,436.2 person-years (median follow-up period 4.0 years), 2348 participants were diagnosed with hypertension. Table 1 shows the baseline characteristics of participants accord-ing to SUA concentration quartiles. Mean age was 58.1 years (range 35.0–96.0 years), and mean SUA con-centration was 4.33 mg/dL.
The association between SUA and hypertension
Table 2 shows the association between SUA concentra-tion and the risk of new-onset hypertension. In a crude model using the lowest quartile as reference, the risk of hypertension increased with higher quartiles of SUA (P for trend < 0.001). The HRs (95% CI) were 1.08 (0.96– 1.22, P = 0.216), 1.16 (1.02–1.31, P = 0.019), and 1.39
(1.23–1.56, P < 0.001) for quartiles 2–4, respectively. Subsequently, we progressively adjusted for partial con-founding factors and suggested that hypertension risk was correspondingly attenuated in each quartile group in model 1 and model 2. Finally, after adjustment for all potential confounders in model 3, the risk of new-onset hypertension was 16% higher in the highest quartile com-pared with the lowest quartile: HR = 1.16 (1.02–1.33,
P = 0.029). This model showed similar results to models
1 and 2, with a linear trend (P for trend < 0.01) and only the highest quartile remained statistically significant (P < 0.05).
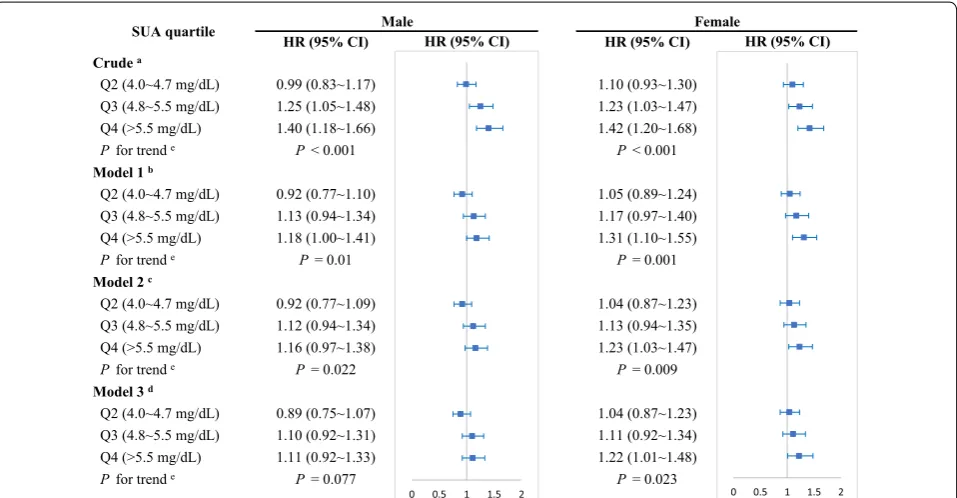
By gender subgroup, we found participants in the highest quartile of SUA compared with the lowest quar-tile were significantly associated with a 22% increased risk of hypertension (HR = 1.22 [1.01–1.48]) for female
after adjustment for all potential confounders (Fig. 1). Whereas, no association was seen between the quartiles of SUA and incident hypertension for male (HR = 1.11
[0.92–1.33]), which indicated only female but not male with a higher SUA level had an independent risk for inci-dent hypertension.
Mediation analysis between SUA and hypertension
We tested WC, BMI, PR, TC, TG, HDL-C, LDL-C, FPG, HbA1c, CRE, BUN, and CRP as potential mediators of the association between SUA and hypertension (Table 3). The total effect of SUA on hypertension was 0.104 (0.060–0.149; P < 0.001).
WC and BMI, as variables relating to obesity, had a par-tially mediating effect on the association between SUA and hypertension (ME = 0.034 [0.026–0.043] and 0.016
hypertension (ME = 0.002 (− 0.001 to 0.006), P = 0.147). Next, the association between SUA and hypertension were partially mediated by TG, TC, and HDL-C for blood lipid, with ME and PM 0.024 (0.170–0.032) and 23.1%, respectively, for TG; 0.009 (0.005–0.014) and 8.7% for TC; and 0.009 (0.004–0.015) and 8.7% for HDL-C (Fig. 3). Conversely, LDL-C was not a mediator in this association (ME =− 0.001 [− 0.003 to 0.001], P = 0.204). Moreover, FPG simultaneously played a mild mediating role in the
association between SUA and hypertension (ME = 0.005 [0.002–0.010], P = 0.01; PE = 4.8%) (Fig. 4). Nevertheless, HbA1c had a negatively mediating effect on this asso-ciation (ME =− 0.002 [− 0.005 to − 0.001], P = 0.044; PM =− 1.9%).
The remaining factors CRE, BUN, and CRP did not contribute to the association between SUA and hypertension (ME: P > 0.05). No significant statistical
Table 1 Baseline characteristics of the study population according to SUA quartiles Characteristics SUA quartiles (mg/dL)
Total < 3.50 3.50–4.20 4.30–5.00 > 5.00 P value
Age (years) 58.1 (9.4) 56.5 (9.0) 57.6 (9.3) 58.5 (9.3) 59.6 (9.8) < 0.001
Male 3546 (46.4) 351 (19.6) 702 (36.2) 1012 (54.1) 1481 (72.8) < 0.001
Education level < 0.001
Primary 2165 (28.3) 645 (36.0) 615 (31.7) 471 (25.2) 434 (21.3)
Secondary 3131 (41.0) 686 (38.2) 759 (39.1) 762 (40.7) 924 (45.4)
Higher 2343 (30.7) 463 (25.8) 565 (29.1) 639 (34.1) 676 (33.2)
Marital status 0.576
Married 6832 (89.4) 1610 (89.7) 1725 (89.0) 1680 (89.7) 1817 (89.3)
Divorced 86 (1.1) 19 (1.1) 16 (0.8) 23 (1.2) 28 (1.4)
Widowed 721 (9.4) 165 (9.2) 198 (10.2) 169 (9.0) 189 (9.3)
Cigarette smoking < 0.001
Never 4637 (60.7) 1411 (78.7) 1324 (68.3) 1042 (55.7) 860 (42.3)
Current 2424 (31.7) 315 (17.6) 511 (26.4) 680 (36.3) 918 (45.1)
Former 578 (7.6) 68 (3.8) 104 (5.4) 150 (8.0) 256 (12.6)
Alcohol intaking < 0.001
Never 5169 (67.7) 1453 (81.0) 1398 (72.1) 1212 (64.7) 1106 (54.4)
Light 893 (11.7) 159 (8.9) 226 (11.7) 260 (13.9) 248 (12.2)
Moderate 373 (4.9) 51 (2.8) 89 (4.6) 95 (5.1) 138 (6.8)
High 1204 (15.8) 131 (7.3) 226 (11.7) 305 (16.3) 542 (26.6)
Disability 1849 (24.2) 469 (26.1) 469 (24.2) 464 (24.8) 447 (22.0) 0.023
Depressive symptoms 2757 (36.1) 768 (42.8) 727 (37.5) 641 (34.2) 621 (30.5) < 0.001
Sleep duration (h) 6.5 (1.8) 6.5 (1.8) 6.4 (1.7) 6.5 (1.7) 6.5 (1.8) 0.566
Grip strength (kg) 29.7 (10.0) 26.4 (8.8) 28.4 (9.6) 30.7 (9.9) 33.0 (10.4) 0.229
SBP (mmHg) 126.0 (18.9) 123.7 (18.6) 125.0 (18.7) 125.8 (18.7) 129.1 (19.1) < 0.001
DBP (mmHg) 73.9 (11.2) 72.8 (10.8) 73.3 (10.9) 73.9 (11.4) 75.6 (11.9) < 0.001
BMI (kg/m2) 23.0 (3.4) 22.7 (8.8) 23.0 (3.4) 23.2 (3.4) 23.2 (3.5) < 0.001
WC (cm) 84.2 (9.6) 82.5 (9.1) 83.8 (9.4) 84.8 (9.7) 85.6 (9.9) < 0.001
PR (times/min) 72.5 (10.3) 72.4 (9.9) 72.3 (10.1) 72.5 (10.2) 72.9 (10.8) < 0.001
HbA1c (%) 5.23 (0.8) 5.27 (1.0) 5.20 (0.7) 5.23 (0.7) 5.21 (0.6) 0.048
FPG (mg/dL) 108.1 (32.4) 108.7 (39.3) 107.6 (32.8) 107.2 (28.7) 109.1 (28.1) 0.207
TC (mg/dL) 191.8 (38.3) 187.7 (36.1) 191.8 (37.6) 191.8 (38.0) 195.4 (40.6) < 0.001
TG (mg/dL) 127.1 (99.6) 111.8 (72.9) 120.3 (88.2) 127.8 (93.1) 146.5 (128.6) < 0.001
HDL-C (mg/dL) 52.0 (15.3) 53.9 (14.5) 52.8 (14.3) 51.3 (15.6) 50.3 (16.4) < 0.001
LDL-C (mg/dL) 115.2 (34.3) 113.4 (32.5) 116.4 (33.7) 115.6 (33.5) 115.2 (37.2) 0.065
CRE (mg/dL) 0.76 (0.19) 0.65 (0.13) 0.72 (0.14) 0.78 (0.16) 0.89 (0.25) < 0.001
BUN (mg/dL) 15.6 (4.5) 14.5 (4.0) 15.3 (4.3) 15.9 (4.3) 16.8 (4.9) < 0.001
[image:4.595.59.544.101.588.2]interactions between SUA and each mediator in rela-tion to incident hypertension were found (all P > 0.05), suggesting independent roles for metabolism fac-tors in the association between SUA and incident hypertension.
Discussion
[image:5.595.56.540.112.218.2]In this nationwide prospective cohort study, we recon-firmed the positive association between elevated SUA concentration and hypertension in the Chinese popu-lation. This association was obviously attenuated after adjustment for metabolic factors, suggesting that the
Table 2 Crude and adjusted hazard ratios for association between SUA categorized by quartiles and new-onset hypertension
a Crude: stratified by age
b Model 1: stratified by age and simultaneously adjusted for gender, educational level, marital status, cigarette smoking, alcohol intaking, sleep duration, disability,
depressive symptoms, grip, SBP, DBP
c Model 2: as for model 1 and further adjusted for FPG, TG, TC, HDL, HbA1c, BMI, WC d Model 3: as for model 2 and simultaneously adjusted for BUN, LDL, CRP, PR, CRE
eP value was calculated by the Mantel extension test for linear trends, and the median values of each category of SUA were included in the model as a continuous
variable
SUA Q1 Q2 Q3 Q4 P for trende
Range (mg/dL) < 3.5 3.5–4.2 4.3–5.0 > 5.0 –
Events 487 567 569 725 –
Person-years 6965.6 7511.0 7177.7 7781.9 –
Crudea Ref (1) 1.08 (0.96–1.22) 1.16 (1.02–1.31) 1.39 (1.23–1.56) < 0.001
Model 1b Ref (1) 1.03 (0.91–1.17) 1.12 (0.99–1.27) 1.25 (1.10–1.42) < 0.001
Model 2c Ref (1) 1.02 (0.90–1.16) 1.10 (0.96–1.25) 1.20 (1.06–1.37) < 0.001
Model 3d Ref (1) 1.01 (0.89–1.15) 1.07 (0.94–1.22) 1.16 (1.02–1.33) 0.003
HR (95% CI) HR (95% CI)
0.99 (0.83~1.17) 1.10 (0.93~1.30)
1.25 (1.05~1.48) 1.23 (1.03~1.47)
1.40 (1.18~1.66) 1.42 (1.20~1.68)
P < 0.001 P < 0.001
0.92 (0.77~1.10) 1.05 (0.89~1.24)
1.13 (0.94~1.34) 1.17 (0.97~1.40)
1.18 (1.00~1.41) 1.31 (1.10~1.55)
P = 0.01 P = 0.001
0.92 (0.77~1.09) 1.04 (0.87~1.23)
1.12 (0.94~1.34) 1.13 (0.94~1.35)
1.16 (0.97~1.38) 1.23 (1.03~1.47)
P = 0.022 P = 0.009
0.89 (0.75~1.07) 1.04 (0.87~1.23)
1.10 (0.92~1.31) 1.11 (0.92~1.34)
1.11 (0.92~1.33) 1.22 (1.01~1.48)
P = 0.077 P = 0.023
SUA quartile Crude a
Q2 (4.0~4.7 mg/dL) Q3 (4.8~5.5 mg/dL) Q4 (>5.5 mg/dL)
Pfor trend e
Model 1 b
Q2 (4.0~4.7 mg/dL) Q3 (4.8~5.5 mg/dL) Q4 (>5.5 mg/dL)
Pfor trend e
Model 2 c
Q2 (4.0~4.7 mg/dL) Q3 (4.8~5.5 mg/dL) Q4 (>5.5 mg/dL)
Pfor trend e
Model 3 d
Q2 (4.0~4.7 mg/dL) Q3 (4.8~5.5 mg/dL) Q4 (>5.5 mg/dL)
Pfor trend e
HR (95% CI) HR (95% CI)
Male Female
0 0.5 1 1.5 2 0 0.5 1 1.5 2
Fig. 1 Crude and adjusted hazard ratios for association between SUA and hypertension by sex. aCrude: stratified by age. bModel 1: stratified by age
and simultaneously adjusted for gender, educational level, marital status, cigarette smoking, alcohol intaking, sleep duration, disability, depressive symptoms, grip, SBP, DBP. cModel 2: as for model 1 and further adjusted for FPG, TG, TC, HDL, HbA1c, BMI, WC. dModel 3: as for model 2 and
simultaneously adjusted for BUN, LDL, CRP, PR, CRE. eP value was calculated by the Mantel extension test for linear trends, and the median values of
[image:5.595.60.539.313.562.2]association between SUA and hypertension were partially mediated. According to the results of mediation analysis, we found that WC and BMI as obesity indicators; TG, TC, and HDL-C for blood lipid; and FPG and HbA1c for blood glucose may play important mediating effects on the association between SUA and hypertension.
Previous studies have verified the association between elevated SUA concentration and incident hyperten-sion [24, 25], but these studies seemed not to investi-gate contributions of obesity and metabolic factors on
the association between SUA and hypertension. SUA can directly act on fat cells to induce their inflammatory response. Although uric acid usually has an antioxidant effect, in the state of obesity, especially with excessive abdominal fat [26], SUA can be converted into oxidant and directly participate in the proliferation and oxida-tive stress of fat cells [27]. Inflammation and oxidative stress induced by obesity may predispose individuals to a higher risk of hypertension [28]. Therefore, abdominal obesity and general obesity play fundamental roles in
Table 3 Direct and indirect effects of SUA on the risk of hypertension and the proportion mediated by metabolic factors
a The test for statistical interaction between SUA level and mediators in relation to incident hypertension
b The proportion mediated was calculated as indirect effect divided by total effect. Total effect = 0.104 (0.060–0.149), P < 0.001
Potential
mediators Direct effect Indirect effect P for interaction
a Proportion
mediated (%)b
βDir (95% CI) Z P βInd (95% CI) Z P
WC 0.063 (0.018 to 0.108) 2.73 0.006 0.034 (0.026 to 0.043) 7.99 < 0.001 0.624 32.7 BMI 0.064 (0.018 to 0.109) 2.74 0.018 0.016 (0.009 to 0.024) 4.35 < 0.001 0.769 15.4 TG 0.069 (0.024 to 0.114) 2.97 0.020 0.024 (0.170 to 0.032) 6.51 < 0.001 0.814 23.1 TC 0.089 (0.044 to 0.134) 3.89 < 0.001 0.009 (0.005 to 0.014) 4.16 < 0.001 0.999 8.7 HDL-C 0.094 (0.049 to 0.139) 4.13 < 0.001 0.009 (0.004 to 0.015) 3.59 < 0.001 0.871 8.7 FPG 0.102 (0.057 to 0.146) 4.48 < 0.001 0.005 (0.002 to 0.010) 2.58 0.010 0.627 4.8 HbA1c 0.106 (0.062 to 0.151) 4.69 < 0.001 − 0.002 (− 0.005 to − 0.001) − 1.93 0.044 0.572 − 1.9 CRE 0.102 (0.054 to 0.149) 4.19 < 0.001 0.003 (− 0.024 to 0.025) 0.273 0.785 0.978 – PR 0.101 (0.057 to 0.146) 4.46 < 0.001 0.002 (− 0.001 to 0.006) 1.45 0.147 0.887 – LDL-C 0.104 (0.059 to 0.148) 4.58 < 0.001 − 0.001 (− 0.003 to 0.001) − 1.27 0.204 0.995 – CRP 0.104 (0.060 to 0.149) 4.61 < 0.001 − 0.001 (− 0.002 to 0.001) − 0.208 0.840 0.331 – BUN 0.109 (0.064 to 0.154) 4.77 < 0.001 − 0.007 (− 0.015 to 0.003) − 1.48 0.140 0.882 –
[image:6.595.57.540.101.287.2] [image:6.595.63.539.337.550.2]the pathways between SUA and hypertension, with our results reasonably revealing that the association between SUA and hypertension is mediated by WC and BMI, with the larger proportion mediated. A recent study demon-strated that BMI may modify the association between SUA and blood pressure status among Japanese men [28].
Several studies conducted simultaneously have examined the close association between abdominal or visceral fat with SUA [29, 30].
Lipid metabolic disorder and SUA are mutually asso-ciated. An increase in SUA concentration can lead to a decline in lipoprotein enzyme activity affecting lipid
Fig. 3 The contribution of blood lipid for the association between SUA and hypertension. *P < 0.05, **P < 0.01. SUA, serum uric acid; TG, triglycerides; TC, total cholesterol; HDL-C, high density lipoprotein cholesterol
[image:7.595.58.538.88.335.2] [image:7.595.64.539.378.601.2]metabolism, and eventually the adipose factors regulat-ing the synthesis of fat are altered [31]. Furthermore, a previous study showed that elevated SUA concentration is closely related to cardiometabolic disorder [32], fur-ther having an unfavorable impact on lipid. In our study, TG, TC, and HDL-C mediated at higher proportions in the pathways between SUA and hypertension. A previ-ous study reported an association between LDL-C and hypertension [33]; our mediation analysis indicated that LDL-C was not a mediator for SUA and hypertension, which does not necessarily mean that LDL-C is not asso-ciated with SUA or hypertension.
Another pathomechanism that potentially explains the pathway between elevated SUA and hypertension is insu-lin resistance [34]. Uric acid decreases tissue response to insulin by inhibiting the biological utilization of nitric oxide, thus producing insulin resistance [35]. Elevated serum insulin level can cause sympathetic nerve inhibi-tion to increase plasma norepinephrine concentrainhibi-tion, as a result of blood pressure rising accordingly [36]. We found fasting plasma glucose had a partially mediating effect on the association between SUA and hyperten-sion. This seems to be consistent with the pathogenesis of hypertension with SUA. Han et al. [37]. recently showed that insulin resistance partially mediated the effect of uric acid on subsequent hypertension, and blood glucose obviously fluctuated in this process. Nevertheless, HbA1c had a negatively mediating effect on the relationship between SUA and hypertension in our study, suggesting a negative association between SUA and HbA1c. Li et al. [38]. found consistently that SUA was inversely corre-lated with HbA1c; the reverse transport of uric acid and glucose in renal tubules may account for this association.
Despite the uncontroversial relationship between SUA and hypertension, our results further revealed that this association was not applicable in men. A number of stud-ies have consistently suggested that SUA is not an inde-pendent factor for incident hypertension in men [39, 40]. One explanation was that age had an effect on the rela-tionship between elevated SUA and hypertension [41]. We also argue that the relationship between SUA and hypertension is susceptible to metabolic factors that may confound this association in men. In other words, meta-bolic factors may fully mediate this association among older men.
Our study had several limitations. Firstly, we assessed the mediating effects of obesity, blood lipid, and blood glucose on the association between SUA and hyperten-sion separately. But considering the combined medi-ating effect and interactive effect mutually of these metabolic mediators may not be feasible, due to the complexity of many mediator permutations. Secondly, we only analyzed the mediators of association between
uric acid and hypertension from the perspective of epidemiology, although our results were consistent with the pathogenesis between SUA and hypertension verified by previous basic experiments. Distinctively, our strength is that we quantified the contribution of metabolism factors in the pathways. Finally, the results could be applicable to this but not necessarily other populations because of (a) special sets of exposures of this population, (b) the genetic ancestry of this popula-tion, and (c) special relationships among the mediating phenotypes with each other. Finally, it was an observa-tional study; therefore, the observed associations might not be fully causal, further strongly causal mechanism behind the pathways from SUA to hypertension may be need to be verified by biological experiment.
Conclusions
Our study revealed that elevated SUA concentration was independently associated with new-onset hypertension, even after adjustment for metabolic confounders, in a Chinese population. Mediation analysis demonstrated, for the first time to our knowledge, that the associa-tion between SUA and hypertension was mostly medi-ated by obesity, blood lipid, and blood glucose, and that abdominal obesity played the largest mediating role in the association. The findings of our mediating effect of SUA and developing hypertension may strengthen our understanding of the influencing mechanisms of incident hypertension, emphasizing the important roles of SUA and metabolic factors as conjunctive intervention targets for prevention of hypertension.
Abbreviations
SUA: serum uric acid; SBP: systolic blood pressure; DBP: diastolic blood pres-sure; PR: pulse rate; BMI: body mass index; WC: waist circumference; BUN: blood urea nitrogen; FPG: fasting plasma glucose; TC: total cholesterol; TG: triglycerides; HDL-C: high density lipoprotein cholesterol; LDL-C: low density lipoprotein cholesterol; CRE: creatinine; CRP: C reactive protein; HbA1c: glycated hemoglobin; ME: mediating effect; HR: hazard ratio; SD: standard deviation.
Acknowledgements
We thank Peking University, the National Natural Science Foundation of China, and we also acknowledge all the participants in the survey design and data collection as well as the CHARLS research team for collecting high-quality, nationally representative data and for making the data public.
Authors’ contributions
YGW and ZC conceived and designed the study. ZC, YYC, LS and HXY acquired the data. ZC performed the statistical analysis, assisted by YYC and YG. ZC and YGW drafted the manuscript. YG, LS, PY, WDL and YGW reviewed the manu-script and approved the final version to be published. YGW was responsible for study supervision. All authors read and approved the final manuscript. Funding
Availability of data and materials
The datasets generated and during the current study are available in the CHARLS repository, http://charl s.pku.edu.cn/en.
Ethics approval and consent to participate
Each participant included in this study signed a written informed consent form before taking the survey. Ethics approval for the data collection in CHARLS was obtained from the Biomedical Ethics Review Committee of Peking University (IRB00001052-11015).
Consent for publication Not applicable. Competing interests
The authors declare that they have no competing interests. Author details
1 School of Public Health, Tianjin Medical University, 22 Qixiangtai Road, Heping District, Tianjin 300070, China. 2 Department of Biostatistics, School of Public Health, Yale University, New Haven, USA. 3 Department of Health Management, Tianjin Medical University General Hospital, Tianjin, China. 4 Metabolic Diseases Hospital and Tianjin Institute of Endocrinology, Tianjin Medical University, Tianjin, China. 5 Research Center of Basic Medical Sciences, Tianjin Medical University, Tianjin, China.
Received: 3 April 2019 Accepted: 13 June 2019
References
1. Borghi C, Rosei EA, Bardin T, Dawson J, Dominiczak A, Kielstein JT, et al. Serum uric acid and the risk of cardiovascular and renal disease. J Hyper-tens. 2015;33(9):1729–41.
2. Kuwabara M, Hisatome I, Niwa K, Hara S, Roncal-Jimenez CA, Bjornstad P, et al. Uric acid is a strong risk marker for developing hypertension from prehypertension: a 5-year japanese cohort study. Hypertension. 2018;71(1):78–86.
3. Wei F, Sun N, Cai C, Feng S, Tian J, Shi W, et al. Associations between serum uric acid and the incidence of hypertension: a Chinese senior dynamic cohort study. J Transl Med. 2016;14(1):110.
4. Kansui Y, Matsumura K, Morinaga Y, Inoue M, Kiyohara K, Ohta Y, et al. Impact of serum uric acid on incident hypertension in a worksite popula-tion of Japanese men. J Hypertens. 2018;36(7):1499–505.
5. Feig DI, Kang DH, Johnson RJ. Uric acid and cardiovascular risk. N Engl J Med. 2008;359(17):1811–21.
6. Johnson RJ, Sanchez-Lozada LG, Mazzali M, Feig DI, Kanbay M, Sautin YY. What are the key arguments against uric acid as a true risk factor for hypertension? Hypertension. 2013;61(5):948–51.
7. Facchini F, Chen YD, Hollenbeck CB, Reaven GM. Relationship between resistance to insulin-mediated glucose uptake, urinary uric acid clear-ance, and plasma uric acid concentration. JAMA. 1991;266(21):3008–11. 8. Hayashi T, Boyko EJ, Leonetti DL, McNeely MJ, Newell-Morris L, Kahn SE, et al. Visceral adiposity is an independent predictor of incident hyperten-sion in Japanese Americans. Ann Intern Med. 2004;140(12):992–1000. 9. Fabbrini E, Serafini M, Colic Baric I, Hazen SL, Klein S. Effect of plasma uric
acid on antioxidant capacity, oxidative stress, and insulin sensitivity in obese subjects. Diabetes. 2014;63(3):976–81.
10. Yang Y, Zhou Y, Cheng S, Sun JL, Yao H, Ma L. Effect of uric acid on mito-chondrial function and oxidative stress in hepatocytes. Genet Mol Res. 2016;15:2.
11. Yang H, Li D, Song X, Liu F, Wang X, Ma Q, et al. Joint associations of serum uric acid and ALT with NAFLD in elderly men and women: a Chinese cross-sectional study. J Transl Med. 2018;16(1):285.
12. Valente MJ, Pelham WE, Smyth H, MacKinnon DP. Confounding in statisti-cal mediation analysis: what it is and how to address it. J Couns Psychol. 2017;64(6):659–71.
13. Zhao Y, Hu Y, Smith JP, Strauss J, Yang G. Cohort profile: the China Health and Retirement Longitudinal Study (CHARLS). Int J Epidemiol. 2014;43(1):61–8.
14. Lawton MP, Brody EM. Assessment of older people: self-maintaining and instrumental activities of daily living. Gerontologist. 1969;9(3):179–86. 15. Katz S, Ford AB, Moskowitz RW, Jackson BA, Jaffe MW. Studies of illness
in the aged. The index of ADL: a standardized measure of biological and psychosocial function. JAMA. 1963;185:914–9.
16. Chen H, Mui AC. Factorial validity of the Center for Epidemiologic Studies Depression Scale short form in older population in China. Int Psychogeri-atr. 2014;26(1):49–57.
17. Preacher KJ, Rucker DD, Hayes AF. Addressing moderated mediation hypotheses: theory, methods, and prescriptions. Multivariate Behav Res. 2007;42(1):185–227.
18. Roos CR, Maisto SA, Witkiewitz K. Coping mediates the effects of cognitive-behavioral therapy for alcohol use disorder among out-patient clients in Project MATCH when dependence severity is high. Addiction. 2017;112(9):1547–57.
19. Nowlin S, Cleland CM, Parekh N, Hagan H, Melkus G. Racial and ethnic disparities in predictors of glycemia: a moderated mediation analysis of inflammation-related predictors of diabetes in the NHANES 2007–2010. Nutr Diabetes. 2018;8(1):56.
20. Corlier F, Hafzalla G, Faskowitz J, Kuller LH, Becker JT, Lopez OL, et al. Systemic inflammation as a predictor of brain aging: contributions of physical activity, metabolic risk, and genetic risk. Neuroimage. 2018;172:118–29.
21. Li Y, Zhang T, Han T, Li S, Bazzano L, He J, et al. Impact of cigarette smok-ing on the relationship between body mass index and insulin: longitu-dinal observation from the Bogalusa Heart Study. Diabetes Obes Metab. 2018;20(7):1578–84.
22. Zhu Y, Hedderson MM, Quesenberry CP, Feng J, Ferrara A. Central obesity increases the risk of gestational diabetes partially through increasing insulin resistance. Obesity (Silver Spring). 2019;27(1):152–60. 23. Pan WC, Wu CD, Chen MJ, Huang YT, Chen CJ, Su HJ, et al. Fine particle
pollution, alanine transaminase, and liver cancer: a Taiwanese prospective cohort study (REVEAL-HBV). J Natl Cancer Inst. 2016;108:3.
24. Scheepers L, Boonen A, Dagnelie PC, Schram MT, van der Kallen CJH, Henry RMA, et al. Uric acid and blood pressure: exploring the role of uric acid production in The Maastricht study. J Hypertens. 2017;35(10):1968–75.
25. Qu LH, Jiang H, Chen JH. Effect of uric acid-lowering therapy on blood pressure: systematic review and meta-analysis. Ann Med. 2017;49(2):142–56.
26. Kim TH, Lee SS, Yoo JH, Kim SR, Yoo SJ, Song HC, et al. The relationship between the regional abdominal adipose tissue distribution and the serum uric acid levels in people with type 2 diabetes mellitus. Diabetol Metab Syndr. 2012;4(1):3.
27. Mazidi M, Kengne AP, Katsiki N, Mikhailidis DP, Banach M. Inverse associa-tion between serum antioxidant levels and inflammatory markers is moderated by adiposity: a report based on a large representative popula-tion sample of American adults. Br J Nutr. 2018;120:1–7.
28. Kawamoto R, Ninomiya D, Senzaki K, Kumagi T. Interaction between body mass index and serum uric acid in relation to blood pressure in community-dwelling Japanese men. Clin Hypertens. 2018;24:1. 29. Sumbul HE, Koc AS. The abdominal aortic intima-media thickness
increases in patients with primary hyperparathyroidism. Exp Clin Endo-crinol Diabetes. 2018;127:387–95.
30. Gu D, Ding Y, Zhao Y, Miao S, Qu Q. Positively increased visceral adiposity index in hyperuricemia free of metabolic syndrome. Lipids Health Dis. 2018;17(1):101.
31. Wang H, Sun Y, Wang S, Qian H, Jia P, Chen Y, et al. Body adiposity index, lipid accumulation product, and cardiometabolic index reveal the contribution of adiposity phenotypes in the risk of hyperuricemia among Chinese rural population. Clin Rheumatol. 2018;37(8):2221–31.
32. Ferreira TDS, Fernandes JFR, Araujo LDS, Nogueira LP, Leal PM, Antunes VP, et al. Serum uric acid levels are associated with cardiometabolic risk factors in healthy young and middle-aged adults. Arq Bras Cardiol. 2018;111:833–40.
33. Cicero AFG, Fogacci F, Giovannini M, Grandi E, D’Addato S, Borghi C. Inter-action between low-density lipoprotein-cholesterolaemia, serum uric level and incident hypertension: data from the Brisighella Heart Study. J Hypertens. 2018. https ://doi.org/10.1097/HJH.00000 00000 00192 7. 34. Pan H, Yan D, Xu M, Li F, Ren M, Zhang J, et al. Interaction between
•fast, convenient online submission
•
thorough peer review by experienced researchers in your field
• rapid publication on acceptance
• support for research data, including large and complex data types
•
gold Open Access which fosters wider collaboration and increased citations maximum visibility for your research: over 100M website views per year
•
At BMC, research is always in progress.
Learn more biomedcentral.com/submissions
Ready to submit your research? Choose BMC and benefit from: syndrome: a community-based study. Exp Clin Endocrinol Diabetes. 2018.
https ://doi.org/10.1055/a-0672-0908.
35. Ndrepepa G. Uric acid and cardiovascular disease. Clin Chim Acta. 2018;484:150–63.
36. Geijselaers SLC, Sep SJS, Claessens D, Schram MT, van Boxtel MPJ, Henry RMA, et al. The role of hyperglycemia, insulin resistance, and blood pres-sure in diabetes-associated differences in cognitive performance-the maastricht study. Diabetes Care. 2017;40(11):1537–47.
37. Han T, Lan L, Qu R, Xu Q, Jiang R, Na L, et al. Temporal relationship between hyperuricemia and insulin resistance and its impact on future risk of hypertension. Hypertension. 2017;70(4):703–11.
38. Li Q, Yang Z, Lu B, Wen J, Ye Z, Chen LL, et al. Serum uric acid level and its association with metabolic syndrome and carotid atherosclerosis in patients with type 2 diabetes. Cardiovasc Diabetol. 2011;10:72.
39. Nishio S, Maruyama Y, Sugano N, Hosoya T, Yokoo T, Kuriyama S. Gender interaction of uric acid in the development of hypertension. Clin Exp Hypertens. 2018;40(5):446–51.
40. Grayson PC, Kim SY, LaValley M, Choi HK. Hyperuricemia and incident hypertension: a systematic review and meta-analysis. Arthritis Care Res (Hoboken). 2011;63(1):102–10.
41. Forman JP, Choi H, Curhan GC. Plasma uric acid level and risk for incident hypertension among men. J Am Soc Nephrol. 2007;18(1):287–92. Publisher’s Note