R E S E A R C H A R T I C L E
Open Access
AKT1
low
quiescent cancer cells persist after
neoadjuvant chemotherapy in triple
negative breast cancer
Sheheryar Kabraji
1,2†, Xavier Solé
1,2,7†, Ying Huang
3, Clyde Bango
3, Michaela Bowden
3, Aditya Bardia
1,2,
Dennis Sgroi
1,2, Massimo Loda
3and Sridhar Ramaswamy
1,2,4,5,6*Abstract
Background:Absence of pathologic complete response (pCR) to neoadjuvant chemotherapy (NACT) correlates with poor long-term survival in patients with triple negative breast cancer (TNBC). These incomplete treatment responses are likely determined by mechanisms that enable cancer cells to resist being killed. However, the detailed characterization of a drug-resistant cancer cell state in residual TNBC tissue after NACT has remained elusive. AKT1lowquiescent cancer cells (QCCs) are a quiescent, epigenetically plastic, and chemotherapy-resistant subpopulation initially identified in experimental cancer models. Here, we asked whether QCCs exist in primary tumors from patients with TNBC and persist after treatment with NACT.
Methods:We obtained pre-treatment biopsy, post-treatment mastectomy, and metastatic specimens from a retrospective cohort of TNBC patients treated with NACT at Massachusetts General Hospital (n= 25). Using quantitative automated immunofluorescence microscopy, QCCs were identified as AKTlow/H3K9me2low/HES1high cancer cells using prespecified immunofluorescence intensity thresholds. QCCs were represented in 2D and 3D digital tumor maps and QCC percentage (QCC-P) and QCC cluster index (QCC-CI) were determined for each sample.
Results:We showed that QCCs exist as non-random and heterogeneously distributed clusters within primary breast tumors. In addition, these QCC clusters persist after treatment with multi-agent, multi-cycle, neoadjuvant
chemotherapy in both residual primary tumors and nodal and distant metastases in patients with triple negative breast cancer.
Conclusions:These first-in-human data potentially qualify AKT1lowquiescent cancer cells as a non-genetic cell state that persists after neoadjuvant chemotherapy in triple negative breast cancer patients and warrants further study. Keywords:AKT1lowquiescent cancer cells, Chemotherapy resistance, Quantitative immunofluorescence microscopy
Background
Triple negative breast cancer (TNBC) is more commonly diagnosed in younger and African-American women, is associated with worse recurrence-free survival and worse overall survival, and has fewer effective treatment options, compared to hormone receptor-positive or human epider-mal growth factor receptor 2 (HER2)-positive breast
cancer [1, 2]. For patients with localized TNBC, neoadju-vant chemotherapy (NACT) is primarily used to increase the success of breast conservation therapy [3]. This neoadjuvant approach also offers an attractive paradigm for evaluating biomarkers of resistance to chemotherapy, since pre-treatment tumor biopsies can be compared to post-treatment mastectomy specimens and pathologic complete response (pCR) to NACT correlates with better clinical outcomes in TNBC [4]. While pCR rates reported in clinical trials vary depending on the definition used, tumor type, and specific neoadjuvant treatment, poor pathologic response despite NACT occurs in 40–60% of * Correspondence:sridhar@mgh.harvard.edu
†Equal contributors
1Massachusetts General Hospital Cancer Center, Richard B. Simches Research
Building, 185 Cambridge Street, Boston, MA 02114, USA 2Harvard Medical School, Boston, MA, USA
Full list of author information is available at the end of the article
patients with TNBC [5]. Absence of pCR after neoadju-vant chemotherapy is presumably determined by mecha-nisms that enable tumor cells to resist being killed. A small number of tumor-specific genetic alterations have been recently described in localized TNBC after NACT (e.g. TP53, MCL1, MYC), although actionable targets remain infrequent [6]. Alternative mechanisms that give rise to drug-resistant cell states such as quiescence or altered epigenetic profile have also been postulated, although the detailed characterization of a putative quies-cent, drug-resistant, cancer cell state in residual TNBC after NACT remains elusive [6–9].
We previously reported that MCF7 (estrogen receptor positive (ER+)) and MDA-MB-231 (triple negative) breast cancer cell lines (among other tumor types) are capable of dividing asymmetrically to form quiescent, AKT1low cancer cells (QCCs) in response to decreased integrin-β1 (ITGB1) signaling from the microenviron-ment both in vitro and in vivo [10, 11]. We have previously shown that these AKT1low slow proliferators also express other markers of quiescence in being
ROSlow, MKI67low, MCM2low, H3K9me2low and
HES1high [10, 11]; QCCs are intrinsically resistant to cytotoxic chemotherapy and also elaborate CD63+ exo-somes that increase the fitness of surrounding, more rapidly cycling, cancer cells [12]. Moreover, we have found that QCCs exhibit many properties ascribed to cancer stem cells, including an increased tumor-initiating capacity and epigenetic plasticity that contrib-utes to cancer cell heterogeneity [13]. Together, these experimental data suggest that AKT1low quiescent cancer cells may play a role in resistance to cytotoxic therapy and tumor progression.
We previously identified QCCs in a small number of primary breast tumors of different subtypes (ER+, triple negative, HER2+) before and after neoadjuvant chemo-therapy with indirect immunofluorescence confocal microscopy (n= 5) [11]. While this approach is used routinely to identify protein-based biomarkers in formalin-fixed paraffin-embedded (FFPE) human tumors, it is constrained by limited multiplexing, high background, restricted sampling of tumor areas and subjective deter-mination of positive/negative thresholds [14]. In contrast, quantitative immunofluorescence, using a tyramide-signal-amplified (TSA) staining protocol coupled to multi-spectral imaging and automated tissue segmentation, allows for the objective detection of multiple intracellular protein targets within defined regions of interest and en-ables accurate and reproducible assessment of individual cell markers and cell states in a wide variety of human tumor samples [15–18]. Here, we used TSA multiplexed immunofluorescence staining coupled to automated multispectral imaging and computational analysis to iden-tify AKT1low (AKTlow, H3K9me2low, HES1high) QCCs in
tumors from patients with TNBC. We tested the hypoth-esis that QCCs persist in primary and metastatic TNBC breast tumors after NACT.
Methods
Patient cohort and samples
We identified a retrospective cohort of patients with lo-calized TNBC at Massachusetts General Hospital, who underwent neoadjuvant chemotherapy between 2010 and 2014. Tissue samples from 25 patients (10 biopsy samples, 20 mastectomy samples, 4 metastatic samples) were retrieved under an Institutional Review Board (IRB)-approved discarded-tissue protocol (2009P20032) as summarized in the consolidated standards of report-ing trials (CONSORT) diagram (Fig. 1a); of these 25 patients, 8 patients had matched biopsy and mastectomy samples available for analysis, and of these 8 matched patients, 4 had tumors that underwent pCR, and the remaining 4 patients had primary tumors with residual disease after NACT, which were evaluated for QCCs. One patient with a paired biopsy and mastectomy sample with residual disease also had a metastatic tissue sample available for analysis. An additional 2 unmatched biopsies, 12 unmatched mastectomies and 3 unmatched metastases were also available for QCC analysis. Throughout this report, the term sample refers to a single 4-μm tissue section from a single patient tumor.
Pathologic assessment of patient samples
Clinical and pathological information (Fig. 4a) was extracted from the medical record. Residual cancer burden was graded, using standard criteria [19] for as-sessment, on a representative H&E-stained section from each post-treatment mastectomy block, by our study pathologist (DS), who was blinded to QCC results.
Selection of QCC markers
We have previously shown that QCCs can be reliably identified in vitro and in FFPE human tissues using the antibody profile: pan-AKTlow, H3K9me2low, HES1high [11]. In choosing markers with which to identify QCCs in FFPE patient tissues, we were limited by existing im-munofluorescence multiplexing bandwidth to three markers. Therefore, we selected the minimum set of markers that represented canonical features of QCCs, such as quiescence, which we had previously described in vitro [10–12]. To maximize specificity, we opted for at least one marker that was upregulated and another that was downregulated in QCCs.
Tyramide-signal-amplifying immunofluorescence (TSA-IF) labeling
[18]. Primary antibodies were applied iteratively followed by secondary antibody conjugated to horseradish perox-idase (HRP), after which TSA-conjugated fluorophores were applied. Primary antibodies used were, iteratively, H3K9me2 (1:150, abcam ab1220), pan-AKT (1:3000, Cell Signaling 4961, C67E7), and HES1 (1:3000, EMD Milli-pore AB5702). Primary antibodies had been previously independently validated for target specificity [20–22]. This was followed by a secondary antibody conjugated to HRP (SuperPicture Polymer Detection Kit, Life Technologies), and TSA conjugated to a fluorophore (fluorescein isothiocyanate (FITC), cyanine (CY)3, CY5,
respectively, at 1:50 dilution, Perkin Elmer), with inter-vening wash steps. An alternative iteration of primary
antibody application (pan-AKT ➔ H3K9me2 ➔ HES1)
was used to confirm target specificity and absence of primary antibody cross-reactivity (Additional file 1: S2). We applied 4',6-diamidino-2-phenylindole (DAPI) as a nuclear counterstain. Staining was completed in batches of 10 and slides were mounted using ProLong Diamond
Antifade Mountant without DAPI (ThermoFisher
Scientific).
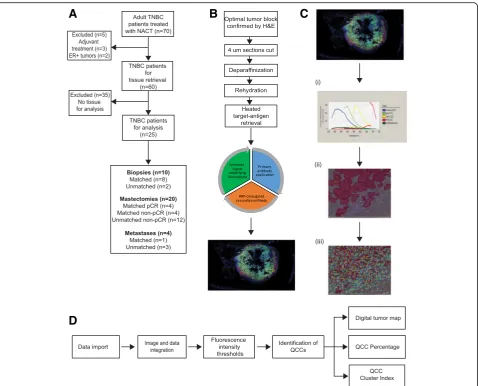
To examine the effects of batch-to-batch staining variability, we used 4 untreated primary breast tumors Fig. 1Detailed workflow for AKT1lowquiescent cancer cell (QCC) identification using tyramide signal amplified immunofluorescence (TSA-IF)
automated microscopy coupled with computational image analysis.aConsolidated standards of reporting trials (CONSORT) diagram for QCC analysis of tissues from a cohort of patients with triple negative breast cancer (TNBC).bScheme demonstrating steps in TSA-IF staining of tumor sections.
[image:3.595.60.539.86.472.2](control tumors 1–4, Fig. 3b). Control tumors 1 and 2 underwent contiguous (4 μm apart) sequential section-ing (n= 2) and sections were stained in different batches. Control tumor 4 underwent contiguous sequential sectioning (n= 3) and all sections were stained in the same batch. Control tumor 3 underwent non-contiguous (>4 μm apart) sequential sectioning (n= 5) and each section was stained in a different batch containing patient samples, to control for inter-batch variation.
Confocal microscopy
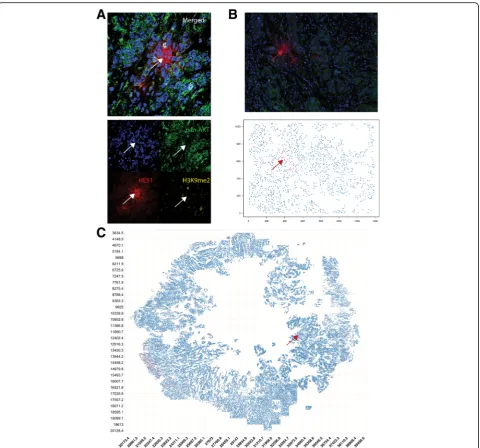
To provide a high-resolution example image of a QCC, section 17 from control tumor 3 was imaged using a Nikon Ti confocal microscope at × 60 magnification (Fig. 2a). Merged and single-color images were labelled using Image J [23].
Spectral imaging and multispectral analysis
Matched H&E-stained slides from each tissue block were reviewed by a collaborating pathologist (YH) to confirm the presence of tumor cells in each tissue block. Multispectral imaging of sections was undertaken as previously described [18]. TSA-IF-stained slides were scanned using the Vectra slide scanner (V2.0.8, PerkinEl-mer) with appropriate fluorescent filters. A scanning protocol was created for multispectral imaging and ap-plied to all slides uniformly (Fig. 1c). Regions of interest were manually selected within the Vectra protocol using low-power field previews of the whole slides as reference and scanned to generate a multispectral image at × 20 magnification. Those images with <1% tumor compo-nent or >70% technical artifacts (e.g. significant tissue folding, air bubbles, or loss of tissue) were excluded. Single-stained (individual marker with specific fluoro-phore e.g. only pan-AKT with FITC) TNBC primary tumor sections and blank control slides were used to build a spectral library for each batch (Fig. 1c). InForm V.2.1.1 software (CRi) was used to analyze the spectral images. An InForm tissue and cell segmentation algo-rithm was developed by selecting representative areas from a training set of 15–20 images, to classify tissue into “tumor” (tumor epithelium) and “stroma” (tumor adjacent tissue) categories. Nuclear segmentation was based on the DAPI signal, with the cytoplasm estimated up to 6 pixels outer distance to nucleus. Tissue classifi-cation and cell segmentation were manually reviewed by our study pathologist (YH) to ensure appropriate classification.
Computational and statistical methods
Raw fluorescence intensity data processing, analysis, and graphical representation of the resulting digital tumor maps were done using R statistical computing software
(R Core Team (2015), R Foundation for Statistical Computing, Vienna, Austria).
QCC percentage (QCC-P) for the biopsy, mastectomy and metastasis samples was determined from a single tissue section taken from a single tumor. For groups (biopsy samples or mastectomy samples) mean ± SD values are reported. The difference in mean QCC-P between the pre-treatment biopsy group and the post-treatment mastectomy group was tested using the un-pairedttest with two-sidedp< 0.05 as the critical value. The difference in mean QCC cluster index (QCC-CI) between the biopsy group and the mastectomy group was tested using the unpaired ttest with two-sidedp< 0.05 as the critical value. Correlation between QCC-P, QCC-I, tumor cellularity was estimated using Pearson’s correlation coefficient.
We undertook a post-hoc power calculation based on our sample size of 10 biopsy samples and 16 mastectomy samples. The difference in mean QCC-P between the bi-opsy group and the mastectomy group was 0.567 ± 0.25 and, assuming a type 1 error rate of 0.05, the power of this study to detect this difference was 0.73.
Determination of immunofluorescence intensity thresholds
The average pixel intensity data for the nuclear compart-ment were used for the H3K9me2 signal, while average pixel intensity data for the cytoplasm compartment were used for the HES1 and AKT. Untreated primary breast tumors (n= 4) were designated “control tumors 1–4” and used as a training set to determine fluorescence in-tensity thresholds.
Using this control tumor training set, we first asked if an absolute threshold of fluorescence intensity could be used for each marker (pan-AKT, H3K9me2, HES1) to define QCCs. We plotted the proportion of cells against fluores-cence intensity from two sequential sections stained simul-taneously (control tumor 4, Additional files 2: S1A and S1B, respectively). The proportion of cells that expressed each QCC marker (e.g. HES1) at a given fluorescence in-tensity was not the same in sequential sections (Additional files 2: S1A and S1B, respectively). This suggested that ab-solute fluorescence intensity thresholds for determining QCCs would not be reproducible across different tumor samples.
tumors 1–4, Additional file 2: S1C-E) We found a pro-portional increase in mean QCC-P and QCC density (QCC-D) (QCC-P per × 20 field of view) with increasing threshold, suggesting no natural cutoff could be detected at the thresholds tested in these control tumors.
Together, these data suggest that there was a continuous expression of each marker (pan-AKT, H3K9me2, HES1) with the absence of a natural cutoff for identifying QCCs. The lack of a natural cutoff has been previously reported for other markers associated with cell proliferation, such as Ki67 [24]. In order to balance specificity and sensitivity, QCCs were defined as those cancer cells expressing the top 25% of fluorescence intensity values for HES1 (HES1high) and the bottom 25% of fluorescence intensity
values for both pan-AKT (AKTlow) and H3K9me2
(H3K9me2low) using this microscopy approach.
Digital tumor maps were generated by de-convoluting cell geographical coordinates from the relative position of each × 20 magnified image from each section. A single cell Cartesian coordinate system was created for each section and used to accurately represent tumor cell geography in a single map. For improved visualization of QCCs in digital tumor maps (red dots) red hue was maximized using Adobe Photoshop CC 2017 software.
Definition of QCC-P and QCC-D
We defined QCC-P as the proportion of QCCs in the total cancer cell population per section. We also defined QCC-D as the QCC-P per × 20 field of view (FOV). QCC-P for the biopsy, mastectomy and metastasis sam-ples was determined from a single tissue section taken from a single patient.
Definition of QCC-CI
The QCC-CI was defined as the proportion of QCCs among the 100 nearest tumor cells for each QCC in a section. Cells with fewer than 100 neighbors in a reason-able proximity (a window of +/- 500 coordinate units in each axis) were discarded. The final QCC-CI for each section was computed by averaging the cluster index for each QCC in that section. Class-label permutation was used to computationally determine the statistical signifi-cance of these results. For each sample, 1000 random sets of k cells, where k is the number of QCCs in the sample, were selected and for each one of theseksets of cells a QCC-CI was computed. Once we collected all 1000 permutation-based QCC-CI for a sample, empirical
pvalues were obtained by comparing them to the score for that sample.
Results
In order to test the hypothesis that QCCs persist after NACT in patients with TNBC, we first used a training set of primary breast tumors (control tumors 1–4) to
develop a QCC identification platform involving TSA-IF labeling of FFPE tissue sections, spectral imaging, and computational analysis as summarized in Fig. 1.
QCCs are distributed heterogeneously within primary breast tumors
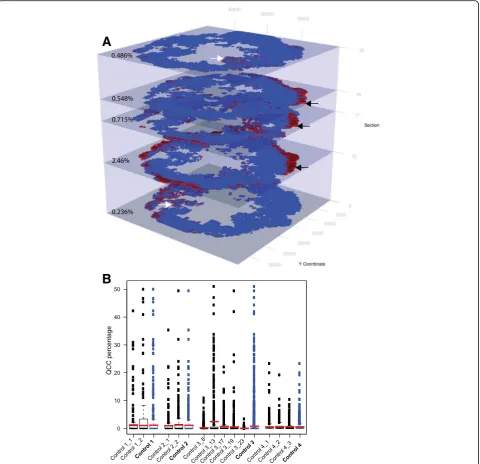
Using the QCC identification platform, we were able to identify and represent AKT1low, H3K9me2low, HES1high QCCs (red dots) and other cancer cells (blue dots) as 2D digital tumor maps of whole sections from TNBC and other breast tumors based on Cartesian coordinates within each section (Fig. 2a, b, c). For clarity, areas of stromal infiltration, necrosis, or poor image quality were excluded from these maps. Initial inspection of these 2D maps suggested that QCCs displayed a high degree of spatial heterogeneity. Our tumor map approach also enabled us to determine the topographical arrangement of QCCs by analyzing sequential sections from tumors. Figure 3a shows digital tumor maps of five sequential but non-contiguous sections from a representative, untreated, TNBC tumor (control tumor 3), arranged in a 3D stack according to the orientation of each within the primary tumor block. In this particular specimen, QCCs were found in the periphery of some sequential sections (black arrows, Fig. 3a) but not others (white arrows, Fig. 3a).
To ask whether QCCs were enriched in specific regions of a given tumor, we defined QCC-P as the proportion of QCCs in the overall cancer population per section. We also defined QCC-D as the QCC-P per × 20 FOV. We noted a tremendous variance in QCC-D within each section (box and whiskers plot), but found that QCC-P (red bars) was relatively con-sistent across sections and between tumors (Fig. 3b). Furthermore, QCC-D was not directly proportional to the total cancer cell density (Additional file 3: S3F). This heterogeneity in QCC location and variation in QCC density suggested that QCC topography might not be determined solely by cancer-cell-intrinsic cues, consistent with prior experimental findings that QCCs arise through irregular interaction between cancer cell surface integrin-β1 receptor and extracellular matrix proteins [10, 11].
The heterogeneous localization of QCCs likely was not a technical artifact, because the identification of QCCs required high HES1 signal concurrently with low AKT and H3K9me2 signal, which would not occur due to ir-regularities in antibody penetration or antigen retrieval alone. In addition, careful study of all tumors did not re-veal consistent patterns in the geographical localization of QCCs.
and QCC geography in sequential sections from control tumors 1, 2 and 3 (stained asynchronously) and sequential
sections from tumor 4 (stained synchronously)
(Figs. 3a and b). We found that QCC percentage (red bars, Fig. 3b) was more similar between contiguous sections (control tumors 1, 2, 4, Fig. 3b) than non-contiguous sections (control tumor 3, Fig. 3b), regard-less of synchronous (control tumor 4) or asynchron-ous (control tumors 1, 2, 3) staining. This suggested
that variation in QCC-P between sections more likely reflected biological variability in QCC location within the tumor rather technical variation in staining. In addition, QCCs appeared to be concentrated in geo-graphic regions that extended across multiple sequen-tial sections stained asynchronously (control tumor 3, black arrows, Fig. 3a). The identification of QCCs in similar regions of sequential sections stained asyn-chronously would be unlikely to happen in the Fig. 2AKT1lowquiescent cancer cells (QCCs) are found in primary breast tumor tissue using quantitative immunofluorescence microscopy.a
[image:6.595.59.540.86.534.2]absence of consistent QCC labeling and identification by the TSA-IF system.
QCCs cluster within primary breast tumors
Visual inspection of this non-random distribution of QCCs suggested that QCCs may actually cluster with other QCCs in untreated primary breast tumors. To fur-ther test this hypothesis, we asked if a given QCC was
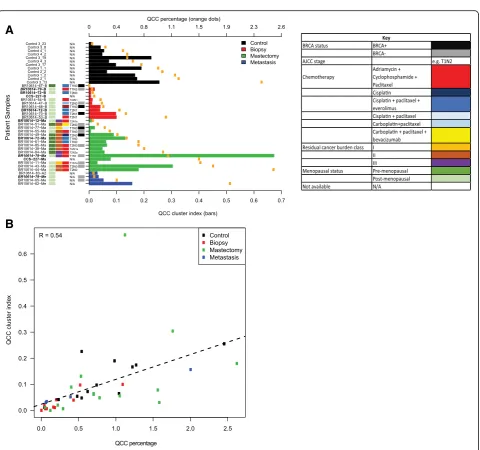
more likely to be found in proximity to other QCCs than to other cancer cells within tumor sections. We defined the QCC-CI as the probability that the nearest neighbors of QCCs were QCCs, rather than other cancer cells (n= 100). We plotted the QCC-CI (bars) and QCC-P (orange dots) for different tumor samples, ordered by increasing QCC-P (Fig. 4a). Absent bars indicate samples for which permutation testing was not significant.
[image:7.595.59.540.88.552.2]Indeed, we found that QCCs were statistically more likely to be found in proximity to other QCCs than other tumor cells in all control primary tumors (black bars, Fig. 4a). Furthermore, QCC-CI positively correlated with QCC-P (R= 0.54) across all samples, suggesting that even as QCC numbers increase they remain in close proximity to other QCCs (Fig. 4b). QCC-CI did not
directly correlate with total cell numbers in each section, however, suggesting that this observed clustering was not simply a function of increasing tumor cellularity (Additional file 3: S3E).
We then used the QCC identification platform to analyze biopsy (n= 10) and mastectomy (n= 16) samples from a retrospective cohort of patients with primary
A
B
Fig. 4AKT1lowquiescent cancer cells (QCC) cluster in primary triple negative breast cancer (TNBC) tumor sections and the likelihood of clustering
[image:8.595.59.540.78.528.2]TNBC that had been treated with NACT, to test the hypothesis that QCCs in primary tumors persist after NACT.
QCC clusters persist after chemotherapy in primary and metastatic TNBC tumors
We compared QCC-P (orange dots) and QCC-CI (pre-treatment: red bars; post-(pre-treatment: green bars) in primary TNBC tumor samples before and after multi-agent, multi-cycle neoadjuvant chemotherapy (Fig. 4a). We found that QCC-P and QCC-CI were positively correlated in pre-treatment biopsy samples (R= 0.89, Additional file 3: S3B), and post-treatment mastectomy samples (R= 0.37, Additional file 3: S3C), a finding that was consistent with control samples (R= 0.74, Additional file 3: S3A). This suggested that the relationship between QCC clustering and QCC percentage was preserved within primary tumors after chemotherapy. QCC-CI did not correlate with total number of tumor cells, however, further supporting the idea that QCC clustering was not a function of the overall cellularity of the specimen after chemotherapy (Additional file 3: S3E). QCC-CI and
QCC-P did not correlate with other clinico-pathologic characteristics such as patient age, menopausal status,
BRCA status, tumor stage, pathologic response
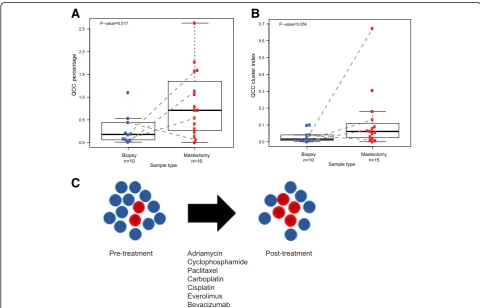
(Additional file 4: S4), or type of chemotherapy (Fig. 4a). Significantly, QCC-P appeared to increase after NACT in post-treatment mastectomy specimens compared to pre-treatment biopsies (Fig. 5a). Paired samples are shown by dotted lines (Fig. 5a). This observation sug-gested that after NACT, QCCs may comprise a larger proportion of residual cells in the tumor, as compared to pre-treatment tumor tissue, as illustrated in Fig. 5c. However, given the limited sampling intrinsic to core biopsy specimens, this finding will require further valid-ation in larger cohorts. QCC-CI was preserved after NACT in post-treatment mastectomy specimens com-pared to pre-treatment biopsies (Fig. 5b). These data further suggested that QCCs persist as clusters after NACT (Fig. 5c). The increase in QCC-P was consistent with either the preferential survival of QCC clusters post-therapy (i.e. selection) or induction of the QCC state by chemotherapy, but further studies are required to distinguish between these two possibilities.
Fig. 5AKT1lowquiescent cancer cells (QCCs) in primary tumors from patients with triple negative breast cancer persist after multi-agent, multi-cycle
[image:9.595.56.537.366.674.2]Finally, we asked whether QCC clusters also exist at metastatic sites after treatment. We determined the QCC-P and QCC-CI in four metastatic TNBC speci-mens (Fig. 4a, blue bars). As in primary tumors, QCC-P and QCC-CI in metastatic tumors were positively corre-lated (R= 1, Additional file 3: S3D). QCCs were also found in TNBC deposits within axillary lymph nodes (BR10614-62, BR10614-79), brain (BR10614-65-Me) and skin (BR10614-83-Me). Intriguingly, the QCC-CI and QCC-P from a single patient with residual axillary disease after NACT (BR10614-62) also appeared to be significantly greater than that of other sites. These lim-ited but provocative data were consistent with QCC clusters existing not only within primary but also within metastatic tumors.
Discussion
AKT1lowquiescent cancer cells have varied cellular prop-erties that are associated with chemotherapy resistance in experimental models [10–13]. A previous study in tumor samples from five breast cancer patients suggesting that QCCs might survive NACT within human tumors was limited by the use of manual microscopy and the small sample size [11]. Here, we developed a quantitative im-munofluorescence microscopy and computational analysis platform to identify and characterize QCCs in clinical tumor specimens, and applied this platform to study a lar-ger cohort of TBNC patients treated with NACT.
For this and future tissue-based studies using quantita-tive immunofluorescence, we defined QCCs as those cancer cells concurrently expressing the 75th percentile of HES1 fluorescence intensity and the 25thpercentile of pan-AKT and H3K9me2 fluorescence intensity, respect-ively, in that sample. We found that QCCs cluster in highly heterogeneous patterns within pre-treatment pri-mary tumors. The non-random distribution of QCCs is consistent with our prior experimental evidence that micro-environmental effects may determine the QCC state, although additional work is necessary to fully explore this idea in human tumors. Given the degree of QCC heterogeneity, future evaluation of multiple se-quential contiguous sections from matched biopsies and untreated whole tumor sections will be needed to define the minimum number of sections necessary to accur-ately represent the QCC-P for an entire tumor.
QCC clusters also appear to persist after multi-agent, multi-cycle chemotherapy in primary tumors and syn-chronous and metasyn-chronous nodal and distant metastases. Patients in this cohort varied in age, menopausal status, ini-tial disease stage, and BRCA status. These randomly se-lected patients were also treated with anthracyclines, taxanes, platinum-based therapy, and mTOR-inhibitors and VEGF-inhibitors. Together, these data are consistent with
QCCs potentially representing a non-genetically
determined cell state that persists after combination chemotherapy of various types at both primary and meta-static sites.
The use of pre-specified fluorescence thresholds to iden-tify QCCs eliminated bias in cell identification and allowed us to quantify QCC-P in patient tumor samples. In addition, representing QCCs and other cancer cells as digital tumor maps allowed us to define the spatial rela-tionships between QCCs and QCC clustering (QCC-CI). This automated approach yielded striking information on the geographical location, density, clustering, and hetero-geneity of QCCs not readily apparent with the use of standard, indirect immunofluorescence and manual mi-croscopy. Given the modest numbers and retrospective nature of our cohort, it was not possible to assess the as-sociation between QCC-P and/or QCC-CI and patient outcomes such as time to recurrence or overall survival, but future studies will address these important issues. In addition, multiplexing of additional markers should enable further study of the relationship between QCC clusters and other cancer and stromal cell subpopulations within breast and other tumors both before and after treatment.
Conclusions
The mechanisms that allow TNBC tumors to survive neo-adjuvant chemotherapy are incompletely understood. Evi-dence suggests that proliferative heterogeneity may contribute to primary chemotherapy resistance in patients with TNBC. However, the identification of a putative quies-cent, drug-resistant, cancer cell state in residual TNBC after NACT has remained elusive. AKT1low quiescent cancer cells are a quiescent, epigenetically plastic, and chemotherapy-resistant subpopulation initially identified in experimental cancer models. Here, we reproducibly dem-onstrated the presence of QCCs in primary and metastatic human breast tumors using automated, quantitative, im-munofluorescence microscopy coupled with computational and statistical analysis. We showed that QCCs exist as non-random and heterogeneously distributed clusters within primary tumors. In addition, these QCC clusters persist after treatment with multi-agent, multi-cycle, NACT in both residual primary tumors and nodal and distant metas-tases in patients with TNBC. Together, these data poten-tially qualify QCCs as a non-genetic cell state that persists after NACT in TNBC patients, and warrants further study.
Additional files
nuclear H3K9me2 (yellow) staining in an example QCC (white arrows). (PDF 3624 kb)
Additional file 2:S1Determination of fluorescence intensity thresholds and staining reproducibility. For each marker (HES1, H3K9me2, pan-AKT) the proportion of cells at a specific fluorescence intensity level was different between sequential sections from control tumor 4, stained simultaneously (S1A and S1B, respectively). QCC percentage (red bars) and QCC density (box and whisker plots) in control tumors 1–4 increased proportionally at 25%, 33%, and 50% thresholds (S1C, S1D, and S1E, respectively). (PDF 2666 kb)
Additional file 3:S3QCC-P and QCC-CI are positively correlated in control samples and in biopsy and mastectomy samples after neoadjuvant chemotherapy. Correlation of QCC-CI and QCC-P in control samples (A), pre-treatment biopsy samples (B), post-treatment mastectomy samples (C), and metastatic samples (D).EQCC-CI does not correlate with total number of cancer cells in each sample.FQCC density (QCC-P per × 20 field of view) in control samples does not positively correlate with cancer cell density (cancer cells per × 20 field of view). (PDF 3045 kb)
Additional file 4:S4QCC-P of pre-treatment biopsies and matched mast-ectomy specimens with pathologic complete response after NACT is not sig-nificantly different from QCC-P of pre-treatment biopsies and matched mastectomy specimens with residual disease after NACT. Plot shows QCC per-centage of pre-treatment biopsies (n= 8,blue dots) ordered by the pathologic response of their matched post-treatment mastectomy specimens (residual disease vs. pathologic complete response)p= 0.39. (PDF 731 kb)
Abbreviations
DAPI:4',6-Diamidino-2-phenylindole; ER: Estrogen receptor; FFPE: Formalin-fixed paraffin-embedded; FITC: Fluorescein isothiocyanate; FOV: Field of view; H&E: Hematoxylin and eosin; HER2: Human epidermal growth factor receptor 2; ITGB1: Integrinβ1; NACT: Neoadjuvant chemotherapy; pCR: Pathologic complete response; QCC: AKT1lowquiescent cancer cells;
QCC-CI: AKT1lowquiescent cancer cell cluster index; QCC-D: AKT1lowquiescent cancer cell density; QCC-P: AKT1lowquiescent cancer cell percentage;
RCB: Residual cancer burden; TNBC: Triple negative breast cancer; TSA: Tyramide-signal-amplified
Acknowledgements
We thank the MGH/DFHCC Histopathology Core and MGH Breast Pathology Department for technical support. We also thank Ipsita Dey-Guha, Nilesh Talele, Ken Ross, and Ben Wittner in the Ramaswamy Laboratory for helpful discussions.
Funding
This work was supported by awards from the National Cancer Institute (R01 CA185086, C06 CA05926), Susan G. Komen for the Cure (IIR 12223648), and Harvard-Ludwig Center for Cancer Research (to S. Ramaswamy). S. Ramaswamy was also supported by a Stand Up to Cancer Innovative Research Grant (Grant number SU2C-AACR-IRG0911). Stand Up To Cancer is a program of the Entertainment Industry Foundation administered by the American Association for Cancer Research. S. Kabraji was supported by Santander/MGH Fellowship. X. Sole was supported by a "Bolsa de Ampliacion de Estudios, Instituto de Salud Carlos III, Ministerio de Economía y Competitividad (BA12/00021)"—Spanish postdoctoral fellowship award. A. Bardia was supported by Jerry Younger Grant for Clinical and Translational Research. D. Sgroi is supported in part by a grant from the Breast Cancer Research Foundation and the Avon Foundation.
Availability of data and materials
All data generated or analyzed during this study are included in this published article and its additional information files.
Authors’contributions
SK, XS, YH, CB, MB, AB, DS, ML, and SR contributed to conception, design of this study, and analysis and interpretation of data. SK, XS, YH, CB, MB, ML, and SR performed microscopy and image analysis. SK, XS, and SR performed computational and statistical analysis. SK and DS undertook pathologic analysis of tissue specimens. SK and AB retrieved the patient data. SK and SR wrote the manuscript and all authors read and approved the final manuscript.
Authors’information
Not applicable.
Ethics approval and consent to participate
All research was performed in accordance with the Declaration of Helsinki. Human tissue and related clinical and pathological data were retrieved under Partners Healthcare/Massachusetts General Hospital IRB-approved discarded tissue use protocol 2009P002302. As per the discarded tissue use protocol 2009P002302, no consent from participants is needed.
Consent for publication
Not applicable.
Competing interests
The authors declare that they have no competing interests.
Publisher’s Note
Springer Nature remains neutral with regard to jurisdictional claims in published maps and institutional affiliations.
Author details
1Massachusetts General Hospital Cancer Center, Richard B. Simches Research
Building, 185 Cambridge Street, Boston, MA 02114, USA.2Harvard Medical School, Boston, MA, USA.3Dana-Farber Cancer Institute, Boston, MA, USA. 4Broad Institute of Harvard & MIT, Cambridge, MA, USA.5Harvard Stem Cell
Institute, Cambridge, MA, USA.6Harvard-Ludwig Center for Cancer Research, Boston, MA, USA.7Present address: Cancer Prevention and Control Program, Catalan Institute of Oncology-IDIBELL, Barcelona, Spain.
Received: 23 February 2017 Accepted: 5 July 2017
References
1. Lin NU, Vanderplas A, Hughes ME, Theriault RL, Edge SB, Wong YN, Blayney DW, Niland JC, Winer EP, Weeks JC. Clinicopathologic features, patterns of recurrence, and survival among women with triple-negative breast cancer in the National Comprehensive Cancer Network. Cancer.
2012;118(22):5463–72.
2. Pal T, Bonner D, Cragun D, Monteiro AN, Phelan C, Servais L, Kim J, Narod SA, Akbari MR, Vadaparampil ST. A high frequency of BRCA mutations in young black women with breast cancer residing in Florida. Cancer. 2015; 121(23):4173-80. doi:10.1002/cncr.29645. Epub 2015 Aug 19.
3. Bardia A, Baselga J. Neoadjuvant therapy as a platform for drug development and approval in breast cancer. Clin Cancer Res. 2013;19(23):6360–70.
4. Prowell TM, Pazdur R. Pathological complete response and accelerated drug approval in early breast cancer. N Engl J Med. 2012;366(26):2438–41. 5. Cortazar P, Zhang L, Untch M, Mehta K, Costantino JP, Wolmark N, Bonnefoi
H, Cameron D, Gianni L, Valagussa P, et al. Pathological complete response and long-term clinical benefit in breast cancer: the CTNeoBC pooled analysis. Lancet. 2014;384(9938):164–72.
6. Balko JM, Giltnane JM, Wang K, Schwarz LJ, Young CD, Cook RS, Owens P, Sanders ME, Kuba MG, Sanchez V, et al. Molecular profiling of the residual disease of triple-negative breast cancers after neoadjuvant chemotherapy identifies actionable therapeutic targets. Cancer Discov. 2014;4(2):232–45. 7. Garcia-Murillas I, Schiavon G, Weigelt B, Ng C, Hrebien S, Cutts RJ, Cheang
M, Osin P, Nerurkar A, Kozarewa I, et al. Mutation tracking in circulating tumor DNA predicts relapse in early breast cancer. Sci Transl Med. 2015; 7(302):302ra133.
8. Li S, Kennedy M, Payne S, Kennedy K, Seewaldt VL, Pizzo SV, Bachelder RE. Model of tumor dormancy/recurrence after short-term chemotherapy. PLoS One. 2014;9(5):e98021.
9. Malanchi I, Santamaria-Martinez A, Susanto E, Peng H, Lehr HA, Delaloye JF, Huelsken J. Interactions between cancer stem cells and their niche govern metastatic colonization. Nature. 2012;481(7379):85–9.
10. Dey-Guha I, Alves CP, Yeh AC, Salony, Sole X, Darp R, Ramaswamy S. A mechanism for asymmetric cell division resulting in proliferative asynchronicity. Mol Cancer Res. 2015;13(2):223–30.
12. Salony, Sole X, Alves CP, Dey-Guha I, Ritsma L, Boukhali M, Lee JH, Chowdhury J, Ross KN, Haas W, et al. AKT inhibition promotes nonautonomous cancer cell survival. Mol Cancer Ther. 2016;15(1):142–53. 13. Facompre ND, Harmeyer KM, Sole X, Kabraji S, Belden Z, Sahu V, Whelan K,
Tanaka K, Weinstein GS, Montone KT et al. JARID1B enables transit between distinct states of the stem-like cell population in oral cancers. Cancer Res. 2016. 14. Carvajal-Hausdorf DE, Schalper KA, Neumeister VM, Rimm DL. Quantitative
measurement of cancer tissue biomarkers in the lab and in the clinic. Lab Invest. 2015;95(4):385–96.
15. McLaughlin J, Han G, Schalper KA, Carvajal-Hausdorf D, Pelekanou V, Rehman J, Velcheti V, Herbst R, LoRusso P, Rimm DL. Quantitative assessment of the heterogeneity of PD-L1 expression in non-small-cell lung cancer. JAMA Oncol. 2016;2(1):46–54.
16. Camp RL, Chung GG, Rimm DL. Automated subcellular localization and quantification of protein expression in tissue microarrays. Nat Med. 2002;8(11):1323–7.
17. Neumeister V, Agarwal S, Bordeaux J, Camp RL, Rimm DL. In situ identification of putative cancer stem cells by multiplexing ALDH1, CD44, and cytokeratin identifies breast cancer patients with poor prognosis. Am J Pathol. 2010;176(5):2131–8.
18. Stack EC, Wang C, Roman KA, Hoyt CC. Multiplexed
immunohistochemistry, imaging, and quantitation: a review, with an assessment of Tyramide signal amplification, multispectral imaging and multiplex analysis. Methods. 2014;70(1):46–58.
19. Bossuyt V, Provenzano E, Symmans WF, Boughey JC, Coles C, Curigliano G, Dixon JM, Esserman LJ, Fastner G, Kuehn T, et al. Recommendations for standardized pathological characterization of residual disease for neoadjuvant clinical trials of breast cancer by the BIG-NABCG collaboration. Ann Oncol. 2015;26(7):1280–91.
20. abcam: Data Sheet Anti-Histone H3 (di methyl K9) [mAbcam 1220] - ChIP Grade (ab1220). 2016. http://www.abcam.com/histone-h3-di-methyl-k9-antibody-mabcam-1220-chip-grade-ab1220.html
21. Cell Signaling Technology. Data Sheet Akt (pan) (C67E7) Rabbit mAb. In.: Cell Signaling Technology; 2016. https://www.cellsignal.com/products/ primary-antibodies/akt-pan-c67e7-rabbit-mab/4691
22. Guo L, Chen H, Li Y, Zhou Q, Sui Y. An aquaporin 3-notch1 axis in keratinocyte differentiation and inflammation. PLoS One. 2013;8(11):e80179. 23. Yao M, Liu Y, Jin H, Liu X, Lv K, Wei H, Du C, Wang S, Wei B, Fu P.
Prognostic value of preoperative inflammatory markers in Chinese patients with breast cancer. Onco Targets Ther. 2014;7:1743–52.
24. Denkert C, Budczies J, von Minckwitz G, Wienert S, Loibl S, Klauschen F. Strategies for developing Ki67 as a useful biomarker in breast cancer. Breast. 2015;24 Suppl 2:S67–72.
• We accept pre-submission inquiries
• Our selector tool helps you to find the most relevant journal • We provide round the clock customer support
• Convenient online submission • Thorough peer review
• Inclusion in PubMed and all major indexing services • Maximum visibility for your research
Submit your manuscript at www.biomedcentral.com/submit