RESEARCH NOTE
PMA: Protein Microarray Analyser,
a user-friendly tool for data processing
and normalization
Jessica Da Gama Duarte
1,2*, Ryan W. Goosen
1, Peter J. Lawry
3and Jonathan M. Blackburn
1,4Abstract
Objective: Protein microarrays provide a high-throughput platform to measure protein interactions and associated functions, and can aid in the discovery of cancer biomarkers. The resulting protein microarray data can however be subject to systematic bias and noise, thus requiring a robust data processing, normalization and analysis pipeline to ensure high quality and robust results. To date, a comprehensive data processing pipeline is yet to be developed. Fur-thermore, a lack of analysis consistency is evident amongst different research groups, thereby impeding collaborative data consolidation and comparison. Thus, we sought to develop an accessible data processing tool using methods that are generalizable to the protein microarray field and which can be adapted to individual array layouts with mini-mal software engineering expertise.
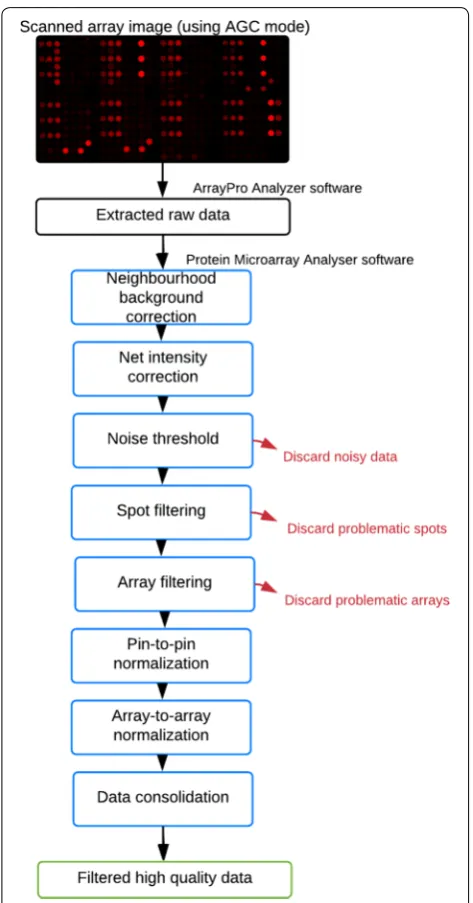
Results: We developed an improved version of a previously developed pipeline of protein microarray data process-ing and implemented it as an open source software tool, with particular focus on widenprocess-ing its use and applicability. The Protein Microarray Analyser software presented here includes the following tools: (1) neighbourhood background correction, (2) net intensity correction, (3) user-defined noise threshold, (4) user-defined CV threshold amongst replicates and (5) assay controls, (6) composite ‘pin-to-pin’ normalization amongst sub-arrays, and (7) ‘array-to-array’ normalization amongst whole arrays.
Keywords: Protein microarrays, Protein Microarray Analyser, PMA
© The Author(s) 2018. This article is distributed under the terms of the Creative Commons Attribution 4.0 International License (http://creat iveco mmons .org/licen ses/by/4.0/), which permits unrestricted use, distribution, and reproduction in any medium, provided you give appropriate credit to the original author(s) and the source, provide a link to the Creative Commons license, and indicate if changes were made. The Creative Commons Public Domain Dedication waiver (http://creat iveco mmons .org/ publi cdoma in/zero/1.0/) applies to the data made available in this article, unless otherwise stated.
Introduction
Protein microarrays are a high-throughput technology that can measure protein interactions and associated functions, with potential uses in cancer biomarker dis-covery [1–14]. We have previously developed a custom cancer-specific protein array which measures antigen-specific antibodies present in patient blood [15, 16]. These are quantified using fluorescently-labelled anti-human IgG antibodies and a microarray scanner [17]. However, the resulting data can be subject to system-atic bias and noise, and robust data processing and nor-malization is required to ensure high quality data. DNA
microarray tools are generally unsuitable for this purpose given the different assay setup, objectives and statisti-cal assumptions used. Although several protein micro-array-specific tools are available [18–25], none of these include a composite suite of methods that we deemed as essential. Furthermore, no consistency is seen amongst research groups, which impedes collaborative data con-solidation and comparison. Thus, we sought to develop a generic protein microarray data processing tool that is readily adaptable to any array layout and should thereby provide valuable new insight in the field by enabling col-laborative data analysis of new and existing datasets.
Main text
‘CT100 Analyser’
Our group has previously developed ‘CT100 Analyser’ [17], which included the following methods:
Open Access
*Correspondence: [email protected]
1 Department of Integrative Biomedical Sciences & Institute for Infectious Disease and Molecular Medicine, Faculty of Health Sciences, University of Cape Town, Cape Town, South Africa
Neighbourhood background correction
Net intensities are usually calculated by subtracting local background intensities from raw intensities. How-ever, printing, assay and handling artefacts may lead to artificially increased local background intensities, which thereby skew the calculated net intensities. Local background intensities are replaced with median sur-rounding neighbourhood corrected intensities accord-ing to Zhu et al. [24].
Corrected net intensity
Net intensities are recalculated by subtracting the cor-rected background intensity from the raw intensity for each spot.
Noise threshold
Non-specific binding can result in background noise that affects antigen-specific net intensity calculations. In addition to experimental methods for reducing noise during array fabrication and assay, a noise threshold can be applied to remove all intensities that are not sig-nificantly above background. All spots containing a cor-rected net intensity of less than two standard deviations of the background are deemed “NOISY” and excluded.
Spot filtering
Antigens, positive controls and negative controls are expected to be present at least in triplicate on the array, as a means of assuring that the obtained data is reliable and equally detected across spatially distinct locations. At times, data is not consistent across spot replicas, and the resulting mean net intensity may not be indica-tive of the true signal. Therefore, after calculating the mean for each set of spot replicas, the coefficient of variation (CV) across these replicas is also calculated. If the obtained CV is above 20% (user-defined), the mean net intensity is deemed “HIGH CV” and excluded.
Saturation occurs when the fluorescent intensity detected surpasses the scanner’s reading capacity, and as a result, this maximum value is reported alongside information regarding the percentage of pixels within the spot of interest that are saturated. To assure that all intensities reported are reliable, all spots that show saturation above 10% are deemed “SATU RAT ED”, and the array flagged for rescanning at a lower PMT gain setting.
Array filtering for a selected positive control
Positive controls are essential in all protein microar-rays and can be used for the implementation of data filtering and normalization methods. Replicas of these controls should be well distributed across the entire
array surface. At times, slide coating, sample loading or printing issues can arise and affect spot homogene-ity and size. To investigate whether array printing was up to the expected standard, CVs of a selected positive control are calculated for each array across all replicas. If an array’s CV is above 20%, this array is excluded and flagged as a required repeat.
‘Pin‑to‑pin’ and ‘array‑to‑array’ normalization
To enhance assay throughput, multiple replica arrays can be printed across a single slide. However, the usage of multiple pins/nozzles and the replica printing action can lead to slight variations. Moreover, differences in micro-array scanner PMT gain settings can complicate data comparison between arrays or datasets. Therefore, data normalization is essential to account for these variations. The above mentioned positive control spatially dispersed replicas are used for this purpose. The functionality of this method requires these controls to be in the defined static location and at three different concentrations. We have implemented a composite normalization method combining quantile normalization and total intensity normalization modules [26–28]. With this method, individual blocks within each array are normalized with respect to each other to minimize any effects of ‘pin-to-pin’ variation, and whole arrays are then normalized with respect to each other to minimize any effects of ‘array-to-array’ variation. This normalization method only uses data points and arrays that have not been flagged or dis-carded by prior methods.
Data consolidation
After processing all raw data files with ‘CT100 Analyser’ an output folder is generated. The final resulting data files are consolidated into a single file, where each column represents a single array, and each row a single antigen/ control. Each data point corresponds to the mean net intensity of all valid replicas for each sample. Addition-ally, flagged and discarded folders are generated contain-ing all problematic data.
PMA—Protein Microarray Analyser
Extensive use of ‘CT100 Analyser’ highlighted opportu-nities for further improvement and generalisation, which we have now addressed. The following methods were included:
Slide scanning using the automatic gain control (AGC) mode
spots and rescan slides. PMA thus now allows for scan-ning arrays using the AGC mode. However, it is impor-tant to note that when using this setting, subsequent data normalization is critical.
A user‑defined antigen layout and list (.gal file)
After scanning, users create or input a.gal file accord-ing to the specific array layout and antigen list to enable adequate data extraction. The functionality of ‘CT100 Analyser’ was restricted to a fixed.gal file and any modi-fications to the array layout required adaptation of this tool accordingly. Since different arrays have different con-tent and layouts, we therefore sought to make the soft-ware dynamic and applicable to any antigen layout, while maintaining the same use of positive and negative con-trols. PMA now enables processing of raw data extracted with a user-defined.gal file, as long as this file is included in the program folder. Currently implemented meth-ods in PMA require the inclusion of specific, statically-defined positive and negative controls to ensure their correct functionality in subsequent quality control, slide orientation and signal normalization steps. It is therefore important to note this when adapting this source code to an alternative array layout.
Additional positive controls (e.g. anti-human IgG and human IgG spots, to confirm respectively the addition of patient serum/plasma and detection antibody) and nega-tive controls (e.g. buffer-only and tag-only, to determine any non-specific immunochemical interactions) are also allowed for in PMA.
A user‑defined adjustable noise threshold
Despite best efforts, the amount of noise detected on protein arrays can be variable across different assay runs. As such, the noise threshold is now user-defined as n
standard deviations of the background.
Array filtering for each positive control
The ‘CT100 Analyser’ previously used positive controls at three distinct concentrations for array filtering and nor-malization purposes, conducting CV calculations and discarding flagged arrays using the user-defined concen-tration of positive controls. However, it was previously necessary to test this function across all three concen-trations of positive controls, requiring the user to con-duct three separate analyses, each generating a different final consolidated data file. The improved PMA software applies this method using all three different concentra-tions of positive controls, but proceeds with the process-ing pipeline usprocess-ing the user-selected control. This ensures that the user is informed of which control is best for this
purpose, and also highlights any potential printing con-cerns that may not have been apparent previously.
An improved mean net intensity calculation
After all methods have been applied, replica spots for each antigen or control are averaged, and a mean net intensity is reported. However, a mean isn’t reported in two instances—when one of the replicas is “NOISY” (intensity below the user-defined noise threshold) or when the mean is “HIGH CV” (CV of the replicas above the user-defined percentage). This mean calculation has now been improved to avoid losing valid data when only one of the three replicas is problematic. Specifically, the mean is calculated when two or three of the replicas are available and distributed with low-variance (outlier repli-cas excluded). As a result, skewed means are avoided and fewer data points are unnecessarily discarded from the analysis.
A user‑friendly output folder
The ‘CT100 Analyser’ output contained an excessive amount of information that was not user-friendly. We have improved the content of this output folder by only including the processed files that are relevant for down-stream data analysis. These include the final consolidated replica and averaged data for all arrays after applica-tion of all methods and the list of discarded arrays that require repetition. Additionally, this folder is dated and timed and includes a record of the used settings. Verbose processing output may also be viewed when executing the PMA program via the command line when additional information is required.
Implementation
PMA is a desktop-based offline Java tool that supports. txt file formats, which are the standard protein microar-ray image acquisition and analysis software output.
Running the software
PMA includes: (1) neighbourhood background correc-tion, (2) net intensity correccorrec-tion, (3) user-defined noise threshold, (4) user-defined replicate and (5) control CV threshold, (6) composite ‘pin-to-pin’ and (7) ‘array-to-array’ normalization (Fig. 1).
option. The default settings are based on previously pub-lished array layouts and as such should be reviewed and adjusted accordingly. After submitting the user-defined settings, the next interface lists the methods to be run
on the dataset, after which the analysis is initiated and a results folder is generated.
After the software run
The results folder is automatically named with the date and time of the run, and includes two consolidated files. These tab-delimited files include the final RFU values across arrays with all replicas (ProteinMicroarrayAna-lyser.AllAntigenReplicateValues.txt) or single averages (ProteinMicroarrayAnalyser.consolidated.txt).
Four separate tab-delimited CV evaluation files may also be included in this results folder. These are gener-ated using low (listOfArraysToDiscard.low.txt), medium (listOfArraysToDiscard.med.txt), high (listOfArraysTo-Discard.high.txt) or the selected (listOfArraysToDiscard. overall.txt) positive controls. These include lists of arrays that have failed the user-defined CV threshold with that particular control, and thus require repetition.
The debug output enables users to obtain specific details of each array processed, if required. Manual vis-ualization of all scanned arrays is recommended and should assess spot-to-spot variation, spot homogeneity, background variation, signal-to-noise ratio and saturated pixels [17].
Data analysis
The file used for analysis is the average consolidated file, and can be viewed using a spreadsheet or text edi-tor. Rows correspond to antigens, columns to arrays, and array names to raw file location. Data points con-sist of RFU values, or the terms “NOISY” or “HIGH CV”. “NOISY” data should be set to zero and “HIGH CV” anti-gens excluded from analysis. A worked example demon-strates the implementation of this tool in more detail (see Additional files 1, 2).
There are a large number of readily available down-stream data analysis tools that can be used on protein microarray data, and as such we did not include these. Tool selection should depend on the analysed cohort and research question.
Limitations
PMA functionality requires specific positive and nega-tive controls in a defined static location, does not permit individual method usage or include subsequent statistical data analysis methods.
[image:4.595.56.293.85.537.2]Abbreviations
PMA: Protein Microarray Analyser; AGC : automatic gain control; CV: coefficient of variation; PMT: photomultiplier tube; RFU: relative fluorescence units; SD: standard deviation.
Authors’ contributions
JD and JB were responsible for overall project design and for detailing the algorithms that together make up the PMA program. RG provided software engineering expertise to implement the majority of the PMA program associ-ated with this paper (see Acknowledgements for prior software engineer-ing contributions). JD and RG conducted program testengineer-ing and refinement together. JD, RG and PL prepared the PMA source code for release. JD wrote the manuscript and RG and JB reviewed and edited. All authors read and approved the final manuscript.
Author details
1 Department of Integrative Biomedical Sciences & Institute for Infectious Dis-ease and Molecular Medicine, Faculty of Health Sciences, University of Cape Town, Cape Town, South Africa. 2 Present Address: Tumour Immunology Laboratory, Olivia Newton-John Cancer Research Institute/School of Cancer Medicine, La Trobe University, Level 5, ONJCWC, 145 Studley Road, Heidelberg, VIC 3084, Australia. 3 Present Address: Olivia Newton-John Cancer Research Institute/School of Cancer Medicine, La Trobe University, Level 5, ONJCWC, 145 Studley Road, Heidelberg, VIC 3084, Australia. 4 Present Address: Blackburn Laboratory, N3.03, Wernher & Beit Building North, Institute of Infectious Additional files
Additional file 1. A worked example of Protein Microarray Analyser. This example includes a step-by-step description using a real dataset gener-ated with our custom protein array.
Additional file 2. Protein Microarray Analyser source code archive. This archive includes the Protein Microarray Analyser source code, the execut-able jar file, the default settings, and the necessary (raw data folder, .gal file) and generated (results folder) files for a worked example.
Disease & Molecular Medicine, UCT Faculty of Health Sciences, Observatory, Cape Town 7925, South Africa.
Acknowledgements
We thank Jean-Michel Serufuri for his role in developing the original ‘CT100 Analyser’.
Competing interests
The authors declare that they have no competing interests.
Availability of data and materials
Project name: PMA—Protein Microarray Analyser.
Project home page: https ://sourc eforg e.net/proje cts/prote in-micro array -analy ser/.
Operating system: Platform independent. Programming language: Java.
Other requirements: Java 6 or higher.
License: No license is needed—software is available open source. Any restrictions to use by non-academics: None.
Consent for publication
Not applicable.
Ethics approval and consent to participate
Not applicable.
Funding
J.D. and R.G. were supported by the University of Cape Town, Marion Beatrice Waddel Foundation and the National Research Foundation. J.B. is supported by a South African National Research Foundation Research Chair Grant.
Publisher’s Note
Springer Nature remains neutral with regard to jurisdictional claims in pub-lished maps and institutional affiliations.
Received: 10 January 2018 Accepted: 22 February 2018
[image:5.595.56.539.87.298.2]• We accept pre-submission inquiries
• Our selector tool helps you to find the most relevant journal
• We provide round the clock customer support
• Convenient online submission
• Thorough peer review
• Inclusion in PubMed and all major indexing services
• Maximum visibility for your research
Submit your manuscript at www.biomedcentral.com/submit
Submit your next manuscript to BioMed Central
and we will help you at every step:
References
1. Berrade L, Garcia AE, Camarero JA. Protein microarrays: novel develop-ments and applications. Pharm Res. 2011;28:1480–99.
2. Blackburn JM, Shoko A. Protein function microarrays for customised systems-oriented proteome analysis. In: Korf U, editor. Methods molecu-lar biology, vol. 785. New York: Humana Press; 2011. p. 305–30. 3. Burel JG, Apte SH, Doolan DL. Systems approaches towards molecular
profiling of human immunity. Trends Immunol. 2015;37:53–67.
4. Cretich M, Damin F, Chiari M. Protein microarray technology: how far off is routine diagnostics? Analyst. 2014;139:528–42.
5. Glökler J, Angenendt P. Protein and antibody microarray technology. J Chromatogr B Analyt Technol Biomed Life Sci. 2003;797:229–40. 6. Hartmann M, Roeraade J, Stoll D, Templin MF, Joos TO. Protein microarrays
for diagnostic assays. Anal Bioanal Chem. 2009;393:1407–16. 7. Hultschig C, Kreutzberger J, Seitz H, Konthur Z, Bussow K, Lehrach
H. Recent advances of protein microarrays. Curr Opin Chem Biol. 2006;10:4–10.
8. Matarraz S, María MG, Alberto J, Manuel O. New technologies in cancer. Protein microarrays for biomarker discovery. Clin Transl Oncol. 2011;13:156–61.
9. Moore CD, Ajala OZ, Zhu H. Applications in high-content functional protein microarrays. Curr Opin Chem Biol. 2016;30:21–7.
10. O’Kane SL, O’Brien JK, Cahill DJ. Optimized autoantibody profiling on protein arrays. In: Korf U, editor. Methods Molecular Biology, vol. 785. New York: Humana Press; 2011. p. 331–41.
11. Pollard HB, Srivastava M, Eidelman O, Jozwik C, Rothwell SW, Mueller GP, et al. Protein microarray platforms for clinical proteomics. Proteomics Clin Appl. 2007;1:934–52.
12. Zaenker P, Ziman MR. Serologic autoantibodies as diagnostic cancer bio-markers—a review. Cancer Epidemiol Biomarkers Prev. 2013;22:2161–81. 13. Zhang H, Pelech S. Protein microarrays and their potential clinical
applica-tions in the era of personalized medicine. In: Jordan B, editor. personal-ized medicine. Berlin: Springer; 2012. p. 55–80.
14. Duarte JG, Blackburn JM. Advances in the development of human pro-tein microarrays. Expert Rev Proteomics. 2017;14:627–41.
15. Beeton-Kempen N, Duarte J, Shoko A, Serufuri JM, John T, Cebon J, et al. Development of a novel, quantitative protein microarray platform for the multiplexed serological analysis of autoantibodies to cancer-testis antigens. Int J Cancer. 2014;135:1842–51.
16. Adeola HA, Smith M, Kaestner L, Blackburn JM, Zerbini LF. Novel potential serological prostate cancer biomarkers using CT100 + cancer antigen microarray platform in a multi-cultural south african cohort. Oncotarget. 2016;7:13945–64.
17. Duarte J, Serufuri J-M, Mulder N, Blackburn J. Protein function micro-arrays: design, use and bioinformatic analysis in cancer biomarker discovery and quantitation. Bioinform Hum Proteomics Transl Bioinform. 2013;3:39–74.
18. Deluca DS, Marina O, Ray S, Zhang GL, Wu CJ, Brusic V. Data processing and analysis for protein microarrays. Methods Mol Biol. 2011;723:337–47. 19. Díez P, Dasilva N, González-González M, Matarraz S, Casado-Vela J, Orfao
A, et al. Data analysis strategies for protein microarrays. Microarrays. 2012;1:64–83.
20. Lubomirski M, D’Andrea MR, Belkowski SM, Cabrera J, Dixon JM, Amaratunga D. A consolidated approach to analyzing data from high-throughput protein microarrays with an application to immune response profiling in humans. J Comput Biol. 2007;14:350–9.
21. Marina O, Biernacki MA, Brusic V, Wu CJ. A concentration-dependent analysis method for high density protein microarrays. J Proteome Res. 2008;7:2059–68.
22. Saal LH, Troein C, Vallon-Christersson J, Gruvberger S, Borg A, Peterson C. BioArray Software Environment (BASE): a platform for compre-hensive management and analysis of microarray data. Genome Biol. 2002;3:SOFTWARE0003.
23. White AM, Daly DS, Varnum SM, Anderson KK, Bollinger N, Zangar RC. ProMAT: protein microarray analysis tool. Bioinformatics. 2006;22:1278–9. 24. Zhu X, Gerstein M, Snyder M. ProCAT: a data analysis approach for protein
microarrays. Genome Biol. 2006;7:R110.
25. Brezina S, Soldo R, Kreuzhuber R, Hofer P, Gsur A, Weinhaeusel A. Immune-signatures for lung cancer diagnostics: evaluation of protein microarray data normalization strategies. Microarrays. 2015;4:162–87. 26. Causton HC, Quackenbush J, Brazma A. Microarray gene expression data
analysis: a beginners guide. Yeast. Hoboken: Blackwell Publishing; 2004. 27. Bolstad BM, Irizarry RA, Astrand M, Speed TP. A comparison of
normali-zation methods for high density oligonucleotide array data based on variance and bias. Bioinformatics. 2003;19:185–93.