Open Access
Vol 9 No 5Research article
Recent changes in breast cancer incidence and risk factor
prevalence in San Francisco Bay area and California women: 1988
to 2004
Theresa HM Keegan
1,2, Ellen T Chang
1,2, Esther M John
1,2, Pamela L Horn-Ross
1,2,
Margaret R Wrensch
3, Sally L Glaser
1,2and Christina A Clarke
1,21Northern California Cancer Center, 2201 Walnut Ave., Suite 300, Fremont, CA 94538, USA
2Division of Epidemiology, Department of Health Research and Policy, HRP Redwood Building, Stanford University School of Medicine, Stanford, CA 94305-5405, USA
3Departments of Neurological Surgery and Epidemiology and Biostatistics, University of California at San Francisco, 44 Page Street, Suite 503, San Francisco, CA 94102, USA
Corresponding author: Theresa HM Keegan, tkeegan@nccc.org
Received: 14 Jun 2007 Revisions requested: 31 Jul 2007 Revisions received: 17 Aug 2007 Accepted: 25 Sep 2007 Published: 25 Sep 2007
Breast Cancer Research 2007, 9:R62 (doi:10.1186/bcr1768)
This article is online at: http://breast-cancer-research.com/content/9/5/R62 © 2007 Keegan et al.; licensee BioMed Central Ltd.
This is an open access article distributed under the terms of the Creative Commons Attribution License (http://creativecommons.org/licenses/by/2.0), which permits unrestricted use, distribution, and reproduction in any medium, provided the original work is properly cited.
Abstract
Introduction Historically, the incidence rate of breast cancer among non-Hispanic white women living in the San Francisco Bay area (SFBA) of California has been among the highest in the world. Substantial declines in breast cancer incidence rates have been documented in the United States and elsewhere during recent years. In light of these reports, we examined recent changes in breast cancer incidence and risk factor prevalence among non-Hispanic white women in the SFBA and other regions of California.
Methods Annual age-adjusted breast cancer incidence and mortality rates (1988 to 2004) were obtained from the California Cancer Registry and analyzed using Joinpoint regression. Population-based risk factor prevalences were calculated using two data sources: control subjects from four case-control studies (1989 to 1999) and the 2001 and 2003 California Health Interview Surveys.
Results In the SFBA, incidence rates of invasive breast cancer increased 1.3% per year (95% confidence interval [CI], 0.7% to 2.0%) in 1988–1999 and decreased 3.6% per year (95% CI, 1.6% to 5.6%) in 1999–2004. In other regions of California, incidence rates of invasive breast cancer increased 0.8% per
year (95% CI, 0.4% to 1.1%) in 1988–2001 and decreased 4.4% per year (95% CI, 1.4% to 7.3%) in 2001–2004. In both regions, recent (2000–2001 to 2003–2004) decreases in invasive breast cancer occurred only in women 40 years old or older and in women with all histologic subtypes and tumor sizes, hormone receptor-defined types, and all stages except distant disease. Mortality rates declined 2.2% per year (95% CI, 1.8% to 2.6%) from 1988 to 2004 in the SFBA and the rest of California. Use of estrogen-progestin hormone therapy decreased significantly from 2001 to 2003 in both regions. In 2003–2004, invasive breast cancer incidence remained higher (4.2%) in the SFBA than in the rest of California, consistent with the higher distributions of many established risk factors, including advanced education, nulliparity, late age at first birth, and alcohol consumption.
Conclusion Ongoing surveillance of breast cancer occurrence patterns in this high-risk population informs breast cancer etiology through comparison of trends with lower-risk populations and by highlighting the importance of examining how broad migration patterns influence the geographic distribution of risk factors.
Introduction
A striking feature of breast cancer epidemiology is its geo-graphic variation in occurrence, with differences in invasive breast cancer incidence as high as 10-fold internationally [1]
and two-fold among counties within the US [2]. At the highest end of these spectrums are incidence rates for non-Hispanic white women living in the San Francisco Bay area (SFBA) of California. Recently reported rates for this population were
higher than those for other populations worldwide [1]. Rates have been reported to be further elevated among women in the small SFBA county of Marin, and these findings have received substantial public and scientific attention [3-5].
Prior studies have suggested that most [6,7], if not all [5,8], geographic variation in US breast cancer incidence relates to differences in the prevalence in women of established risk fac-tors for breast cancer, including older age, non-Hispanic white race/ethnicity, US birthplace, low- or nulli-parity, late age at first birth, moderate to high consumption of alcohol, late age at menopause, and use of hormone therapy (HT). Many of these risk factors correlate with higher levels of education, income, and other metrics of socioeconomic status, which census data confirm to be more concentrated among SFBA residents, par-ticularly non-Hispanic white women [9]. On this basis, it has been hypothesized that the elevated incidence of breast can-cer in the SFBA may be largely attributable to the high preva-lence in women of known breast cancer risk factors as opposed to geographically or environmentally unique features of the SFBA. However, to date, there have been few efforts to systematically document and compare specific risk factor prevalences in non-Hispanic white women in the SFBA with those in other populations [5,8].
With the recent and widely publicized changes in breast can-cer incidence rates in this region (declines of 10% to 11% between 2001 and 2004 [10]) and elsewhere [11-13], the aim of this study is to determine whether incidence and mor-tality trends are correlated with changes in the population-level prevalence of breast cancer risk factors. In particular, HT use dropped substantially (60% to 70%) among middle-aged SFBA women [10] and in other populations [11,12] after the 2002 announcement by the Women's Health Initiative (WHI) that estrogen-progestin therapy increased the risk of breast cancer and heart disease [14]. A deeper understanding of detailed breast cancer incidence and risk factor prevalence patterns, particularly for distinct tumor subtypes, in this popu-lation at the high end of the international incidence spectrum can further inform the basis of geographic incidence variation, especially for years after the WHI announcement, and may offer important opportunities to generate new hypotheses about the etiology and possible prevention of breast cancer. With these goals in mind, we present risk factor prevalence data and the most current breast cancer incidence rates for the SFBA and the rest of California.
Materials and methods
Breast cancer incidence data
Breast cancer incidence and mortality data for non-Hispanic white females were obtained from the California Cancer Reg-istry, October 2006 submission, for the period 1 January 1988 to 31 December 2004 and for white females (Hispanics and non-Hispanics) from the Surveillance, Epidemiology, and End Results (SEER) program of the National Cancer Institute (NCI)
for the period 1 January 1973 to 31 December 2003 – the most recent year for which cancer data were complete at the time of this analysis. Analyses were based on incident cases of breast cancer (International Classification of Diseases-Oncology, 3rd edition [15] [ICD-O-3] site codes 50.0 to 50.9) occurring in six counties of the SEER and California Cancer Registry San Francisco/Oakland and San Jose/Monterey catchment regions (Alameda, Contra Costa, Marin, San Fran-cisco, San Mateo, and Santa Clara counties), the rest of Cali-fornia, and the other eight original SEER regions (Connecticut, Detroit, Hawaii, Iowa, New Mexico, Seattle, Utah, and Atlanta). The populations of the six SFBA counties and the rest of Cal-ifornia were 5,806,325 and 28,065,323, respectively. ICD-O-3 histology codes were used to distinguish the ductal (8500) and 'with lobular component' (8520, 8522, and 8524) histo-logic subtypes from other subtypes of breast cancer. Stage of disease at diagnosis was categorized as localized, regional, distant, or unstaged/not available. Tumor size was categorized into less than 2 cm and greater than or equal to 2 cm, and tumor marker variables were used to define estrogen receptor (ER) and progesterone receptor status as positive (+), nega-tive (-), or missing. As receptor status was not reportable to SEER until 1990, trends by receptor status are limited to the period 1992–2004 due to higher completeness of the data [16-20]. From 1992 to 2004, hormone receptor status was missing for 16.9% of tumors in the SFBA and 29.2% of tumors in the rest of California; the percentage of missing hormone receptor status data decreased from 1992 to 1998 and was fairly stable after that time. Although we did not impute recep-tor status (as one prior study did [12]), the percentage of miss-ing hormone receptor data did not vary from the period 2000– 2001 to 2003–2004.
The analyses presented in Figure 1 are based on all white women, both Hispanic and non-Hispanic, because ethnicity cannot be distinguished in the nine SEER regions for 1973– 2003. All other analyses reported in this paper are restricted to non-Hispanic white women. Registry data on race/ethnicity are based on medical record information [21]. Population denominators were based on US Census Bureau estimates that were 'race-bridged' (that is, persons reporting two or more races in the 2000 census were allocated to a single race for comparability with prior census data) [22].
Breast cancer risk factor prevalence estimates
case-control studies: (a) Marin County Breast Cancer Study of Adolescent Risk Factors, which collected information up to 1 year prior to the selection dates, 1997 to 1999, from 297 con-trols who were residents of Marin County and who did not have a history of breast cancer [23]; (b) the San Francisco Bay Area Breast Cancer Study, which collected information up to 1 year prior to the selection dates, 1996 to 2000, from 564 controls who were residents of Alameda, Contra Costa, San Francisco, San Mateo, and Santa Clara counties and who did not have a history of breast cancer [24]; (c) Reproductive Fac-tors in Hodgkin Lymphoma (HL) in Women, which collected information up to 1 year prior to the selection dates, 1990 to 1996, from 102 controls who were residents of Alameda, Contra Costa, Marin, Monterey, San Benito, San Francisco, San Mateo, Santa Clara, and Santa Cruz counties and who did not have a history of HL at interview [25]; women with a history of breast cancer at interview were excluded from the present analysis; and (d) the Bay Area Thyroid Cancer Study, which collected information up to 1 year prior to the selection dates, 1995 to 1998, from 205 controls who were residents of Alameda, Contra Costa, Santa Clara, San Francisco, and San Mateo counties and who did not have a history of thyroid
can-cer [26]; women with a history of breast cancan-cer at interview were excluded from the present analysis. Response rates in the CHIS were 37.7% in 2001 [27] and 33.5% in 2003 [28] and were weighted to account for under-coverage and non-response biases [29]; non-response rates among controls in the population-based case-control studies ranged from 70% to 93% [23-26].
Breast cancer risk factors included in this study have been associated with breast cancer in prior studies [30] and either were available in the 2001 and/or 2003 CHIS or were assessed similarly in the four case-control studies. These fac-tors included highest educational level attained, age at menarche (years), age at first live birth (years), number of live births, use of HT (ever, current, and duration in years), high alcohol consumption (two or more drinks per day in the past month), no vigorous or moderate physical activity in the past 30 days, and body mass index (BMI) (weight [kg]/height [m]2)
[image:3.612.61.554.90.423.2]stratified by age group (less than 50 years or greater than or equal to 50 years).
Figure 1
Trends in invasive breast cancer incidence and mortality rates among non-Hispanic and Hispanic white females in the San Francisco Bay area (䉬) and other Surveillance, Epidemiology, and End Results (SEER) regions (o), 1973–2003
Trends in invasive breast cancer incidence and mortality rates among non-Hispanic and Hispanic white females in the San Francisco Bay area (䉬) and other Surveillance, Epidemiology, and End Results (SEER) regions (o), 1973–2003.
0
20
40
60
80
100
120
140
160
180
1973
1975
1977
1979
19
81
19
83
19
85
1987
1989
199
1
199
3
199
5
1997
1999
200
1
200
3
Year
Rat
e p
e
r 100,000
Incidence
Statistical analysis
Cancer incidence rates
SEER*Stat software [31] was used to compute average annual breast cancer rates age-adjusted to the 2000 US standard million population, associated standard errors and 95% confidence intervals, and annual percent changes (APCs). Age-adjusted rates were compared statistically using a Wald chi-square test of the difference between two rates [32], with p values of less than 0.05 considered significantly different. APCs across the period 1988 to 2004 were calcu-lated by fitting a least squares regression line to the natural logarithm of the rates as the outcome variable, with calendar year as the predictor variable [33]. Time trends were analyzed using the NCI's Joinpoint software [34].
Risk factor prevalence
Prevalence estimates from the population-based controls were age-adjusted to the 2000 US standard million population using SAS version 9 software (SAS Institute Inc., Cary, NC, USA). Age-adjusted prevalence estimates from the 2001 and 2003 CHISs were obtained from the internet-based AskCHIS application. CHIS data are weighted to the California Depart-ment of Finance estimates of the number of residents in each California county by age, race, and gender and the 2000 Cen-sus of Population counts from the US CenCen-sus Bureau [35]. When the California and US census populations for non-His-panic white women between 35 and 74 years of age were compared, the distributions were found to be similar (data not shown). The institutional review board of the Northern Califor-nia Cancer Center approved this project.
Results
In white women (Hispanic and non-Hispanic), incidence rates of invasive breast cancer in the SFBA have been consistently higher than rates in other regions since the inception of con-tinuous cancer surveillance by the SEER program in 1973 (Figure 1). The rates of both breast cancer in situ and invasive breast cancer were higher in non-Hispanic white women in the SFBA than in non-Hispanic white women in the rest of Califor-nia (Figure 2). The APCs for breast cancer incidence and mor-tality rates are presented for each time period in Table 1. Invasive breast cancer incidence peaked in 1999 in the SFBA and in 2001 in the rest of California before declining (Figure 2; Table 1). Similar patterns in the incidence rate of invasive breast cancer occurred in most disease subgroups studied, including women 40 years old or older, all histologic subtypes, ER+ tumors, localized and regional stage, and all tumor sizes
(Table 1). On the other hand, the incidence rate of invasive breast cancer did not change in women under 40 years of age and, unlike overall incidence patterns, rates of ER-, distant and
unstaged disease, and tumors of unknown size generally decreased over the study period in both regions. For breast cancer in situ, patterns differed, with incidence increases pla-teauing in 1998 in the SFBA but continuing to rise in the rest of California (Figure 2; Table 1). There were no major regional
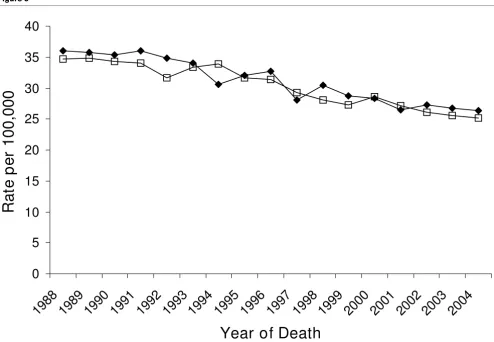
differences in breast cancer mortality trends (Figure 3; Table 1).
From 2000–2001 to 2003–2004, rates of breast cancer in situ and invasive breast cancer incidence significantly decreased in the SFBA and the rest of California, as did mor-tality rates in the non-SFBA regions of California (Table 2). Decreases in invasive incidence rates were evident in most subgroups, except for women under 40 years of age and dis-tant stage of disease at diagnosis in the rest of California. Between these two time periods, the percentage decrease in invasive breast cancer was slightly higher in SFBA women (12.0%) than women in the rest of California (10.9%), as were the decreases in ER+ tumors (14.3%, SFBA; 12.9%, the rest
of California), but not tumors less than 2 cm in diameter (11.6%, SFBA; 12.9%, the rest of California). In 2003–2004, incidence rates of breast cancer in situ and invasive breast cancer remained significantly higher in the SFBA than in the rest of California by 12.5% and 4.2%. (In 2000–2001, rates of breast cancer in situ and invasive breast cancer were 16.7% and 5.5% higher in the SFBA than in the rest of California.)
Compared with non-Hispanic white women in the rest of Cal-ifornia, non-Hispanic white women living in the SFBA were more likely to have graduated from college, to have a BMI below 25 kg/m2 (women under 50 years of age), to have been
physically active in the past 30 days, to have consumed alco-hol in the past month (particularly two or more drinks per day), and to have had their first child after the age of 30 years or to be nulliparous (Table 3). From 2001 to 2003, CHIS data show that the percentage of women who graduated from college significantly increased in the SFBA and that the percentage of women with less than a high school education decreased in the rest of California. (There were no statistically significant changes in the percentages of women with higher levels of education in the rest of California.) Whereas there were no changes in the prevalence of women who drank alcohol in the past month, the prevalence of consumption of two or more alcoholic drinks per day increased among women in the rest of California, but not in the SFBA, between 2001 and 2003.
HT significantly decreased in both regions. According to con-trol data from population-based case-concon-trol studies from 1989–1999 (which are not estimates of combined estrogen and progestin HT use), the prevalence of SFBA women who had ever used HT (44.0%) was higher than that among 2003 CHIS participants in either the SFBA (29.8%) or the rest of California (34.5%).
Discussion
To identify new causes of breast cancer, epidemiological stud-ies should fully characterize and, ideally, maximize the distribution of candidate risk factors in the population under study. With this goal in mind, we examined recent breast can-cer incidence characteristics and trends over a 17-year period in one of the highest-risk populations in the breast cancer
lit-Table 1
Annual percent changes in breast cancer incidence and mortality rates in non-Hispanic white women, 1988–2004. San Francisco Bay area
Annual percent change (95% CI)
The rest of California Annual percent change (95% CI)
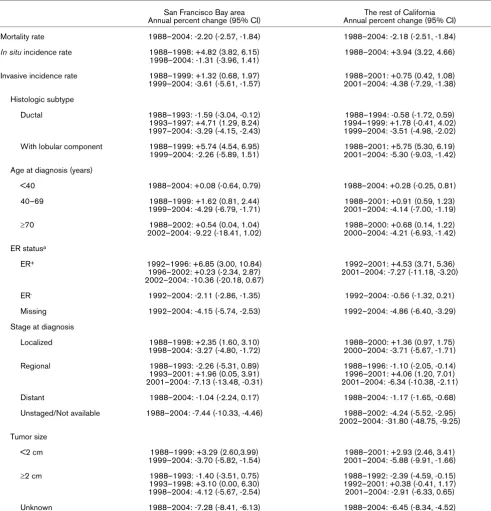
Mortality rate 1988–2004: -2.20 (-2.57, -1.84) 1988–2004: -2.18 (-2.51, -1.84)
In situ incidence rate 1988–1998: +4.82 (3.82, 6.15) 1998–2004: -1.31 (-3.96, 1.41)
1988–2004: +3.94 (3.22, 4.66)
Invasive incidence rate 1988–1999: +1.32 (0.68, 1.97) 1999–2004: -3.61 (-5.61, -1.57)
1988–2001: +0.75 (0.42, 1.08) 2001–2004: -4.38 (-7.29, -1.38)
Histologic subtype
Ductal 1988–1993: -1.59 (-3.04, -0.12)
1993–1997: +4.71 (1.29, 8.24) 1997–2004: -3.29 (-4.15, -2.43)
1988–1994: -0.58 (-1.72, 0.59) 1994–1999: +1.78 (-0.41, 4.02) 1999–2004: -3.51 (-4.98, -2.02)
With lobular component 1988–1999: +5.74 (4.54, 6.95) 1999–2004: -2.26 (-5.89, 1.51)
1988–2001: +5.75 (5.30, 6.19) 2001–2004: -5.30 (-9.03, -1.42)
Age at diagnosis (years)
<40 1988–2004: +0.08 (-0.64, 0.79) 1988–2004: +0.28 (-0.25, 0.81)
40–69 1988–1999: +1.62 (0.81, 2.44)
1999–2004: -4.29 (-6.79, -1.71)
1988–2001: +0.91 (0.59, 1.23) 2001–2004: -4.14 (-7.00, -1.19)
≥70 1988–2002: +0.54 (0.04, 1.04)
2002–2004: -9.22 (-18.41, 1.02)
1988–2000: +0.68 (0.14, 1.22) 2000–2004: -4.21 (-6.93, -1.42)
ER statusa
ER+ 1992–1996: +6.85 (3.00, 10.84)
1996–2002: +0.23 (-2.34, 2.87) 2002–2004: -10.36 (-20.18, 0.67)
1992–2001: +4.53 (3.71, 5.36) 2001–2004: -7.27 (-11.18, -3.20)
ER- 1992–2004: -2.11 (-2.86, -1.35) 1992–2004: -0.56 (-1.32, 0.21)
Missing 1992–2004: -4.15 (-5.74, -2.53) 1992–2004: -4.86 (-6.40, -3.29)
Stage at diagnosis
Localized 1988–1998: +2.35 (1.60, 3.10)
1998–2004: -3.27 (-4.80, -1.72)
1988–2000: +1.36 (0.97, 1.75) 2000–2004: -3.71 (-5.67, -1.71)
Regional 1988–1993: -2.26 (-5.31, 0.89)
1993–2001: +1.96 (0.05, 3.91) 2001–2004: -7.13 (-13.48, -0.31)
1988–1996: -1.10 (-2.05, -0.14) 1996–2001: +4.06 (1.20, 7.01) 2001–2004: -6.34 (-10.38, -2.11)
Distant 1988–2004: -1.04 (-2.24, 0.17) 1988–2004: -1.17 (-1.65, -0.68)
Unstaged/Not available 1988–2004: -7.44 (-10.33, -4.46) 1988–2002: -4.24 (-5.52, -2.95) 2002–2004: -31.80 (-48.75, -9.25)
Tumor size
<2 cm 1988–1999: +3.29 (2.60,3.99)
1999–2004: -3.70 (-5.82, -1.54)
1988–2001: +2.93 (2.46, 3.41) 2001–2004: -5.88 (-9.91, -1.66)
≥2 cm 1988–1993: -1.40 (-3.51, 0.75)
1993–1998: +3.10 (0.00, 6.30) 1998–2004: -4.12 (-5.67, -2.54)
1988–1992: -2.39 (-4.59, -0.15) 1992–2001: +0.38 (-0.41, 1.17) 2001–2004: -2.91 (-6.33, 0.65)
Unknown 1988–2004: -7.28 (-8.41, -6.13) 1988–2004: -6.45 (-8.34, -4.52)
[image:5.612.60.551.114.625.2]erature: non-Hispanic white women in the SFBA. We found that rates of invasive breast cancer increased from 1988 to approximately 1999 and decreased thereafter in women 40 years old or older. From 2000–2001 to 2003–2004, decreases in invasive breast cancer rates also occurred in women with all histologic subtypes, tumor sizes, hormone receptor-defined tumors, and localized and regional disease. A recent analysis in SEER also found decreases in tumors less than 2 cm, hormone receptor-defined tumors, and local and regional disease from 1999/2000 to 2003 [13]. Although sim-ilar trends were observed among non-Hispanic white women in the rest of California in our study, incidence and mortality rates of breast cancer were consistently higher in the SFBA than in the rest of California or in other SEER regions across all time periods. Even after the recent declines in 2003–2004, incidence rates of breast cancer in situ and invasive breast cancer were 12.5% and 4.2% higher, respectively, as com-pared with 16.7% and 5.5% higher in 2000–2001, among SFBA women than among women in the rest of California. Our age-specific incidence trends are similar to recent reports of declines in US [12,13,37,38] and German [11] women.
Contemporaneous population-based data on breast cancer risk factors from CHIS and case-control studies provide fur-ther evidence that in SFBA non-Hispanic white women, fur-there is a higher prevalence of certain breast cancer risk factors [30], including advanced education, lower BMI among women younger than 50 years old, nulliparity, late age at first birth, use of estrogen plus progestin HT in 2001, and alcohol consump-tion, as compared with non-Hispanic white women living in other parts of California. Other breast cancer risk factors, including use of combined estrogen and progestin HT in 2003, physical inactivity, and obesity in women 50 years old or older, were less common in SFBA women or were similar in SFBA women and women in the rest of California and are therefore unlikely to have contributed to the higher incidence rates of breast cancer in the SFBA than in the rest of California.
[image:6.612.62.549.94.435.2]The most notable risk factor changes we observed from 2001 to 2003 were the 76% and 72% relative decreases in the per-centages of women reporting use of combined estrogen and progestin HT in the SFBA and the rest of California, respec-tively. Other risk factors did not appear to change substantially
Figure 2
Trends in breast cancer in situ and invasive breast cancer incidence rates among non-Hispanic white females in the San Francisco Bay area (䉬) and the rest of California (䊐), California Cancer Registry, 1988–2004
Trends in breast cancer in situ and invasive breast cancer incidence rates among non-Hispanic white females in the San Francisco Bay area (䉬) and the rest of California (䊐), California Cancer Registry, 1988–2004.
0
20
40
60
80
100
120
140
160
180
19
88
19
89
19
90
19
91
19
92
19
93
19
94
19
95
19
96
199
7
19
98
199
9
20
00
20
01
200
2
20
03
200
4
Year of Diagnosis
Rat
e p
e
r 100,000
Invasive
during this time period, but education level and mammo-graphic screening history did increase modestly. Decreases in HT use are comparable to those noted in our recent report of a 68% decrease in the use of HT among middle-aged North-ern California women after 2002 [10] and are consistent with findings in the US [12,38] and Germany [11]. Increasing HT use from 1994 to approximately 1999, the plateau in use from 1999 to 2001 following the 1998 release of findings from the Heart and Estrogen/Progestin Replacement Study [39,40], and the dramatic decrease in Northern California [10] after the 2002 WHI findings [14] closely mirror the trends we observed in both invasive breast cancer and breast cancer in situ inci-dence in the SFBA and the rest of California. This pattern, in addition to the decreases in ER+ tumors, though limited by the
high percentage of missing values, further supports the notion of a strong influence of the population prevalence of HT use on breast cancer incidence patterns.
It is unclear to what extent mammographic screening patterns, which have been associated with breast cancer incidence increases in the US (particularly in the late 1980s and early 1990s [30,38,41,42]), explain the elevated incidence rates in
the SFBA. Our observations of higher incidence rates of breast cancer in situ, detected exclusively by mammography, and excess rates of localized and regional disease or tumors less than 2 cm, as well as excesses in women targeted by mammography screening guidelines (40 years old or older), suggest that the SFBA excess could be due in part to higher levels of screening, a finding supported by CHIS data that find a somewhat higher prevalence of mammographic screening in 2001, but not 2003, in the SFBA. The continued assessment of future trends in incidence rates will help us to understand whether a plateau in mammography screening [13,38] is play-ing a role in the observed trends.
[image:7.612.59.553.90.431.2]Some, but not all [7], prior studies using ecologic and cohort study designs have found that sociodemographic characteris-tics [5,7] and risk factor distributions [4] explained the higher incidence rates of breast cancer in the SFBA compared with other regions. However, without information on residential mobility, these studies could not address the reasons why high-risk populations concentrate in certain geographic areas. Demographic change in the US appears to be favoring the migration of educated workers into certain geographic areas,
Figure 3
Trends in mortality rates among non-Hispanic white females in the San Francisco Bay area (䉬) and the rest of California (䊐), California Cancer Reg-istry, 1988–2004
Trends in mortality rates among non-Hispanic white females in the San Francisco Bay area (䉬) and the rest of California (䊐), California Cancer Reg-istry, 1988–2004.
0
5
10
15
20
25
30
35
40
19
88
19
89
19
90
19
91
19
92
19
93
19
94
19
95
199
6
199
7
199
8
19
99
20
00
20
01
20
02
200
3
200
4
Year of Death
Rat
e p
e
including the SFBA, out-migration of less-educated persons to other parts of the country, and migration of service workers to suburbs on the periphery of the educated urban cores [43]. These patterns of migration are supported by 2000 to 2004 census data that list San Francisco and San Jose among the slowest-growing metropolitan areas and that list metropolitan areas outside the Greater SFBA as some of the fastest-grow-ing [44]. The extent to which these migration patterns concen-trate women with multiple established breast cancer risk factors in particular areas over time may help explain past and future breast cancer incidence trends. The breast cancer inci-dence patterns observed in SFBA women may be representa-tive of patterns occurring in subpopulations with high breast
[image:8.612.66.556.111.553.2]cancer incidence, but for whom routine surveillance is chal-lenging, such as women residing in West Los Angeles [45], women of high socioeconomic status [46], or female teachers in California [47]. Cancer surveillance efforts are further lim-ited by the lack of population counts defined by individual characteristics, such as educational attainment within small geographic areas, that are necessary for estimation of inci-dence rates stratified by these characteristics. Therefore, non-Hispanic white women in the SFBA, where surveillance is ongoing, may serve as bellwethers for cancer trends occurring in similar subpopulations living in more heterogeneous areas.
Table 2
Two-year average annual breast cancer incidence and mortality rates in non-Hispanic white women
San Francisco Bay area The rest of California
2000–2001 Rate (95% CI)
2003–2004 Rate (95% CI)
2000–2001 Rate (95% CI)
2003–2004 Rate (95% CI)
Mortality rate 27.4 (25.7–29.2) 26.5 (24.9–28.3) 27.8 (27.1–28.6) 25.4 (24.6–26.1)
In situ incidence rate 35.6 (33.6–37.7) 33.2 (31.3–35.2) 30.5 (29.7–31.4) 29.5 (28.7–30.4) Invasive incidence rate 160.0 (155.9–164.3) 140.8 (136.9–144.8) 151.7 (149.9–153.6) 135.1 (133.4–136.9)
Histologic subtypea
Ductal 110.9 (107.5–114.5) 97.0 (93.7–100.3) 98.9 (97.4–100.4) 88.4 (87.0–89.8)
With lobular component 29.6 (27.8–31.5) 26.9 (25.2–28.7) 30.4 (29.6–31.2) 27.0 (26.2–27.8)
Age at diagnosis (years)a
<40 13.1 (11.5–15.0) 14.0 (12.1–16.1) 13.0 (12.2–13.9) 13.0 (12.2–13.9)
40–69 305.5 (295.4–315.8) 263.1 (253.9–272.5) 287.3 (282.8–291.9) 255.5 (251.3–259.7)
≥70 535.3 (511.7–559.8) 475.7 (452.4–499.9) 511.6 (501.3–522.0) 447.8 (438.0–457.7)
ER/PR statusa
ER+/PR+ 96.0 (92.7–99.3) 83.7 (80.7–86.8) 76.0 (74.7–77.3) 65.9 (64.7–67.2)
ER+/PR- 19.5 (18.0–21.0) 15.3 (14.1–16.7) 15.9 (15.3–16.5) 14.1 (13.5–14.6)
ER-/PR+ 2.3 (1.8–2.9) 1.0 (0.7–1.4) 1.9 (1.7–2.1) 1.3 (1.1–1.5)
ER-/PR- 21.6 (20.1–23.3) 20.3 (18.8–21.9) 20.5 (19.8–21.3) 19.6 (18.9–20.2)
Missing 20.7 (19.3–22.3) 20.3 (18.9–21.9) 37.4 (36.5–38.4) 34.3 (33.4–35.1)
Stage at diagnosisa
Localized 103.4 (100.1–106.8) 93.1 (89.9–96.4) 95.0 (93.5–96.5) 84.6 (83.3–86.0)
Regional 48.4 (46.1–50.8) 40.5 (38.4–42.7) 47.8 (46.8–48.9) 42.0 (41.0–43.0)
Distant 6.0 (5.2–6.9) 5.3 (4.5–6.1) 5.4 (5.0–5.8) 5.5 (5.2–5.9)
Unstaged/Not available 2.3 (1.8–2.8) 1.5 (1.1–1.9) 3.4 (3.2–3.7) 2.2 (2.0–2.5)
Tumor size
<2 cm 93.4 (90.2–96.7) 82.6 (79.6–85.7) 84.8 (83.4–86.2) 73.9 (72.6–75.2)
≥2 cm 58.1 (55.6–60.7) 51.6 (49.2–54.1) 58.2 (57.0–59.4) 53.5 (52.4–54.6)
Unknown 8.5 (7.6–9.5) 6.1 (5.3–6.9) 8.8 (8.3–9.2) 7.1 (6.7–7.5)
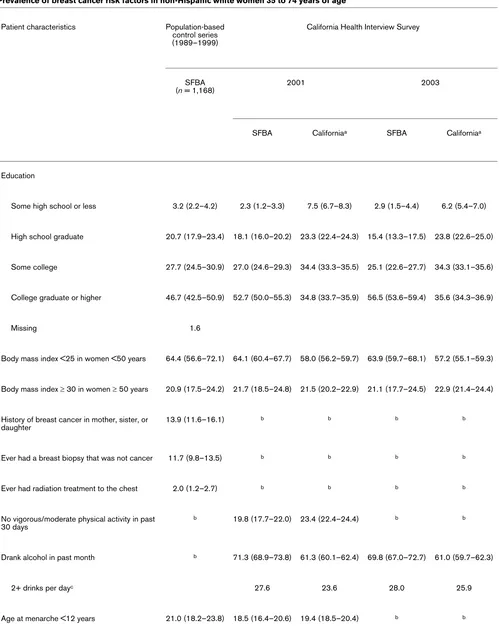
Table 3
Prevalence of breast cancer risk factors in non-Hispanic white women 35 to 74 years of age
Patient characteristics Population-based control series (1989–1999)
California Health Interview Survey
SFBA
(n = 1,168) 2001 2003
SFBA Californiaa SFBA Californiaa
Education
Some high school or less 3.2 (2.2–4.2) 2.3 (1.2–3.3) 7.5 (6.7–8.3) 2.9 (1.5–4.4) 6.2 (5.4–7.0)
High school graduate 20.7 (17.9–23.4) 18.1 (16.0–20.2) 23.3 (22.4–24.3) 15.4 (13.3–17.5) 23.8 (22.6–25.0)
Some college 27.7 (24.5–30.9) 27.0 (24.6–29.3) 34.4 (33.3–35.5) 25.1 (22.6–27.7) 34.3 (33.1–35.6)
College graduate or higher 46.7 (42.5–50.9) 52.7 (50.0–55.3) 34.8 (33.7–35.9) 56.5 (53.6–59.4) 35.6 (34.3–36.9)
Missing 1.6
Body mass index <25 in women <50 years 64.4 (56.6–72.1) 64.1 (60.4–67.7) 58.0 (56.2–59.7) 63.9 (59.7–68.1) 57.2 (55.1–59.3)
Body mass index ≥ 30 in women ≥ 50 years 20.9 (17.5–24.2) 21.7 (18.5–24.8) 21.5 (20.2–22.9) 21.1 (17.7–24.5) 22.9 (21.4–24.4)
History of breast cancer in mother, sister, or daughter
13.9 (11.6–16.1) b b b b
Ever had a breast biopsy that was not cancer 11.7 (9.8–13.5) b b b b
Ever had radiation treatment to the chest 2.0 (1.2–2.7) b b b b
No vigorous/moderate physical activity in past 30 days
b 19.8 (17.7–22.0) 23.4 (22.4–24.4) b b
Drank alcohol in past month b 71.3 (68.9–73.8) 61.3 (60.1–62.4) 69.8 (67.0–72.7) 61.0 (59.7–62.3)
2+ drinks per dayc 27.6 23.6 28.0 25.9
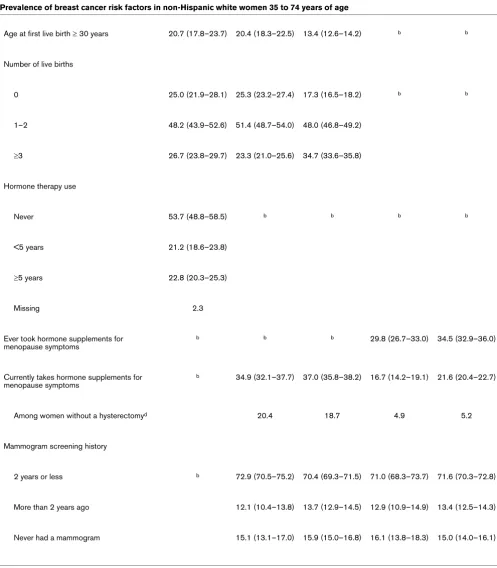
Age at first live birth ≥ 30 years 20.7 (17.8–23.7) 20.4 (18.3–22.5) 13.4 (12.6–14.2) b b
Number of live births
0 25.0 (21.9–28.1) 25.3 (23.2–27.4) 17.3 (16.5–18.2) b b
1–2 48.2 (43.9–52.6) 51.4 (48.7–54.0) 48.0 (46.8–49.2)
≥3 26.7 (23.8–29.7) 23.3 (21.0–25.6) 34.7 (33.6–35.8)
Hormone therapy use
Never 53.7 (48.8–58.5) b b b b
<5 years 21.2 (18.6–23.8)
≥5 years 22.8 (20.3–25.3)
Missing 2.3
Ever took hormone supplements for menopause symptoms
b b b 29.8 (26.7–33.0) 34.5 (32.9–36.0)
Currently takes hormone supplements for menopause symptoms
b 34.9 (32.1–37.7) 37.0 (35.8–38.2) 16.7 (14.2–19.1) 21.6 (20.4–22.7)
Among women without a hysterectomyd 20.4 18.7 4.9 5.2
Mammogram screening history
2 years or less b 72.9 (70.5–75.2) 70.4 (69.3–71.5) 71.0 (68.3–73.7) 71.6 (70.3–72.8)
More than 2 years ago 12.1 (10.4–13.8) 13.7 (12.9–14.5) 12.9 (10.9–14.9) 13.4 (12.5–14.3)
Never had a mammogram 15.1 (13.1–17.0) 15.9 (15.0–16.8) 16.1 (13.8–18.3) 15.0 (14.0–16.1)
aExcluding the SFBA. bNot available in the population-based control series or AskCHIS. cCalculated by dividing the number of women drinking 2+ drinks per day in the past 30 days by the total number of women (that is, the number of women who did and did not drink alcohol in the past 30 days). dCalculated by dividing the number of women who did not have a hysterectomy and reported using hormone supplements by the total number of women (that is, the number of women who did and did not take hormone supplements for menopause symptoms). SFBA, San Francisco Bay area.
Table 3 (Continued)
[image:10.612.56.553.100.668.2]A limitation of this analysis is that the data are ecological. That is, the data are available only at a geographic (that is, county) level rather than at the individual level. In addition, we did not adjust breast cancer incidence rates for known risk factors, nor did we have population prevalence estimates of risk factor changes over the 17-year study period or in the rest of the SEER regions. We were able to present risk factor changes between variables measured similarly in the 2001 and 2003 CHISs, but these data are limited by low response rates that could result in selection bias. However, response rates in CHIS were comparable to those in other population-based surveys [29], and response rates among the population-based controls included in the present analysis, though not directly comparable to CHIS, were higher. Even with these limitations, the ability to examine the prevalence of established breast can-cer risk factors from two population-based sources allowed us to compare the prevalence of breast cancer risk factors in SFBA non-Hispanic white women with similar women in the rest of California. Furthermore, our data provided sufficient power for examining incidence trends by age, histologic sub-type, stage at diagnosis, and hormone receptor status.
Conclusion
Understanding breast cancer incidence and risk factor preva-lence patterns in SFBA non-Hispanic white women informs the study of breast cancer etiology in two ways. First, future population-based studies attentive to exposure heterogeneity might include SFBA counties together with other US or inter-national populations with lower documented incidence rates of breast cancer, in which established or putative risk factors may be less common, and protective factors may be more common. Second, high-incidence populations are also useful for the study of potentially important, yet poorly studied, com-munity-level or cultural influences on breast cancer occur-rence. A Wisconsin study [48], for instance, found that breast cancer risk was associated with high community socioeco-nomic status after adjustment for individual-level education and other established risk factors, suggesting that living in affluent communities impacts breast cancer risk above and beyond the risk conferred by individual risk factors. Thus, doc-umenting breast cancer occurrence patterns in high-incidence regions, such as the SFBA, continues to be an activity of importance to breast cancer prevention efforts.
Competing interests
CC has served as an expert witness for plaintiffs in hormone therapy tort litigation. The other authors declare that they have no competing interests.
Authors' contributions
MW, EJ, SG, and PH-R contributed control data from the Marin County Breast Cancer Study of Adolescent Factors, the San Francisco Bay Area Breast Cancer Study, the Reproduc-tive Factors in Hodgkin Lymphoma in Women study, and the Bay Area Thyroid Cancer Study, respectively, and participated
in the interpretation of data and critical review of the manu-script. EC participated in the interpretation of data and drafting and critical review of the manuscript. TK and CC created the study design, conducted the acquisition, interpretation, and analysis of data, and led the writing and review of the manu-script. All authors read and approved the final manumanu-script.
Acknowledgements
The authors thank Sarah Shema for her contributions to this study. This research was supported by the SEER Rapid Response Surveillance Study mechanism by a supplement to contract N01-CN-65107 with the National Cancer Institute, National Institutes of Health, and with support of the California Cancer Registry, a project of the Cancer Surveillance Section, California Department of Health Services, under subcontract 1000891 with the Public Health Institute and a grant from the Plump-jack/LINK (learning, information, networking and knowledge) fund. The content of this publication does not necessarily reflect the views or pol-icies of the US Department of Health and Human Services or the Cali-fornia Department of Health Services, nor does mention of trade names, commercial products, or organizations imply endorsement by the US Government or state of California. Data collection for the Marin County Breast Cancer Study of Adolescent Risk Factors was supported by grants 4AB-14801 and 5BB-1201 from the California Breast Cancer Research Program's Community Research Collaboration funding mech-anism. Data collection from the San Francisco Bay Area Breast Cancer Study was supported by grants 1RB0125 from the California Breast Cancer Research Program, R01 CA63446 from the National Cancer Institute, and DAMD17-96-1-6071 from the US Army Medical Research Program. Data collection from the study of reproductive factors and Hodgkin lymphoma was supported by R29 CA50381 from the National Cancer Institute. Data collection from the Bay Area Thyroid Cancer Study was supported by grant R01CA63284 from the National Cancer Institute.
References
1. Parkin DM, Whelan SL, Ferlay J, Teppo L, Thomas DB, (Eds): Can-cer Incidence in Five Continents, Vol. VIII, Vol. 155 Lyon, France: IARC Scientific Publications; 2002.
2. State Cancer Profiles [http://statecancerprofiles.cancer.gov/] 3. Clarke CA, Glaser SL, West DW, Ereman RR, Erdmann CA,
Bar-low JM, Wrensch MR: Breast cancer incidence and mortality trends in an affluent population: Marin County, California, USA, 1990–1999. Breast Cancer Res 2002, 4:R13.
4. Prehn A, Clarke C, Topol B, Glaser S, West D: Increase in breast cancer incidence in middle-aged women during the 1990s.
Ann Epidemiol 2002, 12:476-481.
5. Prehn AW, West DW: Evaluating local differences in breast cancer incidence rates: a census-based methodology (United States). Cancer Causes Control 1998, 9:511-517.
6. Laden F, Spiegelman D, Neas LM, Colditz GA, Hankinson SE, Manson JE, Byrne C, Rosner BA, Speizer FE, Hunter DJ: Geo-graphic variation in breast cancer incidence rates in a cohort of U.S. women. J Natl Cancer Inst 1997, 89:1373-1378. 7. Reynolds P, Hurley SE, Quach AT, Rosen H, Von Behren J, Hertz
A, Smith D: Regional variations in breast cancer incidence among California women, 1988–1997. Cancer Causes Control
2005, 16:139-150.
8. Robbins AS, Brescianini S, Kelsey JL: Regional differences in known risk factors and the higher incidence of breast cancer in San Francisco. J Natl Cancer Inst 1997, 89:960-965. 9. Census 2000 Summary File 3, Matrices P19, P36, P37, P38,
PCT24, and PCT25. .
11. Katalinic A, Rawal R: Decline in breast cancer incidence after decrease in utilisation of hormone replacement therapy.
Breast Cancer Res Treat in press. 2007, Apr 24
12. Ravdin PM, Cronin KA, Howlader N, Berg CD, Chlebowski RT, Feuer EJ, Edwards BK, Berry DA: The decrease in breast-cancer incidence in 2003 in the United States. N Engl J Med 2007, 356:1670-1674.
13. Jemal A, Ward E, Thun MJ: Recent trends in breast cancer inci-dence rates by age and tumor characteristics among U.S. women. Breast Cancer Res 2007, 9:R28.
14. Rossouw JE, Anderson GL, Prentice RL, LaCroix AZ, Kooperberg C, Stefanick ML, Jackson RD, Beresford SA, Howard BV, Johnson KC, et al.: Risks and benefits of estrogen plus progestin in healthy postmenopausal women: principal results from the Women's Health Initiative randomized controlled trial. JAMA
2002, 288:321-333.
15. Fritz A, Percy C, Jack A, Kanagaratnam K, Sobin L, Parkin DM, Whelan S, (Eds): International Classification of Diseases for Oncology 3rd edition. Geneva, Switzerland: World Health Organization; 2000.
16. Li CI, Daling JR, Malone KE: Incidence of invasive breast cancer by hormone receptor status from 1992 to 1998. J Clin Oncol
2003, 21:28-34.
17. Li CI, Malone KE, Daling JR: Differences in breast cancer hor-mone receptor status and histology by race and ethnicity among women 50 years of age and older. Cancer Epidemiol Biomarkers Prev 2002, 11:601-607.
18. Li CI, Uribe DJ, Daling JR: Clinical characteristics of different histologic types of breast cancer. Br J Cancer 2005, 93:1046-1052.
19. Miller BA, Hankey BF, Thomas TL: Impact of sociodemographic factors, hormone receptor status, and tumor grade on ethnic differences in tumor stage and size for breast cancer in US women. Am J Epidemiol 2002, 155:534-545.
20. Tarone RE, Chu KC: The greater impact of menopause on ER
-than ER+ breast cancer incidence: a possible explanation
(United States). Cancer Causes Control 2002, 13:7-14. 21. Gomez SL, Le GM, West DW, Satariano WA, O'Connor L:
Hos-pital policy and practice regarding the collection of data on race, ethnicity, and birthplace. Am J Public Health 2003, 93:1685-1688.
22. Ingram DD, Parker JD, Schenker N, Weed JA, Hamilton B, Arias E, Madans JH: United States Census 2000 population with bridged race categories. Vital Health Stat 2 2003:1-55. 23. Wrensch M, Chew T, Farren G, Barlow J, Belli F, Clarke C,
Erd-mann CA, Lee M, Moghadassi M, Peskin-Mentzer R, et al.: Risk factors for breast cancer in a population with high incidence rates. Breast Cancer Res 2003, 5:R88-102.
24. John EM, Horn-Ross PL, Koo J: Lifetime physical activity and breast cancer risk in a multiethnic population: the San Fran-cisco Bay area breast cancer study. Cancer Epidemiol Biomar-kers Prev 2003, 12(11 Pt 1):1143-1152.
25. Glaser SL, Clarke CA, Nugent RA, Stearns CB, Dorfman RF: Reproductive factors in Hodgkin's disease in women. Am J Epidemiol 2003, 158:553-563.
26. Horn-Ross PL, Morris JS, Lee M, West DW, Whittemore AS, McDougall IR, Nowels K, Stewart SL, Spate VL, Shiau AC, et al.: Iodine and thyroid cancer risk among women in a multiethnic population: the Bay Area Thyroid Cancer Study. Cancer Epide-miol Biomarkers Prev 2001, 10:979-985.
27. California Health Interview Survey. CHIS 2001 Methodology Series: Report 4-Response Rates. Edited by: Survey CHI. Los Angeles, CA: UCLA Center for Health Policy Research; 2002. 28. California Health Interview Survey. CHIS 2003 Methodology
Series: Report 4-Response Rates. edition. Edited by: Survey CHI. Los Angeles, CA: UCLA Center for Health Policy Research; 2005.
29. California Health Interview Survey. The CHIS 2001 Sample: Response Rate and Representativeness. Edited by: Survey CHI. Los Angeles, CA: UCLA Center for Health Policy Research; 2003.
30. Colditz GA, Baer HJ, Tamimi RM: Breast cancer. In Cancer Epi-demiology and Prevention 3rd edition. Edited by: Schottenfeld D, Fraumeni JF Jr. Oxford, UK: Oxford University Press; 2006:995-1012.
31. Surveillance Research Program: SEER*Stat software, version 6.1.4. [http://www.seer.cancer.gov/seerstat]. Bethesda, MD: National Cancer Institute
32. Ries LAG, Eisner MP, Kosary CL, Hankey BF, Miller BA, Clegg L, Mariotto A, Feuer EJ, Edwards BK, (Eds): SEER Cancer Statistics Review, 1975–2002. [http://seer.cancer.gov/csr/1975_2002/]. Bethesda, MD: National Cancer Institute
33. Kleinbaum D, Kupper L, Muller K: Applied Regression Analysis and Other Multivariable Methods 2nd edition. Boston, MA: PWS-Kent; 1988.
34. Joinpoint Regression Program. Statistical Research and Appli-cations Branch, National Cancer Institute 3.0th edition. 2005. 35. California Health Interview Survey: Survey Methodology
[http://www.chis.ucla.edu]
36. Effects of hormone replacement therapy on endometrial his-tology in postmenopausal women. The Postmenopausal Estrogen/Progestin Interventions (PEPI) Trial. The Writing Group for the PEPI Trial. JAMA 1996, 275:370-375.
37. Centers for Disease Control and Prevention (CDC): Decline in breast cancer incidence – United States, 1999–2003. MMWR Morb Mortal Wkly Rep 2007, 56:549-553.
38. Glass AG, Lacey JV Jr, Carreon JD, Hoover RN: Breast cancer incidence, 1980–2006: combined roles of menopausal hor-mone therapy, screening mammography, and estrogen recep-tor status. J Natl Cancer Inst 2007, 99:1152-1161.
39. Haas JS, Kaplan CP, Gerstenberger EP, Kerlikowske K: Changes in the use of postmenopausal hormone therapy after the pub-lication of clinical trial results. Ann Intern Med 2004, 140:184-188.
40. Hulley S, Grady D, Bush T, Furberg C, Herrington D, Riggs B, Vit-tinghoff E: Randomized trial of estrogen plus progestin for sec-ondary prevention of coronary heart disease in postmenopausal women. Heart and Estrogen/progestin Replacement Study (HERS) Research Group. JAMA 1998, 280:605-613.
41. Wun LM, Feuer EJ, Miller BA: Are increases in mammographic screening still a valid explanation for trends in breast cancer incidence in the United States? Cancer Causes Control 1995, 6:135-144.
42. Maskarinec G, Wilkens L, Meng L: Mammography screening and the increase in breast cancer incidence in Hawaii. Cancer Epidemiol Biomarkers Prev 1997, 6:201-208.
43. Florida R: The nation in numbers: where the brains are. Atlantic Monthly 2006 [http://www.theatlantic.com/doc/prem/200610/ american-brains].
44. Frey W: Metro America in the new century: metropolitan and central city demographic shifts since 2000. In Metropolitan Pol-icy Program, Living Cities Census Series Washington, D.C.: The Brookings Institute; 2005.
45. Mack T: Cancers in the Urban Environment London, UK: Elsevier Academic Press; 2004.
46. Yost K, Perkins C, Cohen R, Morris C, Wright W: Socioeconomic status and breast cancer incidence in California for different race/ethnic groups. Cancer Causes Control 2001, 12:703-711. 47. Bernstein L, Allen M, Anton-Culver H, Deapen D, Horn-Ross PL, Peel D, Pinder R, Reynolds P, Sullivan-Halley J, West D, et al.: High breast cancer incidence rates among California teachers: results from the California Teachers Study (United States).
Cancer Causes Control 2002, 13:625-635.