LL.
I-
.__
' :
' , ' : ;, '
***
*
*
*
*
*
***
*
EDUCATION
TRAINING
Y 0 U T H
Continuing training
in enterprises:
Prepared for DG XXII by the Centre for Training Policy Studies, University of Sheffield, United Kingdom
A great deal of additional information on the European Union is available on the Internet. It can be accessed through the Europa server (http://europa.eu.int).
Cataloguing data can be found at the end of this publication.
Luxembourg: Office for Official Publications of the European Communities, 1999
l
I
0
oiP
~
3//,
1(3,
3 33/,
i/t;-
373,
t..
lflf
s.,
3
71. ott (
3'JII.
37tJ
~/L,
9.3
***
*
*
*
*
*
***
*
EDUCATION
TRAINING
Y 0 U T H
Continuing training
in enterprisesl
-facts and figures
A report on the resu Its of the
continuing vocational training survey
carried out in the enterprises
PREFACE
The aging population and increasing rates of technological change, in particular in production systems, will have a considerable impact on the development of vocational training. On the one hand, the decreasing renewal of available manpower will mean that the skills of the workforce are updated less frequently; on the other hand, more frequent changes in production methods require a faster updating of these skills.
Thus, greater significance is accorded to continuing training, which provides the means to ensure that the skills base within the workforce meets the requirements of the economy. European employers have recognised this need and continuing vocational training has a long tradition in some Member States and certain economic sectors. Nearly all large enterprises in the European Union offer training to their employeers, to make them more effective technicians and better managers and to improve their information technology and language skills.
This is why the FORCE Decision (Council Decision 29 May 1990) required that a survey of continuing training be carried out 'on the basis of questionnaires sent to a sample of undertakings'.
The Continuing Vocational Training Survey (CVTS), carried out in 1994, provided for the first time comparable data on continuing training in enterprises. It is based on elaborate questionnaires and interviews with the managers of 50,000 European enterprises in the then 12 Member States. The initial results were first presented at European level in 1997. This publication provides more detailed analytical results.
The Directorate-General for Education, Training and Youth - DGXXII -, with the collaboration of the University of Sheffield, Eurostat and the Member States brought to completion this long and sometime difficult process, to produce the first edition of a very complex survey, resulting in the information presented here. This survey serves to support the strategy for lifelong learning in particular with regard to access to training and the development of continuing training policy.
Klaus Draxler Director
CONTENTS
LIST OF TABLES 6
KEY FINDINGS 8
INTRODUCTION 11
1.1 Background 11
1.2 Quality and comparability of the data 12
1.3 Structure of the report 13
1 TRAINING OFFERED BY ENTERPRISES 15
1.1 Introduction 15
1.1 Who offers training? 15
1.1.1 -By Country 15
1.1.2 -By size of enterprise 16
1.1.3 -By sector of the economy 17
1.1.4 Interaction between country, enterprise
size and sector 19
1.2 Types of continuing training 21
1.3 Participation rates for different types of training 22
1.3.1 Training courses 23
1.3.2 Training in the work situation 24
1.3.3 Conferences and workshops 25
1.3.4 Job rotation, quality circles etc. 26
1.3.5 Self learning 27
2 TRAINING COURSES 29
2.1 Introduction 29
2.1 Participation by gender and occupation 29
2.2 Duration of training courses 32
2.3 Subjects of training 36
2.4 Providers of external training 42
2.5 Costs of training courses 45
2.5.1 Introduction 45
2.5.1 Training costs by country 46
2.5.2 Training costs by enterprise size and sector 50
3 TRAINING POLICIES AND MANAGEMENT 53
c
Annex 1
Annex 2
Annex 3 3.1
3.2
3.3
3.4
3.5
Assessment of future manpower and skill needs Training plans and budgets
3.2.1 Introduction
3.2.1 Plans and budgets by country, enterprise size and sector 3.2.2 Plans and participation rates
Training policies for special groups of workers Future trends
Attitudes of enterprises not offering training in 1993
3.5.1 Reasons for not training in 1993 3.5.2 Training in the two previous years
or next two years
3.5.3 How enterprises not training in 1993 obtain their skills
CONCLUSIONS AND THOUGHTS FOR THE FUTURE
53 55
56
60 62
63
65 65
66
67
68
71
74
LIST OF TABLES
1 Enterprises offering training in 1993 -by country 14
2 Enterprises offering training in 1993 -by size of enterprise 15
3 Enterprises offering training in 1993 -by sector 16
4 Actual and standardises proportion of enterprises offering
training in 1993 -by country 18
5 Enterprises offering different types of training -by size of
enterprise 19
6 Enterprises offering training courses -by whether external,
internal or both 20
7 Participation rates of employees in different types of training 21
8 Enterprises offering training courses and participation
rates by country 22
9 Enterprises offering training in the work situation and
participation rates by country 23
10 Enterprises offering training through conferences and workshops
etc. and participation rates by country 24
11 Enterprises offering training through job rotation and quality
circles etc. and participation rates by country 25
12 Enterprises offering training through self learning circles etc.
and participation rates by country 26
13 Participation in courses by gender and occupation 28
14 Distribution of employment and participation rates in courses -by
gender, 1993 29
15 Time spent on training courses by size of enterprise, gender and
occupation 31
16 Time spent on training courses -by country 32
17 Hours of training per 1000 hours worked -by country 33
18 Time spent on training courses by sector 34
19 Distribution of time spent on training courses by subject 35
20 Hours of training per 1000 employees (all enterprises) by
subject, 1993 36
21 Relative importance of different subjects of training within
sectors 37
22 Relative importance of different subjects of training within
countries 39
23 Proportion of training time spent on external and internal courses 41
24 External training by different types of provider -by country 42
25 External training by different types of provider -by size 43
26 Structure of costs of training courses, 1993 -by country 44
27 Training costs as a percentage of labour costs and per participant,
1993 -by country 46
28 Costs of training adjusted for relative labour costs 47
29 Training costs as a percentage of labour costs and per participant,
1993 -by size of enterprise 48
30 Training costs as a percentage of labour costs and per
participant, 1993 -by sector 49
32 Enterprises assessing manpower and skill needs, 1993 -by size of 53 enterprise
33 Enterprises with training plans and budgets, 1993 -by country 54
34 Enterprises with training plans and budgets, 1993 -by size of
enterprise 55
35 Enterprises with training plans and budgets, 1993 -by sector 55
36 Enterprises with training plans and/or training budgets, 1993
-by country 56
37 Enterprises with training plans and/or training budgets, 1993
-by size of enterprise 57
38 Training plans; whether a joint action with employees and whether
published -by country 58
39 Participation in courses for enterprises with and without a plan
-by country 59
40 Participation in courses for enterprises with and without a plan
-by size of enterprise 59
41 Enterprises with training policies for special groups of workers 60
42 Expected trends over the next three years-balance of enterprises
expecting increases over decreases, 1993 -by type of training 62
43 Expected trends over the next three years-balance of enterprises expecting increases over decreases for external and internal
courses, 1993-by size of enterprise 62
44 Reasons for not proving training in 1993 -by country 63
45 Enterprises not offering training in 1993 by whether offering
training in two previous or next to years 65
46 Methods used to obtain skills in enterprises not offering training
I
KEY FINDINGS
THE SURVEY CONFIRMS THAT:
• More than half (57%) of European enterprises with 10 or more employees
offered training to their employees in 1993. Nearly all large enterprises did
so but only 52 percent of those with 10-49 employees. Over 80°/o of
employees worked in enterprises which offered training. In addition to the
size of the enterprise, country and economic sector were also important
factors influencing training behaviour. While these factors interacted they
did not do so to any great extent. (pages 16-21)
• The sectors with the highest proportion of enterprises offering training
included those which had been undergoing rapid technological and
organisational change in recent years and where, therefore, the need to
train and re-train existing workers had been the greatest. (page 18)
• Only 17 percent of manual workers participated in training courses in 1993
compared to 34 percent of clerical and shop workers and nearly 45
percent of managerial, professional and technical staff. (page 29-30)
• Using the work-place as a learning situation through job rotation, quality
circles etc. and self learning in its different forms was less common than
other forms of training (7-8% of all enterprises used these forms).
However, self-learning appeared to be particularly strong in the banking
and insurance and related financial services sector and other sectors
perhaps due to the growth of computer-assisted learning in the sectors.
(page 25-28)
THE SURVEY SUGGESTS THAT:
• In enterprises offering training, participation rates of employees did not
vary much between size groups. This suggests that
training cultureoffered training to a proportion of employees which varied little with the
size of the enterprise. (pages 22-23)
• There is an association between an enterprises having a training plan
and the rate at which its employees participated in training courses.
However, the survey cannot say which was the cause and which the
effect. The action of drawing up a training plan may have identified the
need for more training or, alternatively, the more training that was done the
greater was the need to have a training plan to help manage it. Perhaps
significatively, in three of the four countries in which equal opportunity
polices were prominent among their enterprises, Belgium, Denmark and
Ireland, female participation rates were noticeably higher. (pages 61-62)
• The average time spent on training courses in 1993 was a little over a
week per participant and this was similar for participants in enterprises of
different size and between gender and occupation groups. Differences
between sectors were much larger. (pages 33-36)
• New forms of training emerged, such as Self-Learning and Job-Rotation,
and small enterprises (1 0-49 employees) took more advantage of these.
This may have been a way to compensate for some of the difficulties they
face in offering courses to their employees. (page 23-27)
• Overall, women had similar participation rates to men. However, this was
because their employment was concentrated in occupations, and to a
lesser extent in sectors, with high rates of training and not because they
were always treated equally within occupations and sectors. (pages 29-32)
• About a quarter of all training course time was concerned with the
techniques of producing goods and services and this was almost
constant across size groups. Other types of training featured prominently
in certain sectors according to specific needs-for example, health and
safety training in mining and quarrying, construction, hotels and
restaurants and food manufacture and financial training in the banking and
insurance sector. (pages 36-42)
• About 1.6
percent of labour costs
were spent in deliveringtraining
courses in 1993. This varied from over 2 percent in the largest enterprises to under 1 percent in those with only 1 0-49 employees and also from 2 percent or more in France and the United Kingdom to under 1 percent in Portugal. In most countries around a half of all training costs was accounted for by the labour costs of the employees while receiving training. (page 48)
• A little less than a
half of the training course costs were the trainees'
labour costs.
Fees to external trainers accounted for 20-25 percent, the outstanding costs being costs of internal trainers, costs of premises and trainees' travel and subsistence. The distribution of training costs was strikingly similar across Member States. (page 46)• Usually, external providers were more expensive than training organised internally. This was not the case, however, in countries such as Denmark and France, where
special arrangements
existed to allow small enterprises to obtain less expensive forms of external training. (page 50-51)• Over 60 percent of enterprises that did no training in 1993 said that
I INTRODUCTION
1.1 Background
The Continuing Vocational Training Survey (CVTS) was carried out as part of the FORCE Programme in 1994 in the then twelve Member States of the European Union. The FORCE Decision (Council Decision 29 May 1990) had included, as one of the actions within the programme, the 'exchange of comparable data on continuing vocational training'. Specifically, it required that a survey of continuing training be carried out 'on the basis of questionnaires sent to a sample of undertakings, in co-operation with the competent organisations in the Member States'.
This decision, to include a requirement for a statistical survey within the actions of a training programme, almost certainly had its origins in the early 1980's. That period was one during which massive restructuring took place in the economies of the European Union. Large scale productivity gains were achieved -but employment levels fell and unemployment rose. Training policies at both national and at Community level were designed to provide solutions to what were then seen as essentially short-term problems and whose dimensions were largely national in character - to assist the re-employment of workers who had lost their jobs; to retrain those threatened by unemployment; and to help young people whose employment prospects had been reduced.
However, one of the main messages to emerge as the 1980s progressed was that restructuring economies, supported by short-term training initiatives, could not alone generate the productivity increases required to achieve economic growth on the scale needed for new jobs to be created. The pace of technological and demographic changes caused the debate to be focused more and more on the need to train and retrain those already at work.
These national surveys were therefore neither comprehensive nor comparable across the Community.
The CVTS sought to fill this gap. The survey took three years to plan. This was because it was breaking new ground in an area where little or no prior experience existed in many Member States and where no experience existed of trying to collect comparable data for different countries. Although, therefore, the FORCE decision had listed in general terms the type of information to be collected, the detailed requirements, including the concepts and definitions to be used and the methodology to be employed, had to be specified and tested before the survey could take place. This was done by a Working Group comprising both statistical and policy representatives from each Member State under the chairmanship of EUROSTAT(The Statistical office of the European Communities).
1.2 Quality and comparability of the data
The quality and comparability of the data collected will have been affected by a number of factors. These include the initial sample sizes, the response rates achieved, the survey methods used and the ability of enterprises in the Member States to interpret uniformly the requirements of the survey.
The initial sample sizes varied considerably between Member States, In part, but not entirely so, these will have been influenced by the survey design used and will have taken into account the expected proportion of enterprises offering training to their employees. The response rates also varied but were generally satisfactory. The net effect of these two factors, however, was that the number of enterprises actually responding to the survey, in whole or in part, varied from over 16,000 in Italy to under 700 in Ireland.
For the Community as a whole data were collected from 45,000 enterprises - or 1 in 20 of the 900,000 enterprises represented by the survey. As require, the national samples had been stratified by sector and size. Within the overall total, for example, over 1 in 3 of the largest enterprises (those with 1000 or more employees) were surveyed. The rate at which enterprises were sampled was lowered as the enterprise size was reduced. Among the smallest, but most numerous enterprises (those with between 10 and 49 employees), only 1 in 30 enterprises took part in the survey. The effect of the higher sampling fractions among the largest enterprises was that although only 5 per cent of enterprises took part in the survey, these employed some 20 percent of the 55 million employees in the enterprises represented by the survey.
Concerning the comparability, as opposed to the quantity of the response received, a major factor will have been the extent to which the agreed concepts and definitions were applied in the different Member States. It had been agreed that a standard questionnaire could not be imposed on Member States. This was because the wording of national questionnaires would have to reflect both the language of national training practices and their institutional arrangements.
Member States were free also to design their own survey according to national practices and lessons learned from their national pre-tests and pilot surveys; in particular, on the balance required between postal and interview based approaches and on other procedures needed to ensure a satisfactory rate of response to the more difficult questions.
Inevitably, this freedom in how to administer the survey led to a wide variety of practices being used. It was inevitable, also, that these different practices introduced opportunities for some loss of comparability in the results obtained. It is not possible to make an assessment of the extent to which this occurred but it is further reason why the focus of any analysis should be on the broad patterns which are evident in the results rather than on small differences which m~y not be significant. Should the survey be repeated, there is a strong case for introducing more standardisation and control over the way in which the national surveys are conducted.
1.3 Structure of the report
In the report which follows, chapter 1 will look at the number and proportion of enterprises offering each of the different types of training and the number of employees who participated in them. As in all chapters, analyses will be made for EU12 as a whole and for each country, sector and size group. Where possible and relevant, the relationships and interaction between them will be examined.
Chapter 2 will focus on training courses (external and internal) by examining the participation in them by gender and occupation, the subjects taught, the types of external training providers used and the costs of training.
1
TRAINING OFFERED BY ENTERPRISES
1.1
Introduction
Chapter 1 looks at which enterprises offered training in 1993 and at the types of training offered and the proportion of employees who participated in each type. The aim is to characterise training in enterprises in terms of training need, economics, and culture.
1.1
Who offered training?
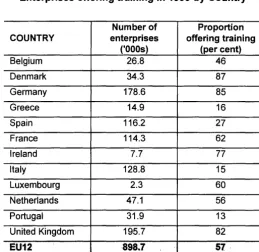
As already mentioned, the CVTS was designed to measure the continuing training practices of nearly 900,000 enterprises, with 10 or more employees, in the then 12 Member States of the EU. It is estimated that nearly 60 per cent of these offered some form of continuing training for their employees in 1993. However, this overall figure conceals marked difference between countries and between the size and sector of enterprises.
1.1.1 -by
CountryTable 1
Enterprises offering training in 1993-by Country
Number of Proportion COUNTRY enterprises offering training
('OOOs) (per cent)
Belgium 26.8 46
Denmark 34.3 87
Germany 178.6 85
Greece 14.9 16
Spain 116.2 27
France 114.3 62
Ireland 7.7 77
Italy 128.8 15
Luxembourg 2.3 60
Netherlands 47.1 56
Portugal 31.9 13
United Kingdom 195.7 82
EU12 898 .. 7 57.
The survey did not provide an explanation of why such large differences exist. Some caution is needed, however, in their interpretation. The survey required that formal initial training programmes should be excluded. In some countries, in which initial training is highly formalised this requirement will have presented few problems for the enterprises responding to the survey. However, it is possible that in other countries the initial training of workers may be less formalised and take place in a way which is indistinguishable from that provided as continuing training. In this case it may have been counted as such.
Also, continuing training may be the way in which some countries seek to fill the skills gap created by a less developed initial training system. While such caveats invite caution in the interpretation of the data, the overall picture of considerable differences between countries remains.
1.1.2 -by Size of Enterprise
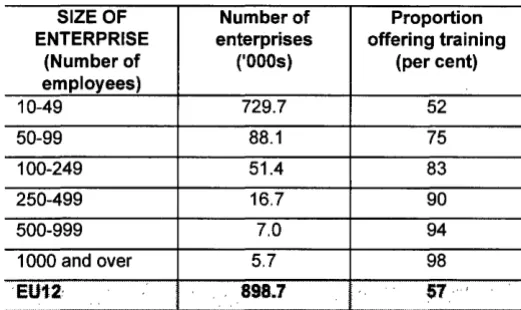
enterprises which offered training in 1993 is largely determined by the behaviour of this size group.
Table 2
Enterprises offering training in 1993-by size of enterprise
SIZE OF Number of Proportion
ENTERPRISE enterprises offering training
(Number of ('OOOs) (per cent)
employees)
10-49 729.7 52
50-99 88.1 75
100-249 51.4 83
250-499 16.7 90
500-999 7.0 94
1 000 and over 5.7 98
·EU12: 898.7 57.'
Two comments are needed to put these figures into perspective. First, the smallest enterprises employed only a little over a quarter of all workers. In contrast, enterprises with 1000 or more employees (less than one percent) employed nearly a third of all workers. When this is taken into account it is found that over 80 percent of all employees worked in enterprises which offered some form of continuing training in 1993.
Secondly, it does not follow that enterprises which did not offer any training in 1993 never do so. One of the questions in the survey, put to enterprises which did no training in 1993, asked them whether they had provided training in the two previous years and whether they planned to do so over the following two years. Another question asked them how they obtained the skills they needed. The answers to these questions will be analysed later in the report but together they suggest that continuing training plays at least some part in the skill development strategy of at least a third of the enterprises that did not offer training in 1993.
1 . 1 . 3 -by Sector of the economy
sectors engaged in all of these activities some two-thirds or more of the enterprises offered some form of continuing training.
Sectors with less than the community average proportion of enterprises which offered training, include the textiles, clothing and leather sector (with the lowest proportion at 27 percent}, some manufacturing sectors, mining and quarrying, and the construction sector.
One possible reason for at least a part of these differences between sectors is that the need for continuing training is different. The sectors with the highest proportion of enterprise offering training include those which have been undergoing rapid technological and organisational change in recent years and where, therefore, the need to train and re-train existing workers has been the greatest. In other sectors, the pace of change may have been less marked allowing them to rely more heavily on the skills obtained through initial training.
Table 3
Enterprises offering training in 1993-by Sector
SECTOR Number of Proportion
enterprises offering training
('OOOs) (per cent)
Banking and insurance 15.1 87
Electricity, Gas and Water 3.0 81
Other financial services 4.1 79
Sale and repair of vehicles 42.5 78
Real estate, renting and services for enterprises 118.9 72
Post and telecommunications 1.6 66
Retail trade and repairs (ex vehicles) 75.4 64
Manufacture of machinery 48.1 62
Manufacture of metals and metal products 58.4 59
Paper. Publishing and Printing 28.9 59
Hotels and Restaurants 65.7 58
Manufacture of non-metallic products 42.1 57
Wholesale trade (ex vehicles) 89.2 57
Manufacture of transport equipment 8.7 56
Construction 127.2 51
Food, beverages and tobacco 35.9 49
Transport and storage 38.0 46
Mining and quarrying 6.2 43
Other manufacturing (inc. furniture) 33.3 41
Textiles, clothing and leather 56.4 26
1.1.4 Interaction between country, size and sector
The analysis so far has shown that the proportion of enterprises offering training varies between countries, between sizes of enterprises and between sectors. These differences, however, may not be independent. Sectors differ both in the distribution of the sizes of their enterprises and in the countries in which they are concentrated. For example, the average enterprise in the post and telecommunications sector has over 1000 employees. In contrast enterprise engaged in the sale and repair of vehicles, hotels and restaurants and construction each have, on average, under 40 employees.
Likewise, two thirds of all enterprises in the textile, clothing and leather sector which had the lowest proportion of enterprises offering training were located in Italy, Greece, Spain and Portugal -countries in the proportion of enterprises offering training were also low. Nearly two-thirds of enterprises in the banking and insurance sector, however, were found in Germany, the United Kingdom and Denmark - the three countries in which the highest proportion of enterprises provided training.
Enterprises also vary in size between countries. According to the survey, the average enterprise (with 10 or more employees)in France had over 80 workers compared to under 40 in Spain.
It is possible to test for interactions between these effects on the results presented above. This can be done by making comparisons using a standard distribution of enterprises. For example, if it is assumed that each sector had the same size distribution of enterprises, then, by applying the size specific training rates within each sector to this distribution, sector training rates can be calculated which are free of the influence of their size structure. This has been done using the size distribution of all enterprises in EU12 as the standard.
What this calculation shows is that had the electricity, gas and water sector had the size distribution of enterprises as EU12 as a whole, then the percentage of enterprises offering training would have been some 12 percentage points lower than that actually observed. The effect on the construction sector would have been to increase its training rate by 2 percentage points. Generally, however the size distribution of sectors appears to have relatively little influence on their overall training effort and that the sector in which it operates remains a significant determinant of whether an enterprise offers training to its employees.
Luxembourg and Denmark would have been respectively 6 and 5 percentage points lower had they had the same industrial structure as EU12 as a whole. In contrast, the proportion of enterprises offering training in Portugal would have been 3 percentage points higher(see Table 4).
Table4
Actual and standardised proportion of enterprises offering training in 1993-by Country
Standardised using EU12 distributions
COUNTRY Actual By sector By size
Belgium 45.9 44.7 46.2
Denmark 86.8 82.2 87.3
Germany 85.3 84.8 84.5
Greece 16.4 16.6 18.6
Spain 26.5 27.2 29.0
France 62.4 62.3 60.7
Ireland 76.8 78.0 76.1
Italy 15.0 17.4 16.9
Luxembo'urg 60.3 54.4 59.9
Netherlands 56.1 55.7 55.9
Portugal 13.1 16.2 13.5
United Kingdom 81.6 78.0 81.3
The impact of differences in the size distributions of countries on the proportion of their enterprises offering training is generally small, however- never accounting for more than 2 percentage points in either direction.
Finally, in this analysis of the effects of size and sectors distribution, it is possible to measure the joint effect of sector and size in combination. For this analysis a comparison has been made between countries of more comparable size. It can also only be done for cross classifications of 6 size groups and 7 broad industrial sectors because of the level of detail involved.
These analyses have shown that although there is some interaction between the size, sector and country of enterprises in determining whether they offer continuing training, their effects are largely independent of each other.
1.2
Types of continuing training
Although 57 per cent of enterprises offered some form of training for their employees, they will not have offered all the five types identified in the survey (counting external and internal course together as one type). Table 5 show the proportion of all enterprises in EU12 offering each of the different types. The most common types were courses, training in the work situation and attendance at conferences, workshops etc. which were each offered by more than a third of all enterprises. Using 'the work place as a learning situation through job rotation, quality circles etc. and self learning in its different forms were less common - offered by one in 7 or 8 of all enterprises. As with the overall total, there is an increase in the proportion of enterprises offering each type of training as the enterprise size increases.
Table 5
Enterprises offering different types of training by size of enterprise( per cent) SIZE Courses Training in Conferences, Job rotation Self Learning
work situation Workshops, etc. Seminars
10-49 36 34 29 10 10
50-99 63 50 49 21 21
100-249 76 58 63 30 28
259-499 85 69 71 38 38
500-999 93 74 76 47 43
1000+ 92 85 80 50 52
Total: ' ' :,43, ,' --:,:38, ". : • / ' ., 34 . ",::. ::14-~: .:,13 ,,·,,,
'
The pattern of use of the different types of training among sectors of the economy is largely a reflection of their overall rates. Sectors with an above average proportion of enterprise offer training are likely to have above average rates in the different types of training.
Table 6
Enterprises which offer courses by type offered (per cent) SIZE External courses Internal courses
10-49 91 47
50-99 93 59
100-249 95 69
250-499 96 82
500-999 96 88
1000+ 94 94
Total-~:~··_.-,_: ,-., ~,~-: ;,;-/ . ,, .. .-.'·,:92 ' ' f' . ~ '' ~ ' . ,'54::;,:-0; ' , ..
What is interesting, therefore, is that small enterprises are very much more likely to have to resort to the use of external training providers to train their workers. This, no doubt, reflects both the more limited resources available to small enterprises to run internal courses and the dis-economies of doing so for what will be often only a few participants. But it is also the case that for larger enterprises as well, except the very largest, when only one type of training is offered it is also more likely to be provided by an external trainer. Who these external providers are will be considered in the next chapter.
1.3
Participation rates for different types of training
Table 7
Participation rates in each type of training (percentage of employees in those enterprises offering that type of training)
Types of training offered
Courses Training in Conferences, Job rotation Self Learning
work Workshops, etc.
situation Seminars
SIZE participation rates(%)
10-49 36 45 23 28 24
50-99 33 42 14 15 10
100-249 37 40 15 14 10
259-499 44 40 15 11 7
500-999 46 39 15 12 8
1000+ 49 44 12 13 11
Total 43:'. ,. ' 43 ,' 14 14 11 '
The picture is very different, however, for the newer types of training. In the smallest enterprises, which offer these types of training, participation rates in conferences, workshops etc., in job rotation and quality circles and in self learning are double ,or nearly so, those observed among enterprises in other size groups which offer these types of training. These results suggest two things. First, if a training culture exists within the enterprise then the rate at which employees participate is similar. Secondly, very small enterprises are more likely to take advantage of the newer forms of training which may compensate for some of the difficulties they face in offering courses to their worker.
The foregoing has focused on the types of training offered in the different size groups of enterprises for EU12 as a whole. Each of the different types of training will now be examined separately for differences between countries. Three indicators are used. The proportion of enterprises offering each type of training; the participation rate of employees in those enterprises offering the training; and the participation rate of all employees, including those working in enterprises not offering training.
1.3.1 Training courses
One possible conclusion to be drawn from this evidence, therefore, is that the chance an employee in different countries being sent on a training course is determined more by the extent to which employers in their country offers courses and less by variations in the intensity with which they do so. This is reflected in the differences between countries in the participation rates for all employees.
The relatively low participation rates for Germany requires some explanation. In the German survey, four sectors were excluded. In the rest of the EU, these four sectors employed over a quarter of all employees and were also ones which were above average both in the proportion of their enterprises offering training and in their participation rates. Had the Germany survey included these sectors, their overall participation rate in courses would most likely have been closer to the EU average of 28 per cent rather than the 24 percent actually observed.
Table 8
Enterprises offering training courses and participation rates-by Country
Enterprises Participation rates
offering (per cent)
COUNTRY training Employees in enterprises Employees
courses offering training in all enterprises (per cent)
Belgium 42 39 25
Denmark 79 41 32
Germany 60 28 24
Greece 13 26 13
Spain 21 39 20
France 48 45 37
Ireland 64 52 43
Italy 9 31 15
Luxembourg 50 33 25
Netherlands 46 33 26
Portugal 13 35 13
United Kingdom 58 47 39
EU12 43- -. 38 . ~ ~ : ' ' . ' . 28,
.,.
1.3.2 Training in the work situation
It is also interesting to note that in Spanish enterprises which offer CVT in the work situation, the participation rate is higher than that of similar enterprise in both Denmark and Germany - in contrast to the fact that a very much higher proportion of enterprises in Denmark and Germany offer this type of training.
Table 9
Enterprises offering training in the work situation participation rates-by Country Enterprises Participation rate
offering (per cent)
COUNTRY training in the Employees in Employees in all
work situation enterprises enterprises (per cent) offering training
Belgium 31 23 10
Denmark 58 23 15
Germany 57 19 16
Greece 5 13 3
Spain 10 28 7
France 36 30 17
Ireland 56 56 37
Italy 5 12 3
Luxembourg 26 22 11
Netherlands 21 28 12
Portugal 8 19 5
United Kingdom 68 55 47
EU12·· ~ ,. :38. 33 ·:·.
.· '20'
The effect of these differences on the overall participation rates of employees is to show the important role played by training in the work situation (or on-the-job training) in the United Kingdom and Ireland. In these two countries more than twice the proportion of all employees take part in this type of training than in any other country. The United Kingdom alone accounting for more than half of all participants in EU12 as a whole.
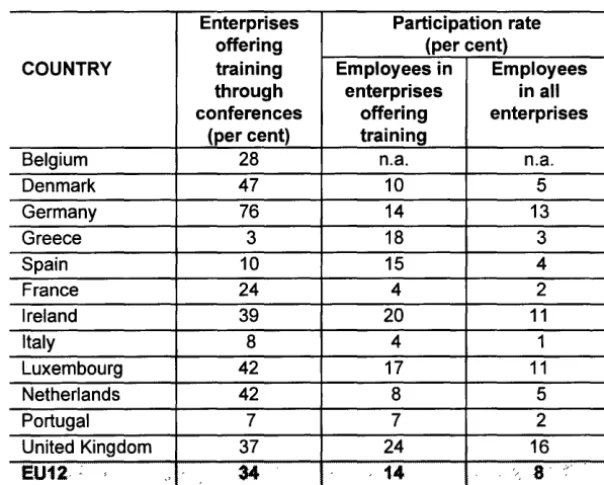
1.3.3 Conferences and workshops etc.
contrast, within the 3 percent of enterprises in Greece which offered these type of training, 18 percent of employees went on them.
Table 10
Enterprises offering training through conferences and workshops etc. and participation rates-by Country
Enterprises Participation rate
offering (per cent)
COUNTRY training Employees in Employees
through enterprises in all conferences offering enterprises
(per cent) training
Belgium 28 n.a. n.a.
Denmark 47 10 5
Germany 76 14 13
Greece 3 18 3
Spain 10 15 4
France 24 4 2
Ireland 39 20 11
Italy 8 4 1
Luxembourg 42 17 11
Netherlands 42 8 5
Portugal 7 7 2
United Kingdom 37 24 16
EU12- ~ ,, 34 ' 14
. -,-_a·;,·
1.3.4 Job rotation, quality circles etc.
Using the workplace as a learning environment has always been a way in which some employers will ensure that their employees develop a broad range of skills and knowledge relevant to the needs of the enterprises. The planned rotation of workers between jobs is a example. The use of quality circles as a way in which employees in a team share their knowledge and skills to improve their joint performance is a newer development. Because these types of training were combined in one question, the survey cannot be used to distinguish between the use of these two different types of training.
The answers to this question(see Table 11) in the survey, therefore, must be treated with some caution.
Table 11
Enterprises offering training through job rotation and quality circles and participation rates-by Country
Enterprises Participation rate
offering (per cent)
COUNTRY training Employees in Employees in all
through job enterprises enterprises rotation offering
(per cent) training
Belgium 18 n.a. n.a.
Denmark 28 6 2
Germany 18 5 3
Greece 2 10 1
Spain 4 15 1
France 20 3 2
Ireland 15 16 5
Italy 2 6 1
Luxembourg 12 13 4
Netherlands 9 10 3
Portugal 3 12 1
United Kingdom 19 25 11
EU12 14 ' "
11 4
"
For example, although a similar proportion (one fifth) of enterprises in France and the United kingdom offered these types of training, in these enterprises only 3 per cent of employees participated in them in France compared with 25 per cent in the United Kingdom. Such a difference would only seem possible if in the United Kingdom a high proportion of workers participated in quality circles since it is unlikely that anything approaching a quarter of workers could have participated in planned job rotation, exchanges etc. Denmark and Germany also had a similar pattern to that seen in France with a relatively high proportion of enterprises offering these learning opportunities but with low participation rates. In contrast, although only a small percentage of enterprises in Greece and Spain offered training through job rotation etc. the participation rates in thes~ enterprises, at 1 0 and 15 per cent respectively, were quite high.
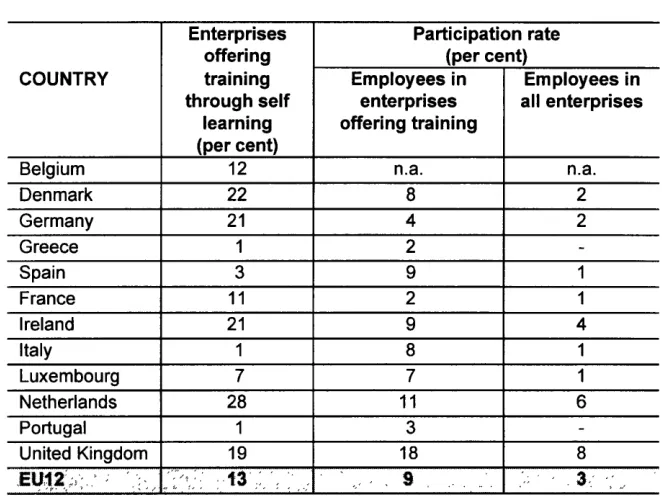
1.3.5 Self learning
Kingdom nearly a fifth or more of all enterprises offered this type of training. It was also supported - by between 7 and 12 per cent of enterprises in Belgium, France and Luxembourg. In the Mediterranean countries however, very few enterprises used this type of training in 1993.
COUNTRY
Belgium Denmark Germany Greece Spain France Ireland Italy
[image:30.579.135.466.238.487.2]Luxembourg Netherlands Portugal
Table 12
Enterprises offering training through self learning and participation rates-by country
Enterprises Participation rate
offering (per cent)
training Employees in Employees in through self enterprises all enterprises
learning offering training (per cent)
12 n.a. n.a.
22 8 2
21 4 2
1 2
-3 9 1
11 2 1
21 9 4
1 8 1
7 7 1
28 11 6
1 3
-United Kingdom 19 18 8
.El!~~>:.
, .
-~ ' / "'' ': '13 : ' ' ' ,., •,' 9 " . 3-:'-·
In those enterprise offering self-learning opportunities, the participation rate of employees is much less variable between countries. This is shown in Table 12. Only in the United Kingdom, which arguably has been in the lead in developing open and distance learning material was the participation rate in these enterprises, at 18 per cent, significantly above that of other Member States.
2 TRAINING COURSES
2.1
Introduction
Chapter 1 has looked at which enterprises offered training to their employees in 1993; the types of training offered and the proportion of employees who participated in each type. The focus of Chapter 2 is on the training provided through courses, whether internal or external. Although these types of training are perhaps the most structured of all the types examined, the focus on them in this chapter is not meant to imply that courses are in any way a better form of training than other methods used. Rather, it is because their more formal nature means that enterprises are more likely to have records about them. This meant that more questions to be asked for a fuller analyses to be made.
The additional information collected on training courses included;
• the sex and occupation of the participants and the duration of their training; • the subject matter of the courses;
• for external courses the types of training providers used to deliver the training;
• and the costs of training.
As before analyses are possible for different size groups and sectors of the enterprises and for each country separately. The only exception is that the question asking for the occupation of participants was not asked in the Netherlands.
2.1
Participation by gender and occupation
the Netherlands because the question was not asked in that country The CVTS therefore supports the evidence from other surveys which show that those who have the highest initial qualification and who are therefore more likely to occupy the more senior posts also have the most continuing training throughout their working lives.
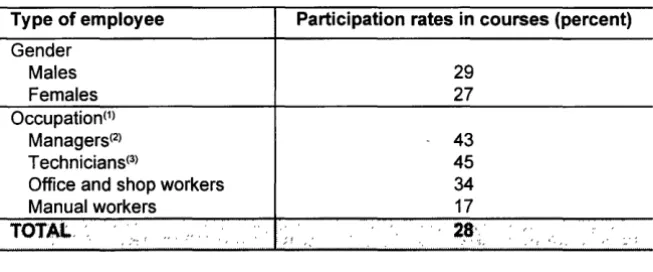
Table 13
Participation rates by gender and occupation, 1993 Type of employee
Gender Males Females Occupation<1l
Managers(2) T echnicians<3l
Office and shop workers Manual workers
TOTAL,-_ ,
(1) Excluding Netherlands (2) Including professional staff (3) Including associate professionals
Participation rates in courses (percent)
29 27
43 45 34 17
As was shown for all employees, the participation rates for the different groups of workers increased with the size of the enterprise but, relatively, women were rather more likely than men to participate in courses if they were in small enterprises and less likely to do so in the larger enterprises. When looking at the sectors however it would appear that the differences in the participation rates of men and women are often greater than for EU12 as a whole.
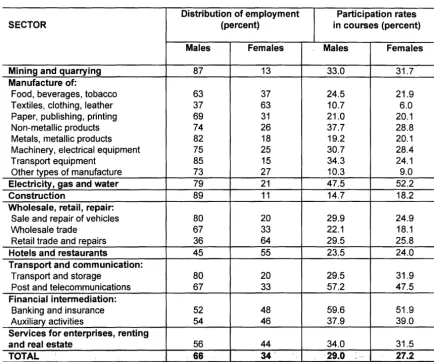
Table 14
Distribution of employment and participation rates in courses-by gender, 1993 Distribution of employment Participation rates
SECTOR (percent) in courses (percent)
Males Females Males Females
Mining and quarrying 87 13 33.0 31.7
Manufacture of:
Food, beverages, tobacco 63 37 24.5 21.9
Textiles, clothing, leather 37 63 10.7 6.0
Paper, publishing, printing 69 31 21.0 20.1
Non-metallic products 74 26 37.7 28.8
Metals, metallic products 82 18 19.2 20.1
Machinery, electrical equipment 75 25 30.7 28.4
Transport equipment 85 15 34.3 24.1
Other types of manufacture 73 27 10.3 9.0
Electricity, gas and water 79 21 47.5 52.2
Construction 89 11 14.7 18.2
Wholesale, retail, repair:
Sale and repair of vehicles 80 20 29.9 24.9
Wholesale trade 67 33 22.1 18.1
Retail trade and repairs 36 64 29.5 25.8
Hotels and restaurants 45 55 23.5 24.0
Transport and communication:
Transport and storage 80 20 29.5 31.9
Post and telecommunications 67 33 57.2 47.5
Financial intermediation:
Banking and insurance 52 48 59.6 51.9
Auxiliary activities 54 46 37.9 39.0
Services for enterprises, renting
and real estate 56 44 34.0 31.5
TOTAL ' 66 34' ·29.0 " 27 .. 2.
Table 14 also shows the distribution of employment between males and females within each of the sectors and how these might influence the overall training rates of the two sexes. For example, in the financial services sectors, in which training participation rates are high, nearly a half of all employees are
women. In contrast, in construction and many of the manufacturing sectors, in which participation rates are lower, men account for three-quarters or more of total employment. There are exception to this patter, particularly in enterprises concerned with the manufacture of textiles, clothing and leather which low participation rates and a high concentration of female employment
large, however. If the two sexes did have the same sector employment pattern then the gap between their observed participation rates is only widened from two to three percentage points; indicating that the sectors in which women's employment is concentrated gives them only a slight advantage in terms of their training opportunities.
A rather more significant effect was found when looking at the impact of the different occupational structures of men and women on their likelihood of participating in courses. This could not be done directly using the data from the survey because cross tabulations of gender and occupation were not possible. However, data from the Labour Force Survey show that, in the sectors of the economy covered by the CVTS, two thirds of office and shop workers are women while three-quarters of manual workers are men. Because office and shop workers were found to be twice as likely as manual workers to participate in training courses, women are generally more favourably placed than men to receive training. This is so despite the fact that among managers, professional and technical staff, which have the highest training rates, 55 percent are men and 45 percent are women.
The effect of these gender differences in occupational patterns is that the overall rate for women would have been nearly 5 percentage points higher than that of men if the two sexes had had the same occupation specific participation rates.
Because occupations are strongly associated with sectors the two effects noted above cannot be added together but it does seem possible to conclude that, in EU 12 as a whole, women are disadvantaged in their training opportunities to a far greater extent than is shown by the overall situation. In the sectors and occupations covered by the survey, the true difference in the participation rates of the two sexes is probably nearer to 7 percentage points than the 2 percentage point difference actually observed.
2.2
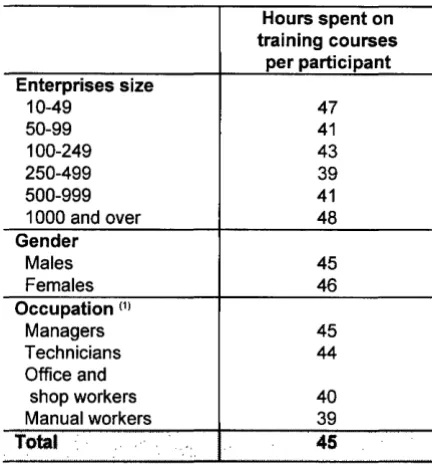
Duration of training coursesTable 15
Time spent on training courses per participant by size of enterprise, gender and occupation, 1993
Enterprises size
10-49 50-99 100-249 250-499 500-999 1 000 and over
Gender
Males Females
Occupation <1>
Managers Technicians Office and
shop workers Manual workers
Total
Hours spent on training courses
per participant
47
41 43
39
41
48
45
46
45
44
40
39
45
(1) Excluding France and the Netherlands
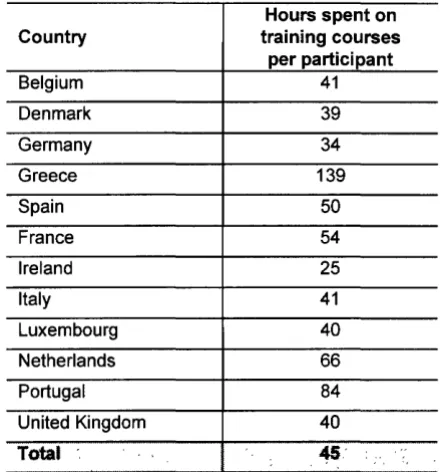
Much greater differences in the hours spent on training courses were observed between countries(see Table 16) and between sectors. In Portugal and Greece, countries which had the lowest participation rates, the average time spent on courses was 84 hours and 139 hours respectively - two and three time the average for all participants in EU 12. The high figure in Greece is attributed to the fact that many of the training courses are intensive programmes supported by the Commission's Social Fund. The same is also probably the case in Portugal. In contrast, the shortest duration of training courses was found in Ireland which had among the highest participation rates but in which the average duration was only 25 hours per participant.
Table 16
Time spent on training courses per participant by country, 1993
Hours spent on
Country training courses
per participant
Belgium 41
Denmark 39
Germany 34
Greece 139
Spain 50
France 54
Ireland 25
Italy 41
Luxembourg 40
Netherlands 66
Portugal 84
United Kingdom 40
Total ' '
45'
" -,This greater intensity of training in the smallest and sometimes also in the medium sized enterprises was usually found in the smaller Member States or those, with the exception of Italy, which had low participation rates. One possible reason for this is that small enterprises are playing a more important role in the development of the economies of these countries.
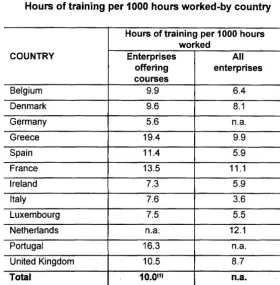
Table 17
Hours of training per 1000 hours worked-by country Hours of training per 1000 hours
worked
COUNTRY Enterprises All
offering enterprises courses
Belgium 9.9 6.4
Denmark 9.6 8.1
Germany 5.6 n.a.
Greece 19.4 9.9
Spain 11.4 5.9
France 13.5 11.1
Ireland 7.3 5.9
Italy 7.6 3.6
Luxembourg 7.5 5.5
Netherlands n.a. 12.1
Portugal 16.3 n.a.
United Kingdom 10.5 8.7
Total 10.0(1) n.a.
(1) Including data for the Netherlands based on hours worked in all enterprises
The results are interesting. As expected, within those enterprises offering training courses, the hours of training per 1000 hours of working time was highest in those countries which had the highest hours per participant, i.e. Greece and Portugal, even though the proportion of employees participating in courses in their enterprises was the lowest of all Member States. This ratio was also high in France where high participation rates combined with relatively high average durations of training. The low figure for Germany is explained by the small average amount of time per participant spent on courses in that country and, as already mentioned, because the survey in Germany excluded some of the sectors in which participation rates were high.
Expressing the hours of training as a ratio of all hours worked in the sectors covered by the survey, gives a measure of the relative total training effort of each country- at least as far as courses are concerned. Data are not available for all Member States but among those countries for which data are available, France with over 11 hours of training for every 1000 hours worked by all employees provided the most training in
offering training in Greece and the low participation rates, the very high duration of the training courses in that country resulted in Greece having the second highest ratio of training hours to total hours worked among those countries for which data are available.
[image:38.582.108.487.362.515.2]The largest variation in the time spent on training courses per participant was that found between sectors. Table 18 shows those sectors in which the average duration of training was either 50 hours or more per participant or less than 40 hours. The other sectors with average durations of between 40 and 50 hours were close to the EU 12 average of 45 hours. The high average duration in the textile, leather and clothing sector contrasts with the low participation rate found in that sector. The reverse situation is found in the mining and quarrying. Participation rates in this sector were above the community average but the average time spent on training courses was the lowest of all sectors.
Table 18
Time spent on training courses per participant-by sector, 1993
Sector Hours per participant
Textiles, leather and clothing 63
Electricity, gas and water 57
Manufacture of transport equipment 54
Post and telecommunications 52
Banking and insurance 50
Manufacture of metals, metal products 39
Auxiliary services 38
Sale and repair of vehicles 36
Paper and printing 35
Wholesale trade (except vehicles) 34
Mining and quarrying 28
2.3
Subjects of training
In the CVTS enterprises were asked to allocate the training time spent on courses to eight subjects together with an 'other' category for courses which either could not be allocated to one of the eight subjects or which may have combined more than one subject.
which accounted, respectively, for 13 and 10 per cent of training time were the next most important subjects covered. The proportion of training time spent on language training (4 percent) was the least among those subjects specifically identified in the survey.
[image:39.582.70.496.308.481.2]As Table 19 shows, the distribution of subjects did not vary to any great extent between the different sizes of enterprises. Comparing the smallest and largest enterprises, the smallest devoted a rather lower percentage of their training time to management, human resource development and languages and a higher percentage to training in accounts and finance.
Table 19
Distribution of time spent on training courses by subject, 1993 SIZE OF ENTERPRISE
SUBJECT (Number of employees)
10-49 50-99 100-249 250-499 500-999 1000+ -TOTAL
Management 7.7 11.4 10.5 13.6 10.3 10.4 ..
10.4-Human resources 3.8 4.4 4.5 5.4 5.3 5.8 _- 5.2
Safety 6.4 8.4 7.3 8.0 6.8 7.6 7.5
Data processing 13.1 9.4 12.1 13.9 12.8 13.0 12~7
Accounts/finance 8.0 7.0 5.2 5.8 6.5 3.9 '5.2
Marketing 7.5 8.0 8.1 6.2 6.9 7.3 7~3
Languages 3.0 4.6 4.4 4.5 5.5 4.2 . '
4 .. 2
Production 25.1 26.2 22.9 24.9 24.8 27.4 .. '26.1
Other 25.5 20.7 25.1 17.6 21.2 20.5 . ·21~5
TOTAL .. 100 100·'"' ,'//,# 100 '' 100·: '. -.··100: .100- ... ' ~0() .
Table 20
Hours of training courses per 1000 employees (all enterprises) by subject, 1993 SIZE OF ENTERPRISE
SUBJECT (Number of employees)
10-49 50-99 100-249 250-499 500-999 1000+
TOTAL
Management 485 852 1060 1609 1514 2163 1331
Human resources 237 326 451 644 770 1207 669
Safety 400 632 745 951 995 1593 954
Data processing 823 704 1229 1650 1879 2702 1633
Accounts/finance 502 520 522 689 958 814 . 662·
Marketing 468 600 820 731 1014 1511 933
Languages 185 342 448 534 805 874 542
Production 1577 1965 2319 2953 3630 5707 3340'
Other 1598 1551 2550 2086 3104 4281 2750
TOTAL
6276' ', ... 7492: .. 10144 11848 . . 14669' . ·20852 128.14Much bigger differences in the distribution of the subjects of training were found between sectors. The following analysis looks first at the proportions of training time spent on each subject, (their relative importance), within sectors.
Perhaps predictably, training in health and safety was particularly strong in those sectors where work is of a more hazardous nature or where issues of public health are important. Although in the EU as a whole only some 7.5 percent of training time was devoted to this subject the proportion was around 20 percent in the mining and quarrying and the hotels and restaurant sectors. And nearly twice the community average proportion was spent on health and safety in construction and the manufacture of food sectors.
The share of language training was highest, at twice the community average or more, in some industries within the manufacturing sector and also in wholesale trade; perhaps reflecting the increasing international competition and movements of goods within the community. Language was least important in the retail sectors and, more surprisingly, in hotels and restaurants.
Table 21
Relative importance of different subjects of training within sectors SUBJECT High proportion of training Low proportion of training time
time
Management -Retail trade -Post and telecommunications -Construction
Human resource -Post and telecommunications -Sale and repair of vehicles development
Health and safety -Mining and quarrying -Banking and insurance -Hotels and restaurants -Other financial services -Construction
-Manufacture of food
Data processing -Other financial services -Sale and repair of vehicles; -Gas, electricity and water -Hotels and restaurants -Real estate, renting etc.
-Post and telecommunications
Finance -Banking and insurance -Hotels and restaurants -Other financial services -Transport
Marketing -Wholesale trade -Construction
-Retail trade -Mining and quarrying -Banking and insurance
Languages -Manufacturing generally -Retail trade construction -Wholesale trade -Hotels and restaurants
-Sale and repair of vehicles
Production and -Textiles -Wholesale trade
maintenance of goods -Manufacture of transport -Hotels and restaurants
and services -Transport -Financial and business services generally
Other (not specified or -Sale and repair of vehicles -Manufacture of: mixed courses) -Hotels and restaurants Metals
Transport Textiles -Mining, quarrying
As was shown in the analysis by size of enterprise it will not always follow that a sector in which the proportion of time spent on a subject is high will necessarily spend more time on that subject per employee than another sector in the proportion is much lower because the overall levels of training in the sectors may be different. It should be remembered, also, that continuing training in some sectors may also be used to fill gaps in the skills obtained through the education and initial training systems.
safety was high, the actual time per employee was less than the average for the community as a whole.
The relative importance attached to training in different subjects between countries. The results shown in Table 22 in which the relevant percentages are also given. These are important for interpreting some of the analysis and this can be illustrated by looking at the relative significance of management training. This was high in both the United Kingdom and Germany. But because these are two of the largest countries within the EU they have a big influence on the community average. In fact, the proportion of training time devoted to this subject was below the community average in all other countries except Belgium.
Table 22
Relative importance of different subjects of training within countries
SUBJECT High proportion Low proportion of training time of training time
Management (1 0.4%) Germany (15.0%); Greece (5.0%); United Kingdom (12.5%) Luxembourg (4.6%) Human resource Denmark (16.9) Spain (2.9);
development Greece (3.4);
Luxembourg (2.3); Portugal (1.9) Health and safety Ireland (11.1); Spain (2.8);
United Kingdom (14.0) Germany (3.9); Italy (3.3); Portugal (2. 7) Data processing Belgium (17.3) Ireland (5.3);
Netherlands (5.4)
Finance Denmark (11.8); Luxembourg (2.6);
Germany (1 0.8) Belgium (3.2); Portugal (3.4); United Kingdom (3. 7)
Marketing Ireland (12.3); Denmark (3.4);
Spain (1 0.8); Netherlands (4.1 ); Germany (16.3) United Kingdom (3.9)
Languages Belgium (9.3); Ireland (1.4);
Spain (11.5); Netherlands (1.5); Luxembourg (1 0.0) Portugal (2.3);
United Kingdom (0.9) Production of goods Ireland (44.2); Denmark (8.3); and services France (43.6); Germany (10.7);
Greece (48.5); United Kingdom (1.7) Italy (44.7);
Netherlands (55.8); Portugal (45.8)
Other (not specified or Denmark (32.6); Belgium (6. 7); mixed courses) United Kingdom (45.1) Ireland (7.3);
France (7.3); Italy (4.0); Netherlands (7 .3)
Other significant features highlighted in Table 22 include the high proportion of training human resource development in Denmark, informatics in Belgium, finance in Denmark and Germany, and marketing in Ireland and Germany. The share of language training was high in Spain and Luxembourg but, probably for different reasons, low in the United kingdom, Ireland and the Netherlands.
externally. A distinction cannot be made directly, therefore, between the subjects offered on internal and external courses respectively when the enterprise offered both types. However, for enterprises in which all the training was through internal courses then the subjects of the training will apply only to this type; and similarly for enterprises only offering external training. Using this limited evidence it is possible to examine whether the subjects covered did vary between the two types of courses.
Such data are only available for the ten countries that provided micro data to EUROSTAT(i.e. excluding Germany and the Netherlands) For many of these countries the sample sizes available for this analysis are not large. Also, over half of all the hours of training in the ten countries provided both through external courses only and internal courses only were in the UK where different pattern were seen. Some general messages can be made, however.
It would appear that external trainers are more likely to be used for training in management techniques, finance and languages and, excluding the UK, in human resource development, and data processing. Conversely, training in production and maintenance skills and in marketing were more likely to be delivered through internal courses. A conclusion, therefore, is that subjects in which standards and requirement are externally set or where the skills obtained are more transferable between enterprises then the more likely they are to be provided by external trainers.
Training courses provided by the enterprise itself are more likely to be in subjects specific to the production and sale of the goods and services produced by the enterprise.
2.4 Providers of training courses