This is a repository copy of Measuring chronic multidimensional poverty. White Rose Research Online URL for this paper:
http://eprints.whiterose.ac.uk/117122/ Version: Accepted Version
Article:
Alkire, S, Apablaza, M, Chakravarty, S et al. (1 more author) (2017) Measuring chronic multidimensional poverty. Journal of Policy Modeling, 39 (6). pp. 983-1006. ISSN 0161-8938
https://doi.org/10.1016/j.jpolmod.2017.05.020
© 2017 The Society for Policy Modeling. Published by Elsevier Inc. This manuscript version is made available under the CC-BY-NC-ND 4.0 license
http://creativecommons.org/licenses/by-nc-nd/4.0/
[email protected] https://eprints.whiterose.ac.uk/ Reuse
This article is distributed under the terms of the Creative Commons Attribution-NonCommercial-NoDerivs (CC BY-NC-ND) licence. This licence only allows you to download this work and share it with others as long as you credit the authors, but you can’t change the article in any way or use it commercially. More
information and the full terms of the licence here: https://creativecommons.org/licenses/
Takedown
If you consider content in White Rose Research Online to be in breach of UK law, please notify us by
Accepted Manuscript
Title: Measuring Chronic Multidimensional Poverty Authors: Sabina Alkire, Mauricio Apablaza, Satya Chakravarty, Gaston Yalonetzky
PII: S0161-8938(17)30062-5
DOI: http://dx.doi.org/doi:10.1016/j.jpolmod.2017.05.020
Reference: JPO 6369
To appear in: Journal of Policy Modeling
Received date: 12-12-2016 Revised date: 9-4-2017 Accepted date: 17-5-2017
Please cite this article as: Alkire, Sabina., Apablaza, Mauricio., Chakravarty, Satya., & Yalonetzky, Gaston., Measuring Chronic Multidimensional Poverty.Journal of Policy Modelinghttp://dx.doi.org/10.1016/j.jpolmod.2017.05.020
Measuring Chronic Multidimensional Poverty
Sabina Alkire
Oxford Poverty & Human Development Initiative
University of Oxford, 3 Mansfield Rd, Oxford OX1 3TB, UK [email protected]
& George Washington University
1957 E St NW, Suite 502, Washington DC 20053, USA
Mauricio Apablaza
Facultad de Gobierno, Universidad del Desarrollo, Chile Ave. Plaza 680, Las Condes, Santiago de Chile
Satya Chakravarty
Indian Statistical Institute, Kolkata, India 203 B. T. Road, Kolkata - 700108
Gaston Yalonetzky *
University of Leeds, Maurice Keyworth Building Leeds LS2 9JT, UK
*Corresponding author
Abstract
This paper adopts a new approach to the measurement of chronic multidimensional poverty. It relies on the counting approach of Alkire and Foster (2011) for the measurement of
multidimensional poverty in each time period, and then on the duration approach of Foster (2009) for the measurement of multidimensional poverty persistence across time. The proposed indices are sensitive both to (i) the share of dimensions in which people are deprived and (ii) the duration of their multidimensional poverty experience. A related set of indices is proposed to measure transient poverty. An empirical illustration is provided for Chile between 1996 and 2006.
Keywords: Chronic poverty, Multidimensional poverty, Multidimensional poverty indices, Poverty dynamics, Transient Poverty, Chile
1. Introduction
Sen (1976) argued that an index of poverty should identify persons who live in poverty and
measure the extent of individual poverty. His seminal contribution inspired numerous proposals
of unidimensional indices of poverty based on cross-sections of income or consumption data. It
continues to inspire policy frameworks such as the Sustainable Development Goals, whose first
goal seeks to ”end poverty in in all its forms”, with the clear pledge that “no one will be left behind” (UNGA 2015, pp. 2, 15).
In order to leave no one behind it is necessary to redress poverty ‘in all its dimensions’ among
the long-term poor as well as the recently poor, or the episodic poor. It could be useful to
analyse whether the drivers of poverty reduction differ for poor groups who have experienced
different durations of poverty: There is evidence that the socioeconomic covariates of poverty
vary between chronic and transient poverty experiences (Jalan and Ravallion, 2000), and that
common covariates may have differential effects depending on the duration of poverty
(Bayudan-Dacuycuy and Lim, 2014). If transient poverty rather reflects vulnerability to
occasional undesirable fluctuations in well-being (Ward, 2016), whereas chronic poverty reflects
a more fundamental inability to raise long-term living standards (McCulloch and Baulch, 2000),
then identifying the chronically and transiently poor populations is of paramount importance for
policy responses (Lybbert et al., 2004; Carter and Barrett, 2006).
The duration of poverty at the individual or household level is also a crucial issue for
understanding how people experience poverty. Persistent conditions of insufficiency might
precipitate detrimental effects on well-being. For instance, an increase in the duration of poverty
increases the likelihood of impairment and illness. A person stricken by long-lasting poverty can
become socially excluded and/or lose allegiance to the wider community (Walker, 1995). This, in
turn, may lead to social unrest (Salvatore, 2007). Likewise, chronic insufficiency of income may
be the main driver of multiple deprivations in non-monetary dimensions of wellbeing
(Mahadevan and Hoang, 2016). Therefore it often becomes desirable to measure and analyse
individual poverty dynamically using panel data.
An important recent development in poverty measurement research has been the definition of a
robust multidimensional framework. The reason for its emergence is that well-being depends on
both monetary and non-monetary dimensions of life (see Kolm, 1977; Streeten, 1981; Sen, 1985,
1987; Anand and Sen, 1997; and Foster and Sen, 1997). Examples of non-income dimensions
are housing, schooling, nutrition, etc. A person with a sufficiently high income may not always
achiement are not related with income. It may not be possible to trade off income and some
non-income dimensions. It also may be necessary to develop policies to address specific
deprivations or combinations of deprivations. If so, then the construction of a multidimensional
poverty index and its analysis may be worthwhile. Besides these intrinsic reasons to consider
monetary dimensions of life for poverty alleviation policies, collecting information on
non-monetary indicators is usually cheaper and more accurate than surveying income or
consumption. Addtionally, this kind of indicators can reduce the leakages from geographic
targeting (Bigman and Srinivasan, 2002) and analysis focused on population subgroups, such as
child poverty (Roelen et al., 2010). In fact, this is the very reason why some countries use a score
based on non-monetary indicators as elegibility criteria for their numerous poverty alleviation
programs.
It is extremely important to combine these two approaches for the study of chronic
multidimensional poverty. Hulme et al. (2001) and Hulme and McKay (2008) argued explicitly
that the measurement of chronic poverty should focus on multidimensional situations. ‘Chronically poor are commonly multi-dimensionally deprived’ (CPRC, 2004-5, p. 6). Furthermore, interesting analysis can be carried out when chronic and transient poverty
measures are broken down by dimension. For example, one can perform an analysis to see
whether chronic poverty has distinctive components that may comprise ‘poverty traps’.
Empirically, Baulch and Masset (2003) show that low-performance in monetary indicators can be
less persistent than non-monetary indicators (e.g. child malnutrition or school attendance), which
could lead to underestimation of the prevalence and intensity of chronic poverty. This further
justifies the assessment of multidimensional poverty from a dynamic perspective emphasizing
different poverty duration experiences.
This paper extends the Alkire-Foster multidimensional counting approach to the measurement
of chronic poverty using the Foster (2009) duration approach. The latter is chosen because it is
parsimonious and easy to understand, and is based on the same axiomatic foundations as the
Alkire-Foster family of multidimensional poverty indices. Moreover, unlike other inter-temporal poverty approaches, Foster’s identification criteria explicitly identify the chronically poor; but can easily be adjusted to identify the transiently poor – which is useful when analysing determinants of
poverty reduction. The Alkire-Foster (2011) approach has the practical advantage that it can be
computed with ordinal or ratio-scale data and is widely applied. We discuss policy applications of
our class of indices so that they can be treated as a tool for understanding the sources of poverty.
Such an analysis enables us to figure out origins of poverty at a more disaggregated level. Using
fight it. Alternatively, we can carry out the analysis with the Bourguignon-Chakravarty (2003)
index which also qualifies as a satisfactory indicator of multidimensional poverty and possesses
these characteristics (see Duclos and Tiberti, 2016).
In a nutshell, our class of chronic multidimensional poverty measures identifies the poor in three
stages. Firstly, we apply deprivation cut-offs to each person’s achievement vector to determine
the indicators in which they are deprived. Secondly, we identify each person as
multidimensionally poor or non-poor in each period based on their weighted deprivation score.
Thirdly, we count the periods in which each person experienced multidimensional poverty. We
identify as chronically multidimensionally poor those persons who have experienced
multidimensional poverty in at least the number of periods specified by the analyist or
policymaker. Our measurement method also generates a range of intuitive and consistent partial
and sub-indices. These include the incidence and intensity of chronic multidimensional poverty
and the censored headcount ratios from the Alkire-Foster method. New statistics include the
average duration of poverty and the average duration of deprivation in each indicator, as well as
period-specific indicators of incidence and intensity. Thus, our method proposes a way to
identify and evaluate the experience of the chronically poor in a multidimensional sense.
Our proposed measurement approach is unique across the literature in the way it combines the
multidimensional counting approach to poverty in any given period with the duration approach
to chronic poverty. Other notable contributions either adopt a multidimensional counting
approach without identifying the chronically poor (e.g. Nicholas and Ray, 2011), identify the
chronically poor without adopting a multidimensional counting approach (e.g. Jalan and
Ravallion, 1998; Foster, 2009; Foster and Santos, 2014; Porter and Quinn, 2014), or measure a
concept of inter-temporal poverty with one continuous indicator (usually income or
consumption) and without distinguishing between the chronically and transiently poor (e.g.
Hojman and Kast (2009), Bossert et al. (2012), Gradin et al. (2012), Hoy and Zheng (2011), Dutta et al. (2013), Mendola and Busetta (2012), D’Ambrosio (2013), Bossert et al. (2014)). Nicholas et al. (2013) do propose a class of measures combining a multidimensional counting
approach with an aim to identify the chronically poor. However the manner in which they
identify the poor is fundamentally different from our method. Among other things, in their
framework, they skip the intermediate step of identifying the multidimensionally poor in each
period, as well as the measurement of distributional intensity. .1
We illustrate the usefulness of our measurement framework with an empirical application to
Chile, relying on its CASEN dataset. The case of Chile is particularly interesting. After the
Pinochet regime, the country experienced high levels of GDP growth, improvement in welfare
and reduction of income poverty. The income poverty rate halved, from 45.1% in 1987 to 23.2%
in 2006 and average GDP growth reached 7.9%.
As of 1997, the Asian crisis slowed down the expansion of the economy and the pace of poverty
alleviation. In 1999, the economy shrank by almost 1% and poverty reduction only reached 0.75
points per year in the period 1998 to 2000. Conversely, after 2000, strong economic growth and
a set of well-targeted public policies reduced the incidence of poverty from 20.2% in 2000 to
13.7 in 2006.
In early 2002, a programme called “Chile Solidario” concluded a contract between families and
the State. Families committed to meet 53 minimum conditions to overcome extreme poverty and the State was to provide “psychosocial support, protection bonds, guaranteed cash subsidies, and preferential access to skill development, work and social security programmes” (Packard, 2004; Palma and Urzua, 2005). Implicitly, poverty alleviation policies were linked to
multidimensional strategies of poverty identification and intervention. However, traditional
poverty measurement was still only based on monetary indicators.
Despite further improvements in levels of income, targeted policies proved to be less effective in
reducing traditional poverty after 2006. The consolidation of a persistent type of extreme income
poverty which is less related to economic development presented a new challenge for public
policies. Additionally, during the last decade, traditional income measures have been questioned
in Chile. Civil society and academia showed how limited the association of these measures is
with people’s perception (FNSP, 2010) and that there is a lack of up-to-date techniques and
institutions for poverty measurement (CMP, 2014). The use of a consumption bundle from 1987
and external corrections to the income levels are but two examples.
The implementation of a multidimensional poverty measure might help not only the
understanding but also the reduction of poverty. In fact, in 2014, the Chilean government and
civil society presented a complementary measure of poverty. The new multidimensional
measurement of poverty comprises information on education, health, housing and employment.
However, only a longitudinal measure can capture the persistent characteristics of poverty in a
broader time perspective. Multidimensional analysis of chronicity provides information on
families that remain in poverty and it helps the policy maker to acknowledge and learn from
The next section presents some notation and definitions. Section 3 introduces our class of
chronic multidimensional poverty measures. We also introduce a family of transient
multidimensional poverty measures. Section 4 discusses the policy relevance of key properties
fulfilled by the class of chronic multidimensional poverty indices introduced in the previous
section. Section 5 offers two empirical illustrations that use ratio scale and, separately, ordinal
variables, using the CASEN panel datasets in Chile with observations for 1996, 2001, and 2006.
Section 6 concludes.
2. Preliminaries
We have observations on dimensions or attributes of well-being for a set of individuals at
different time points. Let stand for the quantity of attribute possessed by person in
period . Let stand for the arithmetic mean of . It is assumed that .
Let denote the matrix whose ith row is the row vector
. is the
achievement matrix in period . The distribution of attribute in period is represented by the column vector .
2.1 The Alkire-Foster dual-cutoff approach to the identification of the multidimensionally poor
In this multidimensional set-up, a deprivation cut-off is defined for each attribute; these are
fixed across periods. These deprivation cut-offs give the minimal quantities necessary to be
non-deprived in each attribute. Let be the vector of deprivation cut-offs in
different periods and . Person is regarded as deprived in dimension in period if . Person is non-deprived in dimension in period if . Note that deprivation cut-offs can be applied to ordinal or cardinal data.
When some data are ordinal or binary – a common situation in multidimensional poverty
measurement – we create an deprivation matrix for period ; , whose typical
element, , takes the value of 1 if , and 0 if . If all data are cardinal,
we create an powered deprivation gap matrix for period , whose typical
element, , is constructed as follows. For any triplet , let
is:
, where . Clearly, individuals deprived in at have a positive
deprivation gap, whereas otherwise . Since we are using the Alkire-Foster method
of identification and aggregation, we use .
Different dimensions can be assigned different positive weights in order of importance, such
that , where is the non-negative weight assigned to dimension .
Identification of the multidimensionally poor in period proceeds according to the following
steps. Having defined a d-dimensional column vector of weights: , we
generate an -dimensional counting vector, . A typical element of , e.g. ,
gives the weighted sum of deprivations for person in period . Formally,
.2
Following Alkire and Foster (2011) we identify the multidimensionally poor using a second
poverty cutoff , which is defined as the share of total dimensions in which a person must be
deprived in order to be identified as poor, thus . Hence if
min , we obtain the union method of identification. And yields the intersection method.3
We apply this cutoff to generate an N-dimensional identification (column) vector for period , , such that a typical element,
, is defined by:
.4 The
identification vector elements take two values: 0 and 1. The entry if and only if
individual is multidimensionally poor, according to deprivation cut-offs , weights and
poverty cut-off ; and otherwise.
2.2 The duration approach
Having identified the poor in every period, the next step is to identify the chronically poor. As
mentioned above, we assume that the attribute quantities have been appropriately transformed
to take into account variations across time periods (e.g. due to discount factors) and hence for
each dimension a common threshold can be used. Let be the vector of
common deprivation cut-offs.
2 Recall that when individual is deprived in dimension .
3 For a discussion of counting poverty identification methods see Alkire et al. (2015).
4 is an indicator function whose value is 1 if and only if is true. Otherwise, it is equal to 0.
Given the Alkire-Foster method of identification of the multidimensionally poor, Foster’s (2009)
duration approach says that a person is chronically poor if she remains in poverty for at least a
certain proportion of the total number of time periods, (that is, ). We refer to
as the duration cut-off. Thus, this is a triple-cutoff approach.
We apply the deprivation cut-off across the number of periods in which each individual is
multidimensionally poor. First, we count the periods of poverty by constructing a
matrix, in which each of the t column vectors is the identification vector for the tth period,
. Then we generate the -dimensional chronic counting vector, , whose typical
element, , gives the proportion of periods in which person is
multidimensionally poor for a given . Finally, we apply the cut-off to the chronic counting
vector, to identify the chronically poor. We generate an N-dimensional column vector, , for the identification of the chronically poor, such that a typical element,
,
is defined by: . if and only if individual is
chronically multidimensionally poor, according to deprivation cut-offs , weights , poverty
and duration cut-off .5
Finally, let denote the achievement matrix for all periods. For a given
and , we denote the set of all inter-temporal achievement matrices of the form by .
3. A class of chronic multidimensional poverty measures
Closely following the functional forms proposed by Alkire and Foster (2011) and Foster (2009),
we propose the following normalized population average of powered deprivation gaps, in which
only the deprivation gaps of the chronically poor are considered. In essence, this measure is the
mean across people and time of the weighted sum of deprivation gaps, , which are
censored for individual if :
(1)
Where, is the transpose of , is a N-dimensional column vector whose typical
element is , and is the transpose of , i.e. a N-dimensional row vector
whose typical element is as defined in section 3.b. An alternative way
of writing is:
(2)
is the population sum of powered censored normalized deprivation gaps divided by the maximum possible value, ; which arises if and only if
, for .6 If then the maximum is attained if and only if
.
is an extension of the Alkire-Foster multidimensional poverty index to chronic poverty and is an extension of the Foster index to the multidimensional space. can be expressed in terms of intuitive partial indices that convey meaningful information on different features of a society’s experience of chronic multidimensional poverty. We focus particularly on the first measure in
our class, the adjusted headcount ratio of chronic multidimensional poverty, , because it can
be constructed using ordinal data. The multiplicative decomposition is the following:
Where is the headcount ratio of chronic multidimensional poverty, the percentage of the
population that are chronically multidimensionally poor according to and :
is the average intensity of poverty among the chronically multidimenisonally poor, or the share of weighted deprivations that chronically poor people experience in the periods in which
they are multidimensionally poor:
reflects the average duration of poverty among the chronically poor (i.e. ) – the average share of periods in which they experience multidimensional poverty:
It may also prove useful to assess the duration of dimensional deprivations among the
chronically poor. Construct an censored deprivation duration matrix , whose typical
entry reflects the share of periods in which person was chronically poor (by and )
and was deprived in dimension . For the chronic poor, in each dimension,
whereas for non-poor persons in all dimensions. Thus, the matrix has at least one
positive entry for rows, while the rest of the rows, corresponding to people who are not
chronically poor, only have zeroes.
Then the dimensional duration index for dimension is:
The value of provides the average percentage of periods in which chronically poor people
are deprived in dimension . The relationship between the weighted mean across all and the
adjusted headcount ratio of chronic multidimensional poverty is elementary:
And:
Another interesting relationship between the adjusted headcount ratio of chronic poverty and
partial indices pertains to per-period censored headcount ratios. These represent the proportion
of people who are chronically poor and deprived in dimension in period :
Across time, the inter-temporal or longitudinal censored headcount ratio can be defined as:
where is the percentage of individuals who are chronically poor and deprived in at least one
period in dimension j over the total population. is the average duration of that deprivation
dimension to overall chronic poverty in period . Of tremendous advantage for policy: our
chronic multidimensional poverty adjusted headcount ratio across all periods is simply the mean
of the weighted average censored headcount ratios across all periods:
When data are ratio scale and , we compute the adjusted poverty gap, , which can also
be expressed as follows in an analogous way:
Where:
That is, is the average normalized gap that chronically poor people experience in those
dimensions in which they are deprived. Likewise, when data are ratio scale and , the
adjusted squared gap measure of chronic poverty, , is expressed as the product of the
following partial indices:
Where:
That is, is the average severity, or squared gap, that chronically poor people experience in
those dimensions in which they are deprived.
4.1 A class of transient multidimensional poverty measures
Using the same framework we also propose a family of indices of transient (multidimensional)
poverty, . The main difference between the two families is in the identification of the poor.
We identify a person as transiently poor if . Hence we use a different
N-dimensional vector, , for the identification of the transiently poor, such that a typical
if, individual is transiently multidimensionally poor, according to deprivation cut-offs ,
weights , multidimensional cut-off and duration cut-off . The family is:
(3)
An alternative way of expressing is:
(4)
4. Policy relevance of key properties
The class of indices satisfies a set of desirable properties included in Alkire
et al. (2014). In this section we discuss the policy relevance of a handful key properties. Firstly,
all indices in our class fulfil Additive Subgroup Decomposability (ASD), which implies that for
any partitioning of the population into subgroups, overall chronic poverty is given by
the population-share weighted average of the subgroup chronic poverty levels. Thus, if chronic
poverty in one subgroup decreases (increases), while remaining unchanged in other subgroups,
then global poverty falls (rises). For designing poverty alleviation policy it becomes appropriate
to isolate the population subgroups and/or dimensions that are more afflicted by chronic
poverty. Given that fulfils ASD, the percentage contribution of subgroup to total
poverty is given by
(where represents subgroup). Total chronic
poverty will reduce by this percentage if poverty in subgroup is eliminated.
Secondly, when , the index satisfies a dimensional decomposability condition which says
that the overall index can be expressed as a weighted sum of chronic dimensional indices
(Chakravarty et al.,1998). The percentage contribution of dimension to the overall index is
given by
. These statistics become helpful in identifying the dimensions that
contribute more to the overall chronic poverty and hence in formulating relevant anti-poverty
policies.
Thirdly, when , the indices satisfy a property of chronic strong transfer (CHTS), whereby
a reduction in the degree of inequality among the poordecreases the value of the index.
whenever the attributes are measured with cardinal variables, in the sense that the poverty index
will decrease further whenever people suffering from more acute deprivations are targeted first.
Generally, a complementary form of prioriin atiziation of the poorest among the poor, for policy
purposes, can also be achieved for any , by a combination of: (1) increasing the value of
any deprivation cut-off ; (2) increasing the value of the multidimensional cut-off ; and/or (3)
increasing the value of the duration cut-off ; (3). Any of these three adjustments is bound to
keep or reduce the value of the chronic poverty index, thereby identifying a narrower, but more
chronically deprived, group of people.
5. Empirical illustration
We illustrate the usefulness of our class of chronic multidimensional poverty indices with a
case-study of Chile, relying on a panel dataset with data points in 1996, 2001 and 2006. We provide
one empirical illustration with ordinal variables and another one with cardinal variables. The next
subsection discusses the data and the choice of well-being indicators. Then the application with
ordinal variables is presented, followed by the application with cardinal variables. We also
provide estimates of dimensional and period contributions to overall chronic multidimensional
poverty. This section illustrates the proposed indices, and provides tables and figure showing its
consistent partial and sub-indices. It does not propose an ideal set of indicators or index
specifications for use in policy.7
5.1 Data and indicators
The CASEN (National Survey of Economic Characterization) panel follows households in three regions (covering 60% of Chile’s population) in three rounds: 1996, 2001 and 2006. The panel survey began with a representative subsample of 5,209 households (20,942 individuals) based on
the cross-sectional survey of 1996.8 Three GDP growth experiences can be identified in the
period in question. First, 1996 marks the beginning of one of the most successful decades of
7 To do so it would be necessary to clarify the purpose of the exercise, to justify the selection of the unit of identification, indicators, and deprivation cutoffs, both normatively and in light of the changing composition and demographic structure of households in the panel.
GDP growth and income poverty reduction in Chile (Contreras, 2003; Contreras et al, 2001). In
2001 the country suffered from the negative impact of the Asian crisis (Corbo and
Schmidt-Hebbel, 2010), and in 2006 a public policy response to lower growth rates was implemented
(Galasso, 2011; Glick and Menon, 2009).
We provide two illustrations of the chronic poverty indices. In the first illustration we use
ordinal, categorical or binary variables, and hence calculate only and . In the second,
three continuous variables are used, hence we can potentially compute and for any
value of , thus generating information on the breadth and severity of chronic poverty.
We use three equally-weighted dimensions: education, housing and employment/income. The
selection of dimensions and indicators is consistent with the national measure of
multidimensional poverty of 2014. There are only two important differences. First, we excluded
the health dimensions due to the lack of comparable objective data. Second, we included income
levels into the multidimensional measure to capture short-term changes in the labour market.
Additionally, with the help of the traditional framework the income level allows us to foresee the
ability of a family to reach a basic food basket and consequently meet its caloric needs.
The selection of indicators is also related with the public policies implemented by the programme “Chile Solidario” and our indicator choices were partly guided by the reliable information available in the dataset, across years. Each dimension comprises information on
and long-term indicators. In education, for instance, school attendance captures
short-term changes in public policies and schooling can be improved only in the longer run. For the
ordinal illustration three equally-weighted indicators are selected in each dimension; for the
cardinal illustration one indicator is used per dimension. Table 1 presents the indicators for both
illustrations together with their uncensored headcount ratios.
5.2 Ordinal illustration
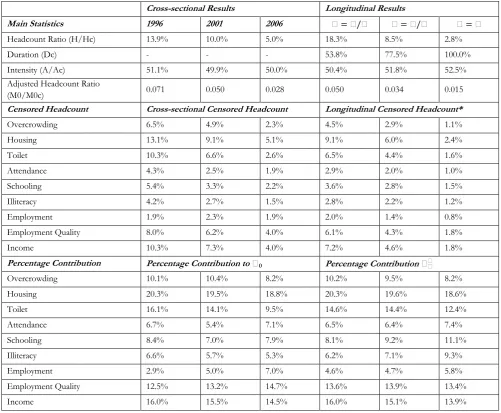
Table 2 shows the longitudinal results of chronic multidimensional poverty using the ordinal
specifications and with . Cross-sectional multidimensional poverty falls from 0.071 to
0.028 between 1996 and 2006. Most of the improvement is due to a lower headcount ratio.9 The
largest contributors to multidimensional poverty are housing, toilet, overcrowding, quality of
employment and income.
The longitudinal results show that under the time union approach ( ), 18.3% of the
population is poor, experiencing poverty spells during 53.8% of the periods in 50.4% of the
possible dimensions.10 The chronic adjusted headcount ratio in this case is 0.05. When ,
only 2.8% of the population is chronically poor and in 52.5% of their dimensions.
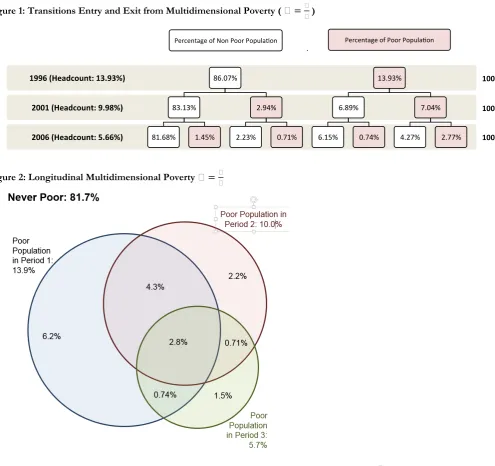
Figure 1 displays the transitions into and out of poverty spells in a way that highlights the
connection between the year-specific poverty headcounts and their chronic counterparts for
different choices of , similar to the Venn diagram in Figure 2.
For instance, with , the chronic poverty headcount of 18.3% is equal to the headcount
of 1996 (13.93%) plus the new poor in 2001 (2.94%) and the new poor in 2006 (1.45%).
With , the chronic poverty headcount is compounded by those who were always poor
(2.8%). The longitudinal intersection approach suggests that with , the chronic poverty
headcount of 8.5% is equal to the percentage of individuals who are always poor (2.8%) plus
those who were poor in the first and last period (0.74%) and those who became poor in the
second period and remained in that condition until the last period (0.71%).
Following Figure 1 and Figure 2, we can compute different headcount ratios of chronic and
transient poverty using different time cut-offs. For each group of poor people we can also
compute measures of incidence, duration and intensity using the methods described in Section 4.
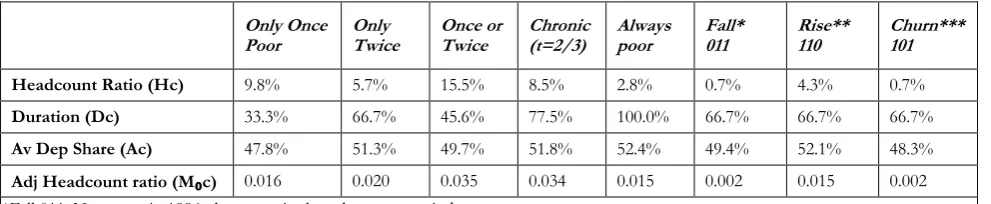
Table 3 shows the adjusted headcount ratio and its components for different groups of poor
people identified by different criteria of chronicity and transiency, and Figure 3 depicts the
headcount ratio with confidence intervals at 95%. Clearly, transient poverty is more prevalent
than chronic poverty, although the average intensity of poverty (second-to-last row in Table 3) is
lower among the chronically poor in this Chilean case.
Additionally, we can assess the contribution of each deprivation to the adjusted headcount ratio
of each one of the above poverty groups. The contributions are based on the censored
headcounts, i.e. the proportions of people who are poor (e.g. chronically or transiently) and
deprived in a specific variable.
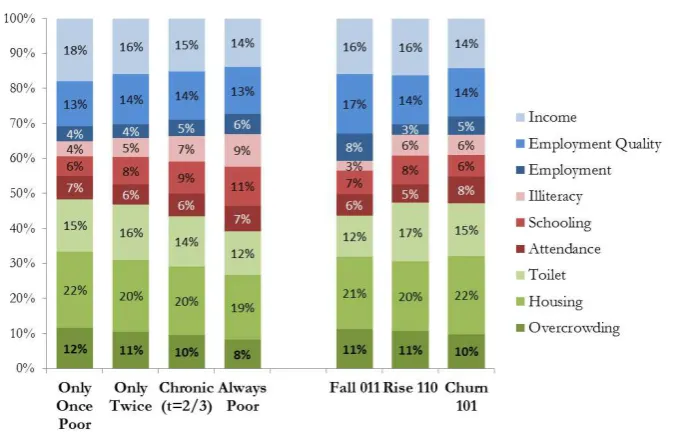
Figure 4 shows the composition of poverty among those groups. Interestingly, we can see that
those who fall into poverty have much larger deprivations in employment, suggesting that many
of them lost their jobs. Among the always poor we see the highest contribution of the education
deprivations, suggesting either that measured education is a stock variable, or that there were few
educational opportunities for those who dropped out of school. More censored headcounts and
relative contributions, for different choices of and are available in Error! Reference
source not found. in the Appendix of Alkire et al. (2015).
The contribution results are based on the longitudinal censored headcount of each indicator, and
they can be calculated as the average of censored headcounts across time for those individuals
living in each condition of chronic or transient poverty. We now present the new statistics that
capture explicitly the duration of the deprivation.
Figure 5 shows the duration of the deprivation in each dimension () at the national, urban
and rural levels.11 The figure shows the persistence of each deprivation among those individuals
who are identified as chronic multidimensional poor. On an average, an individual in chronic
multidimensional poverty is deprived in overcrowding 34% of the periods. For urban and rural
areas, the respective values are 43% and 25%. Housing shows the highest duration at the
national level. The duration of deprivation is higher in urban areas for overcrowding, school
attendance, employment and income.
Figure 6 plots the level and duration of dimensional deprivations among the chronically poor.
The vertical axis shows the percentage of people who are chronically poor and deprived in each
indicator for at least one period ( ). The horizontal axis shows the average duration of the
deprivation in this indicator ( ). For instance, more than the 8% of the population have
experienced housing deprivation and chronic poverty; on an average, they have been deprived in
housing for 74% of the periods. It is important to note that the percentage of individuals
deprived in employment and illiteracy are similar (around 3%). However, illiteracy is a more
persistent deprivation.
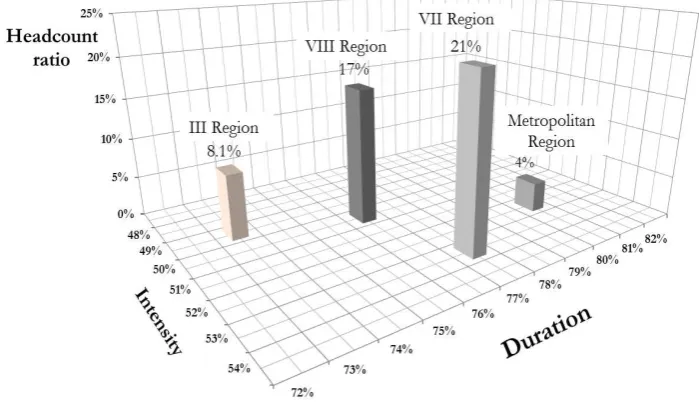
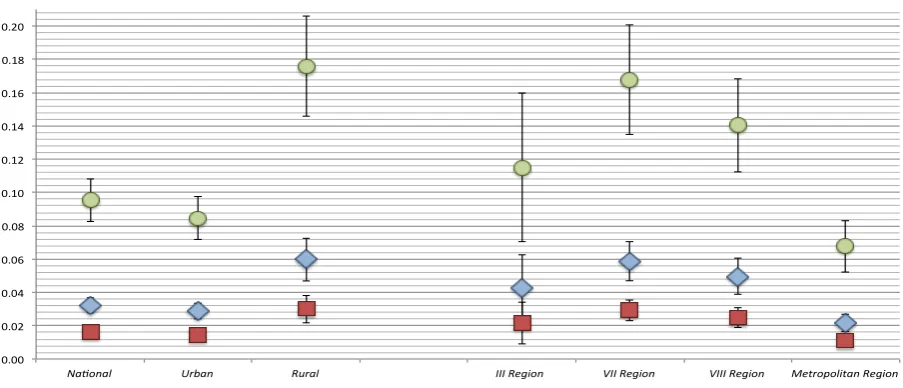
Finally, Figure 7 illustrates a three-dimensional graphic of four regions according to the average deprivation share (A ) – or intensity, the duration of poverty, and the chronic poverty headcount
(k
). The metropolitan region has the lowest headcount but the highest duration and an intermediary intensity. Compared to the metropolitan region, the III region has twice the percentage of poverty but with a lower duration and intensity. Region VII has the highest proportion of chronically poor people (nearly 21%), but its duration is below that of the Metropolitan region. In each case, the volume represented by the headcount times the duration times the intensity represents the level of multidimensional poverty.
have illustrated the possibility of examining the duration of chronic poverty across subnational
regions or dimensions (or both). Such information from a well-specified measure may indeed provide powerful and useful in policy, particularly for those seekng to ‘leave no one behind’.
Results suggest that 2.7% of individuals remain in poverty in all periods and they are mainly
deprived in housing and employment. Chronic poverty is not only related to the economic cycle
through unemployment and income, but also to the capacity of a family to find a dwelling with a
set of minimum characteristics. The analysis by indicator highlights the persistence of deficient
housing and toilet facilities, especially in rural areas (VII and VIII region). Interestingly, it also
informs on difficulties to meet a minimum income and basic employment conditions.
5.3 Cardinal illustration
We now turn to illustrate the additional analyses undertake when variables are cardinal and
using the three variables described in Table 1: income, schooling, and overcrowding.
Beginning with the previous measure in which =0, Figure 8 and 4 show the headcount ratio
for all possible combinations of poverty () and time () cut-offs. A double union approach
( and ) identifies 49.4% of the population as chronically poor with an average
duration () of 58.1% periods and an intensity () of 43.0%. On the other extreme, a double
intersection approach ( and ) identifies only 0.05% of the population as chronically
poor, with an average duration and intensity equal to 1. With an intermediate approach of
and , 5.5% of the population would be identified as chronically poor with an intensity of
72.1% and a duration of 72.0%.
4 presents the findings for all values of the poverty and duration cutoff combinations, and for . We saw in the ordinal illustration how to interpret the headcount ratio, average duration of chronic poverty, and average intensity of deprivation among the chronically poor.
26.5%. This means that on average, poor people’s achievements fall 26.5% below the
deprivation cutoff in their indicators, in the periods in which they were poor and deprived in
each indicator. We see, sadly, as the poverty cutoff and duration cutoffs rise, that the average gap
increases. That means that the people who are deprived in a greater share of deprivations, and
experience those deprivations for a longer duration, on average have achievements that fall
shorter and shorter of the deprivation cutoffs of each indicator. This is not necessarily intuitive. We
know that intensity rises as rises. Yet we might reasonably expect that the people who are
deprived in several dimensions (or over long periods) fall less short of the deprivation cutoff
than those with fewer periods and deprivations, not more. This analysis brings into view a
finding which, if replicated in different datasets, is indeed troubling but policy-relevant to leaving
no one behind: the chronically poor are more deeply deprived in breadth as well as intensity.
Moving now to the squared gap, we see as expected that it follows the gap and increases across
cutoffs. However if we were to compare the ratio of the measures, we would see that the
squared gap increases only mildly with increases in the poverty and duration cutoffs, relative to
the normalized gap. Thus, in this dataset, the inequality among the poor exists, but is relatively
low. Put differently, there are relatively few poor people whose achievement levels are
dramatically beneath the average normalized gap. This is quite a meagre achievement, however,
given the extent and duration of deprivations and their average gap shown by the other
indicators.
Figure 6: Indicator Censored Headcounts (H_ch) and Duration (D_ch) of Chronic Poverty
3 2
,
9 3
k
Figure 7: Chronic Multidimensional Poverty by Region ( 3
9
k , 2
3 )
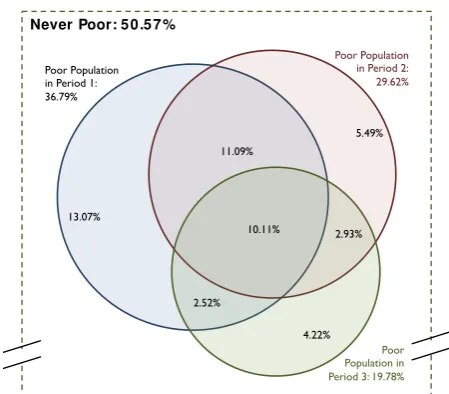
Figure 9depicts the same transitions as were presented for the ordinal case, for the case of identification of who is poor using a different measure, with only three indicators. We see that
10.1% of people are multidimensionally poor in all three periods whereas 49.4% of people are
multidimensionally poor by a union approach, in at least one of the three.
Figure 10 illustrates some regional breakdowns of chronic poverty for , using
and . We see that in this case the ranking of the regions is similar across all three
measures – the adjusted chronic multidimensional headcount ratio, poverty gap, and squared gap
In addition to providing information on the percentage of chronically poor individuals, the
experimental cardinal measure compares the depth of poverty in each geographic area. In the
case of Chile, despite similar results in terms of the percentage of chronically poor individuals, it
is clear that the severity is stronger in rural and non-metropolitan areas. Incidence results
practically coincide with previous literature (Neilson et al. 2008). However, we extend the period
of analysis and provide extra information regarding the composition and evolution of the
different traits of poverty. The additional information might help to connect current public
policies with the outcomes and to design new dimensionally or subgroup targeted interventions.
6. Conclusions
It has been argued explicitly in the literature that poverty should be measured multidimensionally
in terms of shortfalls of well-being attributes from minimally acceptable levels defined for
different individuals in a society. Since, for many people worldwide, poverty is a situation from
which it is difficult to escape over time, often it becomes important to track it over multiple
periods. This, of course, requires panel data on different dimensions of well-being.
Following Foster’s (2009) income-based analysis, we have considered the spell, or duration, approach to chronic multidimensional poverty. We have defined multidimensional poverty
following Alkire and Foster (2011). Two notions of identification are present: the identification
of the multidimensionally poor in each period and the minimum number of periods a person has
to spend in poverty in order to be identified as chronically poor. The properties of the proposed
class of chronic poverty measures are in some cases jointly restricted by this triple-cutoff
identification approach as well as the aggregation method.
The indices of chronic and transient poverty proposed in this paper represent the most
straightforward merger between the snapshot multidimensional poverty and the duration
approaches to chronic poverty. Being both counting approaches to poverty measurement, they
blend naturally. Besides, our indices of chronic poverty satisfy a set of relevant axioms, among
which chronic strong transfers, dimensional breakdown and additive subgroup decomposability
seem to be crucial requests for a policy-pertinent measure of poverty (Chakravarty et al. 1998;
Alkire and Foster, 2013).
The implementation of the multidimensional poverty measure in Chile helps to understand the
phenomena of chronic multidimensional poverty, complementing the use of income as the sole
development and, at the same time, facilitate the implementation of targeted policies in terms of
population as well as dimensions of welfare. Secondly, it combines information of the income
measure with households’ and individuals’ long-term characteristics unaffected by the economic
cycle, such as education and quality of the dwelling. Finally, it provides additional short-term
information about the evolution of welfare and the accountability of public programmes hidden
behind traditional income measures, such as school attendance, for instance.
Besides the aforementioned benefits, a longitudinal measure also presents the possibility to
identify and describe the harshest forms of poverty, in terms of breadth and persistence,
simultaneously. It provides information on possible strategies of intervention and design of
safety nets for families leaving poverty or becoming poor, respectively.
Alternative counting-based measures could also be explored. For example, by altering the order
of aggregation in this paper (first across dimensions and then across time), one could aggregate
across deprivations inter-temporarlly first, then construct a chronic multidimensional poverty
measure that identified as deprived anyone who had experienced deprivations for or more
periods per dimension in at least k dimensions. This class of measures can easily be
implemented, and could be explored (see Apablaza and Yaloneztky, 2012). We chose the former
order of aggregation because policy actors must monitor and analyse change in the most-recent
period in comparison with others, which the class of measures proposed in this paper permit.
Future research should study the theoretical, empirical and policy implications of combining
different approaches to the identification and measurement of multidimensional poverty with
different ways of understanding, indentifying and measuring chronic and transient poverty.
Acknowledgements: The authors would like to thank François Bourguignon, James Foster and participants at the Ultra Poverty Symposium at George Washington University, Washington,
DC, March 2013; the Fifth ECINEQ Meeting, Bari, Italy, July 2013, and the IARIW-IBGE
Conference on Income, Wealth and Well-being in Latin America, Rio de Janeiro, Brazil,
September 2013, for their helpful comments. The usual disclaimer applies.
We acknowledge research support from ESRC-DFID grant RES-167-25 ES/1032827/1 for
References
Alkire, S., and Foster, J.E. (2011). Counting and multidimensional poverty measurement. Journal
of Public Economics, 95, 476–487.
Alkire, S., and Foster, J.E. (2013). Evaluating dimensional and distributional contributions to
multidimensional poverty. Paper presented at CORD, March 2012, and University of
Oxford, November 2012, and Southern Economic Association, November 2013.
Alkire, S., Apablaza, M., Chakravarty, S. R., and Yalonetzky, G. (2014). “Measuring Chronic Multidimensional Poverty: A Counting Approach”. OPHI Working Papers 75, University of Oxford.
Alkire, S., Foster, J.E., Seth, S., Santos, M.E., Roche, J.M., and Ballon, P. (2015) Multidimensional
poverty measurement and analysis, Oxford Universtity Press.
Apablaza, M and Yalonetzky, G. (2012). Chronic Multidimensional Poverty or Multidimensional
Chronic Deprivation. OPHI Research in Progress 034a.
Baulch, B., and Masset, E. (2003). Do monetary and non-monetary indicators tell the same story
about chronic poverty? A study of Vietnam in the 1990s. World Development, 31, 441–53.
Bayudan-Dacuycuy, C., and Lim, J.A. (2014) “Chronic and transient poverty and vulnerability to poverty in the Philippines: evidence using a simple spells approach”, Social Indicators
Research, 118, 389-413.
Bendezu, L., Denis, A., Sanchez, C., Ugalde, P., and Zubizarreta, J.R. (2007). La Encuesta Panel
CASEN: Metodología y Calidad de los Datos.
Borguignon, F. and Chakravarty, S.R. (2003) The measurement of multidimensional poverty.
Journal of Economic Inequality, 1, 2-49.
Bossert, W., Chakravarty, S.R., and D’Ambrosio, C. (2012). Poverty and time. Journal of Economic Inequality, 10, 145–162.
Bossert, W., Ceriani, L., Chakravarty, S.R., and D’Ambrosio. C. (2014). Intertemporal material deprivation. In G. Betti and A. Lemmi, (Eds.), Poverty and social exclusion: new methods of
analysis. London: Routledge.
Carter, M.R., and Barrett, C.B. (2006). The economics of poverty traps and persistent poverty:
Chakravarty, S.R., Mukherjee, D., and Ranade, R. (1998). On the family of subgroup and factor
decomposable measures of multidimensional poverty. Research on Economic Inequality, 18,
175–94.
Comisión para la Medición de la Pobreza, CMP (2014). Informes final: Comisión para la
Medición de la Pobreza. PNUD, Chile.
Contreras, D., Larrañaga, O., Litchfield, J., & Valdés, A. (2001). Poverty and income distribution
in Chile 1987-1998.: New evidence. Cuadernos de economía, 38(114), 191-208.
Contreras, D. (2003). Poverty and inequality in a rapid growth economy: Chile 1990-96. Journal
of Development Studies, 39(3), 181-200.
Corbo, V., & Schmidt-Hebbel, K. (2011). The International Crisis and Latin America: Growth
Effects and Development Strategies. CASE Network Studies and Analyses, (429).
Dercon, S., and Shapiro, J. (2007). Moving on, staying behind, getting lost: Lessons on poverty
mobility from longitudinal data. In D. Narayan and P. Petesch, (Eds.), Moving out of poverty.
Washington, DC: World Bank.
D’Ambrosio, C. (2013) “The indicators of intertemporal material deprivation: a proposal and application to EU countries”, IMPROVE discussion paper 13/08.
Duclos, J-Y, and Tiberti, (2016). Multidimensional poverty indices: a critical assessment, in
Adler, M. and Fleurbaey, M. (Eds) The Oxford Handbook of Well-Being and Public Policy,
Oxford: Oxford University Press.
Dutta, I., Roope, L., and Zank, H. (2013). On intertemporal poverty measures: the role of
affluence and want, Social Choice and Welfare, 41: 741-62.
Foster, J.E. (2009). A class of chronic poverty measures. In: A. Addison, D. Hulme, and R.
Kanbur (Eds.), Poverty dynamics: Towards inter-disciplinary approaches. Oxford: Oxford
University Press.
Foster, J.E., and Santos, M.E. (2014). Measuring chronic poverty. In G. Betti and A. Lemmi
(Eds.) Poverty and social exclusion: new methods of analysis. London: Routledge.
Foster, J.E., and Sen, A.K. (1997). On economic inequality, with a substantial annex. Oxford: Oxford
University Press.
Fundación Superación de la Pobreza, FNS. (2010). Voces de la Pobreza: Significados,
representaciones y sentir de las personas en situación de pobreza a lo largo de Chile.
Galasso, E. (2011). Alleviating extreme poverty in Chile: the short term effects of Chile
Solidario. Estudios de Economia, 38(1).
Glick, D., and Menon, N. (2009) Public programs pare poverty: evidence from Chile. Bulletin of
Economic Research, 61, 249-282.
Gradin, C., del Rio, C., and Canto, O. (2012). Measuring poverty accounting for time. Review of
Income and Wealth, 58(2), 330–54.
Hojman, D., and Kast, F. (2009). On the measurement of poverty dynamics. (Faculty Research Working
Papers 09-035). Harvard Kennedy School.
Hoy, M., and Zheng, B. (2011). Measuring lifetime poverty. Journal of Economic Theory, 146, 2544–
2562.
Hulme, D., and McKay, A. (2008). Identifying and measuring chronic poverty: Beyond monetary
measures. In N. Kakwani and J. Silber (Eds.), The many dimensions of poverty. Basingstoke:
Palgrave-Macmillan.
Hulme, D., Moore, K., and Shepherd, A. (2001). Chronic poverty: meanings and analytical frameworks.
(Chronic Poverty Research Centre Working Paper No. 2). University of Manchester.
Jalan J., and Ravallion M. (1998). Transient poverty in post-reform rural China. Journal of
Comparative Economics, 26, 338–57.
Jalan J., and Ravallion M. (2000) Is transient poverty different?. Journal of Development Studies,
36, 82-99.
Kolm, S. C. (1977). Multidimensional egalitarianism. Quarterly Journal of Economics, 91, 1–13.
Lybbert, T.J., Barrett, C.B., Desta, S., and Coppock, D.L. (2004). Stochastic wealth dynamics and
risk management among a poor population. The Economic Journal, 114: 750–77.
Mahadevan, R., and Hoang, V. (2016). The nexus between poverty and deprivation in Vietnam.
Journal of Policy Modelling, 38, 290-303.
McCulloch, N., and Baulch, B. (2000). Simulating the impact of policy upon chronic and
transitory poverty in rural Pakistan, Journal of Development Studies, 36, 100-130.
Mendola, D., and Busetta, A. (2012). The importance of consecutive spells of poverty: a
path-dependent index of longitudinal poverty. The Review of Income and Wealth, 58, 355-74.
Nicholas, A and Ray, R. (2011). Duration and persistence in multidimensional deprivation:
Methodology and Australian application. Economic Record, 88, 280, 106–126.
Nicholas, A., Ray, R., and Sinha, K. (2013). A dynamic multidimensional measure of poverty (Discussion
Paper 25/13). Melbourne: Monash University.
Neilson, C., Contreras, D., Cooper, R., & Hermann, J. (2008). The dynamics of poverty in Chile.
Journal of Latin American Studies, 40(02), 251-273.Palma, J. and Urzua, R. 2005. Anti-poverty
policies and citizenry: the Chile Solidario experience, Policy Papers No. 12, UNESCO,
Paris.
Porter, C., and Quinn, N.N. (2014). Measuring intertemporal poverty: policy options for the
poverty analyst. In G. Betti and A. Lemmi (Eds.), Poverty and social exclusion: New methods of
analysis. London: Routledge.
Roelen K., Gassmann F., and de Neubourg C. (2010). Child poverty in Vietnam: Providing
insights using a country-specific and multidimensional model. Social Indicators Research, 98,
129–145
Salvatore, D. (2007). Growth, international inequalities, and poverty in a globalizing world.
Journal of Policy Modelling, 29, 635-641.
Sen, A.K. (1976). Poverty: An ordinal approach to measurement, Econometrica, 44, 219–231.
Sen, A.K. (1985). Commodities and capabilities. North-Holland, Amsterdam.
Sen, A.K. (1987). Standard of living. Cambridge: Cambridge University Press.
Streeten, P. (1981). First things first: meeting basic human needs in developing countries. Oxford: Oxford
University Press.
United Nations General Assembly. (2015). Transforming our world: the 2030 agenda for Sustainable
Development. Resolution A/RES/70/L.1 adopted 25 September 2015.
Walker, R. (1995).The dynamics of poverty and social exclusion. In G. Room (Ed.), Beyond the
threshold. Bristol: The Policy Press.
Packard, T. G. (2004). Household risk management and social protection in Chile. World Bank.
Retrieved from http://elibrary.worldbank.org/doi/abs/10.1596/0-8213-5953-3
Ward, P. (2016). Transient Poverty, Poverty Dynamics, and Vulnerability to Poverty: An
Empirical Analysis Using a Balanced Panel from Rural China. World Development, 78,
Zheng, B. (1997). Aggregate poverty measures. Journal of Economic Surveys, 11,123–162.
Figure 1: Transitions Entry and Exit from Multidimensional Poverty ( )
[image:27.595.51.528.809.987.2]Figure 2: Longitudinal Multidimensional Poverty
Figure 4: Dimensional Breakdown of Longitudinal Poverty in Selected Poverty Groups ( )
[image:28.595.57.518.567.723.2]Figure 6: Indicator Censored Headcounts () and Duration () of Chronic Poverty ( )
[image:29.595.77.427.602.803.2]Figure 8: Headcount Ratio with All Possible Poverty () and Time () Cut-offs
Figure 9: Multidimensional Transitions 1996-2001-2006 ( )
k=1/3 k=2/3 k=1 0% 5% 10% 15% 20% 25% 30% 35% 40% 45% 50% t=1/3 t=2/3 t=1 49.43% 26.64% 10.11% 16.29% 5.47% 0.87% 1.90% 0.48% 0.05%
Never Poor: 5 0 .5 7 %
Poor Population in Period 1: 36.79%
Poor Population in Period 2: 29.62%
Figure 10: Chronic Multidimensional Poverty by Region with and , for different
0.00 0.02 0.04 0.06 0.08 0.10 0.12 0.14 0.16 0.18 0.20
Na onal Urban Rural III Region VII Region VIII Region Metropolitan Region
Table 1: Dimensions, Indicators, Weights and Uncensored Headcount Ratios
Weights Uncensored Headcount Ratios12
Dimension Indicator Deprivation Cut-off: An individual is deprived if he/she lives in a household with…
Cardinal illustrat.
Ordinal
illustrat. 1996 2001 2006
Education Educational Achievement
no household member fulfilling the legal number of compulsory years of education relevant to their birth cohort13
1/3 1/9 8% (7% -10%) 6% (5% -7%) 5% (4% -6%) School Attendance
at least one individual of school age (6 to 17 years) not attending school, or evidencing a gap greater than 3 years between his/her highest achieved school year
and the appropriate school year by the individual’s age.
1/9 9% (7% -10%)
7% (5% -9%)
5% (4% -7%)
Illiteracy at least one member older than 17 not able to read or write14 1/9 8%
(7% -10%)
7% (5% -8%)
5% (4% -6%)
Housing Overcrowding more than 2.5 persons per bedroom as defined by the Chilean Ministry of Social Development15
1/3 1/9 17% (14% -20%)
12% (10% -14%)
8% (7% -10%)
Shelter insufficient housing materials as defined by the Chilean Ministry of Social Development16 (one or more deprived indicators for walls, floor or roof)
1/9 44% (39% -48%)
37% (33% -42%)
38% (34% -42%)
Toilet at least 1 toilet in the household17 1/9 19%
(15% -23%) 12% (10% -15%) 6% (4% -7%) Income -Employment
Income a per capita income lower than the relevant national poverty line defined by the Social Planning Ministry
1/3 1/9 24% (20% -27%)
21% (17% -24%)
11% (9% -12%)
Unemployment no member older than 17 is employed18 1/9 6% 10% 8%
12 In parentheses: lower and upper 95% confidence intervals.
13 In 1920, the Law 3.654 defines primary education as compulsory. In 1929, the Decree 5.291 extends this regulation to 6 years. Then, in 1965, Government Decree 27.953 increases the levels of compulsory education to 8 years. Finally, in 2003, the Constitutional Law 19.876 sets the minimum compulsory schooling to 12 years.
14 The Chilean Government defined a set of policies to promote literacy regardless the age of the individuals (Contigo Aprendo). This indicator differs from schooling because it tries to capture the skill of literacy of each individual in the household. Consequently, if one individual is deprived the entire household is deprived. Conversely, in the schooling indicator if one individual has enough school the household is immediately non-deprived. 15 Available at http://www.ministeriodesarrollosocial.gob.cl/casen/definiciones/vivienda.html
16 Deprived walls: adobe, wall without interior protection, mud, thatch, artisanal construction, rubbish, cardboard, tin or rubber. Deprived roof: clinkstone, straw, bulrush, rubbish or cane. Deprived floor: no protected cement foundation.
17 There is no additional qualitative information regarding the type of toilet.
(5% -7%) (8% -12%) (7% -10%)
Quality of Employment
no member older than 17 has access to the pension system or has signed contract – excluding rentiers, pensioners and entrepreneurs as defined by the Chilean Law
1/9 22% (19% -26%)
23% (19% -26%)