This is a repository copy of Simplifying the use of ants as bioindicators on minesites. White Rose Research Online URL for this paper:
http://eprints.whiterose.ac.uk/137882/ Version: Accepted Version
Thesis:
Cooper, Conor orcid.org/0000-0002-0189-8620 (Submitted: 2018) Simplifying the use of ants as bioindicators on minesites. Masters thesis.
[email protected] https://eprints.whiterose.ac.uk/ Reuse
This article is distributed under the terms of the Creative Commons Attribution-NonCommercial-NoDerivs (CC BY-NC-ND) licence. This licence only allows you to download this work and share it with others as long as you credit the authors, but you can’t change the article in any way or use it commercially. More
information and the full terms of the licence here: https://creativecommons.org/licenses/
Takedown
If you consider content in White Rose Research Online to be in breach of UK law, please notify us by
~ 36 ~
Simplifying the use of ants as
bioindicators on mine sites
Conor Robert Miller Cooper
MSc (by research)
The University of York
Biology
~ 2 ~
Abstract
Biological indicators are vital to the monitoring of ecosystems and environmental conditions across the globe as representatives of broader ecological trends. In Australia, ants are widely employed as biological indicators, owing to their ubiquity, importance to ecosystem service provision, representativeness of broader ecological patterns and well-characterised disturbance response. Ants are also considered much simpler to sample and sort than alternative indicators. However, despite these advantages, the use of ants as indicator taxa remains time-consuming, costly, and inaccessible to non-specialists due to the difficulties
A -diverse and hyper-abundant ant fauna to species level, which limits their implementation in monitoring programmes and the research avenues that can be explored.
The drawbacks of using ants can be addressed through the use of simplified analyses which circumvent the need to use species abundance data by utilising higher taxa, restricted species lists or presence/absence data. In this thesis I analyse data from a long-term study of ant community change after mine-site rehabilitation at German Creek and Callide mines in Australia. I test four simplified analyses Genera Abundance, Functional Group Abundance, Large-Bodied Abundance and Species Presence/Absence in order to assess their suitability as a surrogate for species abundance data in the monitoring and evaluation of rehabilitated mine sites, by evaluating their ability to replicate key aspects of the results from a full species abundance assessment.
~ 3 ~
List
Contents
Abstract... 2
List of Contents ... 3
List of Figures ... 7
List of Tables ... 16
Acknowledgements ... 22
A Declaration ... 23
Chapter 1 A General Introduction... 24
1 What are bioindicators? ... 24
2 Ants as indicator components: What makes a good indicator taxon? ... 26
3 Mine site rehabilitation in Australia ... 29
Chapter 2 An evaluation of rehabilitation success at German Creek Mine & Callide Mine ... 32
Introduction... 32
Methods ... 35
1 Study Sites... 35
2 Sampling ... 40
3 Analysis ... 40
Results ... 44
1 Callide Mine ... 44
1.1 Overview ... 44
1.2 Rehabilitated Sites ... 46
~ 4 ~
2 German Creek ... 54
2.1 Overview ... 54
2.2 Rehabilitated Sites... 56
2.3 Functional Group Profiles ... 63
Discussion ... 64
1 Evaluation of Survey Methods ... 64
1.1 Pitfall Trapping ... 64
1.2 Survey Time ... 66
2 Evaluation of Analytical Methods... 70
2.1 NMDS Ordination ... 70
2.2 ARC-Dissimilarity ... 71
2.3 The Reference-Site Convergence Model ... 74
2.4 Conclusions on Methods... 75
3 Discussion of Results ... 76
Chapter 3 Assessing the efficacy of four simplified analysis protocols for evaluating rehabilitation success ... 83
Introduction ... 83
Methods ... 88
1 simplified analyses... 88
2 Comparison with Species Abundance analysis ... 88
Results ... 94
1 Callide Mine ... 94
1.1 Overview ... 94
1.2 Genus Abundance ...103
1.3 Functional Group Abundance ...108
~ 5 ~
1.5 Species Presence/Absence ... 119
1.6 Rehabilitated Site Trends (NMDS Ordination) ... 124
1.7 Summary (Callide Mine) ... 130
2 German Creek ... 131
2.1 Overview ... 131
2.2 Genus Abundance ... 139
2.3 Functional Group Abundance ... 145
2.4 Large-Bodied Species Abundance ... 150
2.5 Species Presence/Absence ... 155
2.6 Rehabilitated Site Trends (NMDS Ordination) ... 161
2.7 Summary (German Creek Mine) ... 165
3 Conclusion... 165
Discussion ... 167
1 Critical Discussion of Comparative Assessment Methods ... 167
1.1 ARC-Dissimilarity Comparison ... 167
1.2 Qualitative Interpretation of NMDS Ordinations ... 170
1.3 Inter-rater agreement: W simplified analysis? ... 172
2 Discussion of Results ... 174
2.1 Disagreement between comparison methods ... 174
2.2 Behavior of simplified analyses... 176
2.3 Differences between sites ... 179
Chapter 4 General Discussion ... 187
1 Evaluating the use of simplified analyses ... 187
1.1 Genus Abundance & Functional Group Abundances ... 187
1.2 Large-Bodied Abundance ... 192
1.3 Species Presence/Absence ... 196
~ 6 ~
1.5 Summary Cost-Benefit Analysis ...201
2 Conclusions ...202
Appendix 1 Functional Group Relative Abundance Profiles... 206
1 Callide Sites ...206
2 German Creek Sites ...212
Appendix 2 Reciprocal Transformations of Estimated Years to Convergence ... 217
~ 7 ~
List of Figures
Chapter 2 An evaluation of rehabilitation success at German Creek Mine &
Callide Mine
Figure 1 ... 45
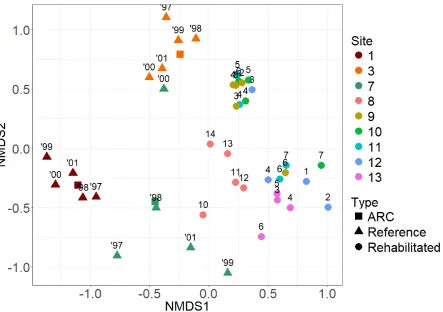
Non--metric multidimensional scaling ordination of Callide Mine Sites based on
ant species abundances, comparing reference (triangle) and rehabilitated (circle)
site types. ARCs (square) are also included to indicate their positioning within
reference clusters. Point labels indicate age since rehabilitation (years) of
rehabilitated site samples, or year sample was taken (2000-2006) for reference
site samples. Two-dimensional stress = 0.2291872
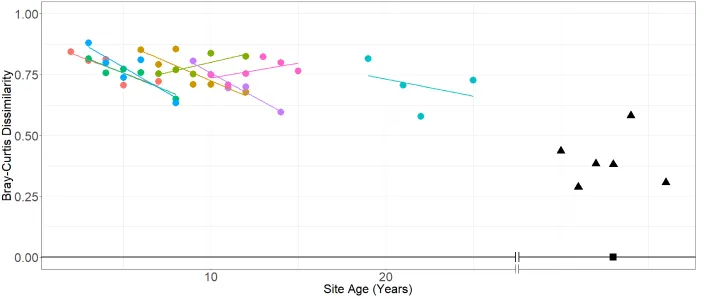
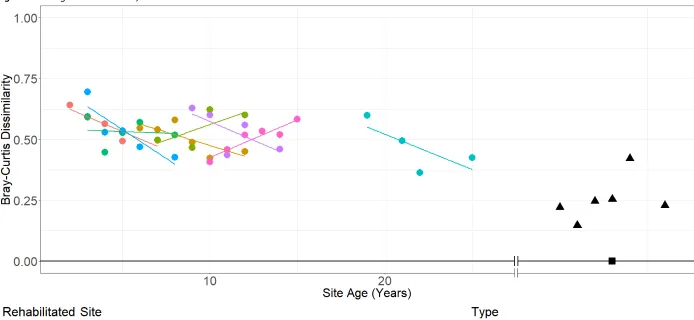
Figure 2 ... 49
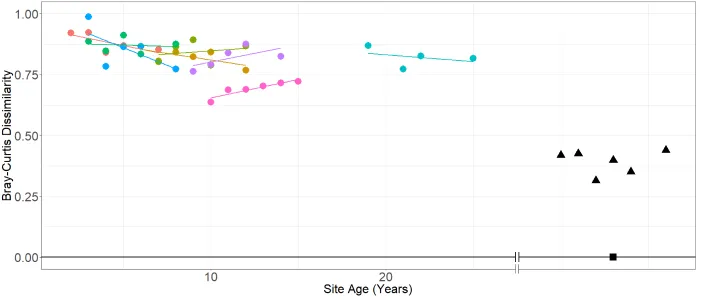
Change in Bray-Curtis Dissimilarity of Rehabilitated Mine Sites from ARCs of
Reference Sites 6 (2a), 8 (2b) and 9 (2c) with site age since rehabilitation (years)
at Callide Mine. These figures show the dissimilarity of the rehabilitated sites
(coloured circles), relative to the ARC (black square) of the reference site, against
T
dissimilarities from their ARC are included for comparison.
Figure 3 ... 55
Non-metric multidimensional scaling ordination of German Creek Mine Sites
based on ant species abundances, comparing reference (triangle) and
rehabilitated (circle) site types. ARCs (square) are also included to indicate their
positioning within reference clusters. Point labels indicate age since
rehabilitation (years) of rehabilitated site samples, or year sample was taken
(1997-2001) for reference site samples. Two-dimensional stress = 0.197346
Figure 4 ... 59
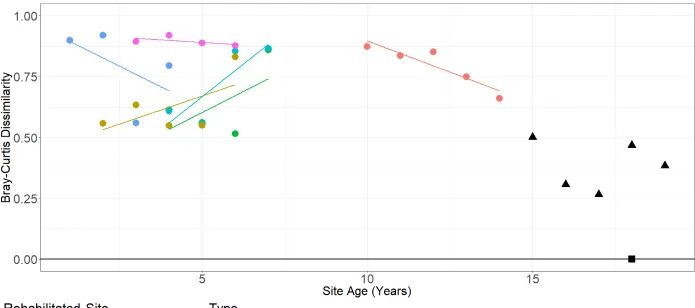
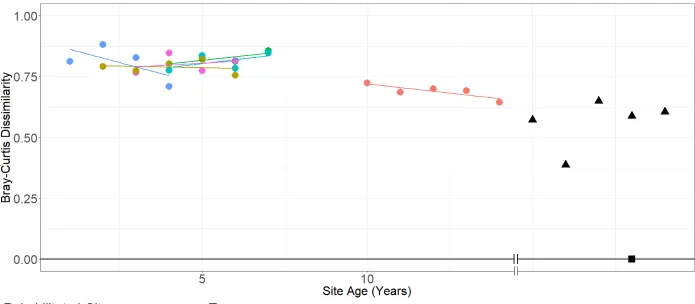
Change in Bray-Curtis Dissimilarity of Rehabilitated Mine Sites from ARCs of
Reference Sites 1 (4a), 3 (4b) and 7 (4c) with site age since rehabilitation (years)
at German Creek Mine. These figures show the dissimilarity of the rehabilitated
sites (coloured circles), relative to the ARC (black square) of the reference site,
against site age since rehabilitati T
~ 8 ~
Chapter 3 Assessing the efficacy of four simplified analysis protocols for
evaluating rehabilitation success
Figure 5 ... 95
Non-metric multidimensional scaling ordination of Callide Mine Sites based on
ant genus abundances, comparing reference (triangle) and rehabilitated (circle)
site types. ARCs (square) are also included to indicate their positioning within
reference clusters. Point labels indicate age since rehabilitation (years) of
rehabilitated site samples, or year sample was taken (2000-2006) for reference
site samples. Two-dimensional stress = 0.172341
Figure 6 ... 96
Non-metric multidimensional scaling ordination of Callide Mine Sites based on
ant functional group abundances, comparing reference (triangle) and
rehabilitated (circle) site types. ARCs (square) are also included to indicate their
positioning within reference clusters. Point labels indicate age since
rehabilitation (years) of rehabilitated site samples, or year sample was taken
(2000-2006) for reference site samples. Two-dimensional stress = 0.1625742
Figure 7 ... 97
Non-metric multidimensional scaling ordination of Callide Mine Sites based on
large bodied ant species abundances, comparing reference (triangle) and
rehabilitated (circle) site types. ARCs (square) are also included to indicate their
positioning within reference clusters. Point labels indicate age since
rehabilitation (years) of rehabilitated site samples, or year sample was taken
(2000-2006) for reference site samples. Two-dimensional stress = 0.2203731
Figure 8 ... 98
Non-metric multidimensional scaling ordination of Callide Mine Sites based on
ant species presence & absence, comparing reference (triangle) and
rehabilitated (circle) site types. ARCs (square) are also included to indicate their
positioning within reference clusters. Point labels indicate age since
rehabilitation (years) of rehabilitated site samples, or year sample was taken
~ 9 ~
Figure 9 ... 104
Change in Bray-Curtis Dissimilarity of Rehabilitated Mine Sites from ARCs of
Reference Sites 6 (9a), 8 (9b) and 9 (9c) with site age since rehabilitation (years)
at Callide Mine. These figures show the dissimilarity of the rehabilitated sites
(coloured circles), relative to the ARC (black square) of the reference site, against
T
dissimilarities from their ARC are included for comparison.
Figure 10 ... 109
Change in Bray-Curtis Dissimilarity of Rehabilitated Mine Sites from ARCs of
Reference Sites 6 (10a), 8 (10b) and 9 (10c) with site age since rehabilitation
(years) at Callide Mine. These figures show the dissimilarity of the rehabilitated
sites (coloured circles), relative to the ARC (black square) of the reference site,
T
triangles) dissimilarities from their ARC are included for comparison.
Figure 11 ... 114
Change in Bray-Curtis Dissimilarity of Rehabilitated Mine Sites from ARCs of
Reference Sites 6 (11a), 8 (11b) and 9 (11c) with site age since rehabilitation
(years) at Callide Mine. These figures show the dissimilarity of the rehabilitated
sites (coloured circles), relative to the ARC (black square) of the reference site,
T
triangles) dissimilarities from their ARC are included for comparison.
Figure 12 ... 120
Figure 8 (next page): Change in Bray-Curtis Dissimilarity of Rehabilitated Mine
Sites from ARCs of Reference Sites 6 (12a), 8 (12b) and 9 (12c) with site age since
rehabilitation (years) at Callide Mine. These figures show the dissimilarity of the
rehabilitated sites (coloured circles), relative to the ARC (black square) of the
T
~ 10 ~
Figure 13 ... 132
Non-metric multidimensional scaling ordination of German Creek Mine Sites
based on ant genus abundances, comparing reference (triangle) and
rehabilitated (circle) site types. ARCs (square) are also included to indicate their
positioning within reference clusters. Point labels indicate age since
rehabilitation (years) of rehabilitated site samples, or year sample was taken
(1997-2001) for reference site samples. Two-dimensional stress = 0.1718107
Figure 14 ... 133
Non-metric multidimensional scaling ordination of German Creek Mine Sites
based on ant genus abundance, comparing reference (triangle) and rehabilitated
(circle) site types. ARCs (square) are also included to indicate their positioning
within reference clusters. Point labels indicate site age since rehabilitation
(years) of sample. Two-dimensional stress = 0.1718107
Figure 15 ... 134
Non-metric multidimensional scaling ordination of German Creek Mine Sites
based on large bodied ant species abundances, comparing reference (triangle)
and rehabilitated (circle) site types. ARCs (square) are also included to indicate
their positioning within reference clusters. Point labels indicate age since
rehabilitation (years) of rehabilitated site samples, or year sample was taken
(1997-2001) for reference site samples. Two-dimensional stress = 0.1746129
Figure 16 ... 135
Non-metric multidimensional scaling ordination of German Creek Mine Sites
based on ant species presence and absence, comparing reference (triangle) and
rehabilitated (circle) site types. ARCs (square) are also included to indicate their
positioning within reference clusters. Point labels indicate age since
rehabilitation (years) of rehabilitated site samples, or year sample was taken
~ 11 ~
Figure 17 ... 140
Change in Bray-Curtis Dissimilarity of Rehabilitated Mine Sites from ARCs of
Reference Sites 1 (17a), 3 (17b) and 7 (17c) with site age since rehabilitation
(years) at German Creek Mine. These figures show the dissimilarity of the
rehabilitated sites (coloured circles), relative to the ARC (black square) of the
T
(black triangles) dissimilarities from their ARC are included for comparison.
Figure 18 ... 145
Change in Bray-Curtis Dissimilarity of Rehabilitated Mine Sites from ARCs of
Reference Sites 1 (18a), 3 (18b) and 7 (18c) with site age since rehabilitation
(years) at German Creek Mine. These figures show the dissimilarity of the
rehabilitated sites (coloured circles), relative to the ARC (black square) of the
T
(black triangles) dissimilarities from their ARC are included for comparison.
Figure 19 ... 151
Change in Bray-Curtis Dissimilarity of Rehabilitated Mine Sites from ARCs of
Reference Sites 1 (19a), 3 (19b) and 7 (19c) with site age since rehabilitation
(years) at German Creek Mine. These figures show the dissimilarity of the
rehabilitated sites (coloured circles), relative to the ARC (black square) of the
referen T
(black triangles) dissimilarities from their ARC are included for comparison.
Figure 20 ... 156
Change in Bray-Curtis Dissimilarity of Rehabilitated Mine Sites from ARCs of
Reference Sites 1 (20a), 3 (20b) and 7 (20c) with site age since rehabilitation
(years) at German Creek Mine. These figures show the dissimilarity of the
rehabilitated sites (coloured circles), relative to the ARC (black square) of the
reference site, against site T
~ 12 ~
Appendix 1 Functional Group Relative Abundance Profiles
Figure 21 ... 206
Functional Group relative abundance profile for Callide Reference Site 6. Profile
shows relative abundances of each functional group in each community sample
from the site and in the Average Reference Community (ARC).
Figure 22 ... 207
Functional Group relative abundance profile for Callide Reference Site 8. Profile
shows relative abundances of each functional group in each community sample
from the site and in the Average Reference Community (ARC).
Figure 23 ... 207
Functional Group relative abundance profile for Callide Reference Site 9. Profile
shows relative abundances of each functional group in each community sample
from the site and in the Average Reference Community (ARC).
Figure 24 ... 208
Functional Group relative abundance profile for Callide Rehabilitated Site BH99.
Profile shows relative abundances of each functional group in each community
sample from the site.
Figure 25 ... 208
Functional Group relative abundance profile for Callide Rehabilitated Site BHS94.
Profile shows relative abundances of each functional group in each community
sample from the site.
Figure 26 ... 209
Functional Group relative abundance profile for Callide Rehabilitated Site DCB94.
Profile shows relative abundances of each functional group in each community
sample from the site.
Figure 27 ... 209
Functional Group relative abundance profile for Callide Rehabilitated Site DCB98.
Profile shows relative abundances of each functional group in each community
~ 13 ~
Figure 28 ... 210
Functional Group relative abundance profile for Callide Rehabilitated Site DSC81.
Profile shows relative abundances of each functional group in each community
sample from the site.
Figure 29 ... 210
Functional Group relative abundance profile for Callide Rehabilitated Site TGB98.
Profile shows relative abundances of each functional group in each community
sample from the site.
Figure 30 ... 211
Functional Group relative abundance profile for Callide Rehabilitated Site TGC92.
Profile shows relative abundances of each functional group in each community
sample from the site.
Figure 31 ... 211
Functional Group relative abundance profile for Callide Rehabilitated Site TH91.
Profile shows relative abundances of each functional group in each community
sample from the site.
Figure 32 ... 212
Functional Group relative abundance profile for German Creek Reference Site 1.
Profile shows relative abundances of each functional group in each community
sample from the site and in the Average Reference Community (ARC).
Figure 33 ... 212
Functional Group relative abundance profile for German Creek Reference Site 3.
Profile shows relative abundances of each functional group in each community
sample from the site and in the Average Reference Community (ARC).
Figure 34 ... 213
Functional Group relative abundance profile for German Creek Reference Site 7.
Profile shows relative abundances of each functional group in each community
~ 14 ~
Figure 35 ... 213
Functional Group relative abundance profile for German Creek Rehabilitated Site
8. Profile shows relative abundances of each functional group in each community
sample from the site.
Figure 36 ... 214
Functional Group relative abundance profile for German Creek Rehabilitated Site
9. Profile shows relative abundances of each functional group in each community
sample from the site.
Figure 37 ... 214
Functional Group relative abundance profile for German Creek Rehabilitated Site
10. Profile shows relative abundances of each functional group in each
community sample from the site.
Figure 38 ... 215
Functional Group relative abundance profile for German Creek Rehabilitated Site
11. Profile shows relative abundances of each functional group in each
community sample from the site.
Figure 39 ... 215
Functional Group relative abundance profile for German Creek Rehabilitated Site
12. Profile shows relative abundances of each functional group in each
community sample from the site.
Figure 40 ... 216
Functional Group relative abundance profile for German Creek Rehabilitated Site
13. Profile shows relative abundances of each functional group in each
~ 15 ~
Appendix 2 Reciprocal Transformations of Estimated Years to Convergence
Figure 41 ... 217
Estimated Years to Convergence (EYCA) of each rehabilitated site to each of the
three reference sites at Callide Mine, based on Species Abundance data.
Estimates have been ranked from most to least convergent, or least to most
divergent. Positive values are convergent, negative values are divergent.
Figure 42 ... 217
Reciprocals of Estimated Years to Convergence (EYCA) of each rehabilitated site
to each of the three reference sites at Callide Mine, based on Species Abundance
data. Estimates have been ranked from most to least convergent, or least to
~ 16 ~
List
Tables
Chapter 2 An evaluation of rehabilitation success at German Creek Mine &
Callide Mine
Methods:
Table 1 ... 36
Summary description of rehabilitated sites (1998) (taken from Andersen &
Hoffmann, 1998b)
Table 2 ... 38
Summary description of rehabilitated sites (2001) (Taken from Andersen &
Hoffmann, 2001b)
Table 3... 40
List of samples excluded from Callide Mine analysis
Chapter 3 Assessing the efficacy of four simplified analysis protocols for
evaluating rehabilitation success
Methods:
Table 4 ... 92
Classification of level of reliability of simplified analyses for replicating
C K
Landis & Koch, 1977.
Table 5... 93
Classification of level of reliability of simplified analyses for replicating
E Y C EYCA ICC “
~ 17 ~ Results:
Table 6 ... 94
Procrustes analysis results for comparison of simplified analyses to NMDS
ordination of ant species abundance at Callide Mine. Lower Procrustes scores =
greater similarity of ordination based on that approach to that produced by
species abundance approach. Large-Bodied Species Abundance Species NMDS
ordination is zero-adjusted and compared with a zero-adjusted Species
Abundance ordination.
Table 7 ... 99
C s Kappa and Percentage Matching values of the four simplified analyses
for matching site classification as converging or diverging from the ARC with
results of Species Abundance analysis at Callide Mine. Colours indicate reliability
(Dark Grey = No Agreement, Light Grey = Extremely Poor Reliability, Red = Poor
Reliability, Yellow = Moderate Reliability, Green = Good Reliability, Blue =
Excellent Reliability) & asterisks indicate level of significance ( = >0.05, . = 0.05, *
= <0.05, ** = <0.01, *** = <0.001).
Table 8 ... 101
Intraclass Correlation Coefficients (ICC) of the four simplified analyses at Callide
Mine for matching the estimated years to convergence with ARCs (EYCA) of each
reference site with results of Species Abundance analysis at Callide Mine. Colours
indicate reliability (Red = Poor Reliability, Yellow = Moderate Reliability, Green =
Good Reliability, Blue = Excellent Reliability) & asterisks indicate level of
Table 9 ... 103
Summary of scores and ranks of Genus Abundance analysis in each of the three
agreement analyses. Colours indicate reliability (Dark Grey = No Agreement,
Light Grey = Extremely Poor Reliability, Red = Poor Reliability, Yellow = Moderate
Reliability, Green = Good Reliability, Blue = Excellent Reliability) & asterisks
indicate level of significance ( = >0.05, . = 0.05, * = <0.05, ** = <0.01, *** =
~ 18 ~
Table 10... 108
Summary of scores and ranks of Functional Group Abundance analysis at Callide
Mine in each of the three agreement analyses. Colours indicate reliability (Dark
Grey = No Agreement, Light Grey = Extremely Poor Reliability, Red = Poor
Reliability, Yellow = Moderate Reliability, Green = Good Reliability, Blue =
Excellent Reliability) & asterisks indicate level of significance ( = >0.05, . = 0.05, *
= <0.05, ** = <0.01, *** = <0.001).
Table 11... 113
Summary of scores and ranks of Large-Bodied Species Abundance analysis at
Callide Mine in each of the three agreement analyses. Colours indicate reliability
(Dark Grey = No Agreement, Light Grey = Extremely Poor Reliability, Red = Poor
Reliability, Yellow = Moderate Reliability, Green = Good Reliability, Blue =
Excellent Reliability) & asterisks indicate level of significance ( = >0.05, . = 0.05, *
= <0.05, ** = <0.01, *** = <0.001).
Table 12... 119
Summary of scores and ranks of Species Presence/Absence analysis at Callide
Mine in each of the three agreement analyses. Colours indicate reliability (Dark
Grey = No Agreement, Light Grey = Extremely Poor Reliability, Red = Poor
Reliability, Yellow = Moderate Reliability, Green = Good Reliability, Blue =
Excellent Reliability) & asterisks indicate level of significance ( = >0.05, . = 0.05, *
= <0.05, ** = <0.01, *** = <0.001).
Table 13 ... 125
Qualitative interpretation of rehabilitated site community trends in terms of
convergence/divergence with reference sites at Callide Mine, based on NMDS
ordination for each analysis. Large-bodied Species analysis ordination is based
~ 19 ~
Table 14 ... 131
Procrustes analysis results for comparison of simplified analyses to NMDS
ordination of ant species abundance at Callide Mine. Lower Procrustes scores =
greater similarity of ordination based on that approach to that produced by
species abundance approach. Large-Bodied Species Abundance Species NMDS
ordination is zero-adjusted and compared with a zero-adjusted Species
Abundance ordination.
Table 15 ... 136
C K pa and Percentage Matching values of the four simplified analyses
for matching site classification as converging or diverging from the ARC with
results of Species Abundance analysis at German Creek Mine. Colours indicate
reliability (Dark Grey = No Agreement, Light Grey = Extremely Poor Reliability,
Red = Poor Reliability, Yellow = Moderate Reliability, Green = Good Reliability,
Blue = Excellent Reliability) & asterisks indicate level of significance ( = >0.05, . =
0.05, * = <0.05, ** = <0.01, *** = <0.001)
Table 16 ... 137
Intraclass Correlation Coefficients (ICC) of the four simplified analyses at Callide
Mine for matching the estimated years to convergence with ARCs (EYCA) of each
reference site with results of Species Abundance analysis at German Creek Mine.
Colours indicate reliability (Red = Poor Reliability, Yellow = Moderate Reliability,
Green = Good Reliability, Blue = Excellent Reliability) & asterisks indicate level of
significance ( = >0.05, . = 0.05, * = <0.05, ** = 0.01, *** = 0.001).
Table 17 ... 139
Summary of scores and ranks of Genus Abundance analysis at German Creek
Mine in each of the three agreement analyses. Colours indicate reliability (Dark
Grey = No Agreement, Light Grey = Extremely Poor Reliability, Red = Poor
Reliability, Yellow = Moderate Reliability, Green = Good Reliability, Blue =
Excellent Reliability) & asterisks indicate level of significance ( = >0.05, . = 0.05, *
~ 20 ~
Table 18... 145
Summary of scores and ranks of Functional Group Abundance analysis at
German Creek Mine in each of the three agreement analyses. Colours indicate
reliability (Dark Grey = No Agreement, Light Grey = Extremely Poor Reliability,
Red = Poor Reliability, Yellow = Moderate Reliability, Green = Good Reliability,
Blue = Excellent Reliability) & asterisks indicate level of significance ( = >0.05, . =
0.05, * = <0.05, ** = <0.01, *** = <0.001).
Table 19... 150
Summary of scores and ranks of Large-Bodied Species Abundance analysis at
German Creek Mine in each of the three agreement analyses. Colours indicate
reliability (Dark Grey = No Agreement, Light Grey = Extremely Poor Reliability,
Red = Poor Reliability, Yellow = Moderate Reliability, Green = Good Reliability,
Blue = Excellent Reliability) & asterisks indicate level of significance ( = >0.05, . =
0.05, * = <0.05, ** = <0.01, *** = <0.001).
Table 20... 155
Summary of scores and ranks of Species Presence/Absence analysis at German
Creek Mine in each of the three agreement analyses. Colours indicate reliability
(Dark Grey = No Agreement, Light Grey = Extremely Poor Reliability, Red = Poor
Reliability, Yellow = Moderate Reliability, Green = Good Reliability, Blue =
Excellent Reliability) & asterisks indicate level of significance ( = >0.05, . = 0.05, *
= <0.05, ** = <0.01, *** = <0.001).
Table 21 ... 161
Qualitative interpretation of rehabilitated site community trends in terms of
convergence/divergence with reference sites at German Creek Mine, based on
~ 21 ~ Chapter 4 General Discussion
Table 22 ... 201
~ 22 ~
Acknowledgements
Science is a collective endeavour, and when we extend the read of human knowledge, we do so standing on the shoulders of giants. And it is in that spirit I would like to thank the giants who have made this thesis possible. First, and foremost, my supervisors; Elva Robinson, the model of a graduate supervisor - If I ever make something of myself in research, it will be down to what Ive learned as her student - and Ben Hoffmann, who has been an indispensable font of knowledge for a novice myrmecologist like myself and, alongside Alan Andersen, & their collaborators, was responsible for the fieldwork and data collection, without which this thesis would not exist. I would also like to thank a number of other senior colleagues, who generously shared their knowledge and time with me and made important contributions to the project; Colin Beale, who sat on my Thesis Advisory Panel and provided many insightful comments during the
Alan Andersen; Chris Thomas & the Whole Organism
Ecology Group for their advice and feedback on this work; Emma Rand, for her
assistance with the development of ARC-Dissimilarity analysis and for providing me with gainful and educational employment as a statistics and R-coding demonstrator, so I John Pitchford, for acting as my interim supervisor when I first arrived in York, without which I
lost; & Bill Sutherland and his research group at the UCCRI for their support and advice on corrections. I was also fortunate enough to start my research career in the best lab in the world, and so I must pay tribute to the Ant Lab, small but mighty, to Dominic Burns, Eleanor Drinkwater, Josie Monaghan, Megan
Holgate, Ryan Bromwell, and to Frances Drachenberg & Paula Fernández (who
~ 23 ~
in the other I
to thank Ellie Kosta, Brian Tippett & Magen Pettit at CSIRO for making me feel at home when home was so very far away, and my labmates Juliette Chassain &
Thomas Wind E I
Edward Lavender for helpful discussions about the project and always cheering
me on to new heights, and Chloe Rice for always believing the best of me. The last year has been a wild ride, but none of it would have been possible without the MSc course, funding and support provided by the University of York, including my research budget, desk space and, briefly, accommodation, and by CSIRO, who graciously flew me out to Australia (and back), subsidised my
accommodation and provided me with desk space. Last, but most definitely not I family; Carol Miller, Julian Cooper and Isabelle Cooper,
I
gamely supported me galivanting off around the country and the world, and then coming back only to lock myself in my room for the rest of the summer to write. Everything I have achieved, I owe to them being at my back, always on my team, and for that I am truly grateful, for I could do none of it without their eternal love and support. To all of you, thank you.
A
Declaration
I declare that this thesis is a presentation of original work and I am the sole author. This work has not previously been presented for an award at this, or any other, University. All sources are acknowledged as References.
~ 24 ~
Chapter 1 A General Introduction
1 What are bioindicators?
The use of organisms as indicators of environmental conditions is a concept that likely has origins stretching back millennia, but it was not until after the industrial revolution that a formal, scientifically rigorous indicator concept was codified (Cairns & Pratt, 1993). Formal study of bioindicators got its start in the field of limnology, the study of inland aquatic ecosystems, with studies on either side of the Atlantic independently giving rise to the indicator species concept (Cairns & Pratt, 1993). In the USA, the concept originated in the work of S.A. Forbes on the benthic fauna of the Illinois River, beginning in the 1870s (Cairns & Pratt, 1993), and in Europe, it originated in the work of Kolwitz & Marsson (1908, 1909, cited in Cairns & Pratt, 1993) on the Saprobien system of water contamination (Cairns & Pratt, 1993). Today, bioindicators are a well-established concept applied to a wide variety of environmental assessment objectives, ranging from their original use as monitors of pollution and contamination to use in more generalised environmental assessment, monitoring of disturbance and restoration, and ecosystem management and conservation (Cairns & Pratt, 1993, Andersen & Hoffmann, 2003a, Siddig et al, 2016). However, much like the concept of a
~ 25 ~
A t or a
measure of environmentally relevant phenomena used to depict or evaluate
environmental conditions or changes or to set environmental goals.
Environmentally relevant phenomena are pressures, states, and responses as
OECD
Under this overarching umbrella definition, Heink & Kowarik identified two major points of division in definitions:
• Measure versus Component
• Descriptive versus Normative
Indicator components are objects or processes that comprise the system, e.g. species or a fire regime, whereas measures are quantities or properties of those components, e.g. vegetation biomass, species richness or oxygen content of streams (Heink & Kowarik, 2010). Measures and components are then used in either descriptive or normative contexts. A descriptive indicator is used to describe environmental states or changes as they are, whereas a normative indicator includes a value judgement and is used in the evaluation of
~ 26 ~
2 Ants as indicator components: What makes a good indicator taxon?
Though an indicator component can refer to any component of an ecosystem, organisms are frequently selected as the component of choice. In aquatic
ecosystems around the world, benthic macroinvertebrates have been a mainstay since the beginning, but until quite recently in terrestrial ecosystems plants were the predominant indicator component taxa, with fauna, particularly
invertebrates, largely neglected (Andersen et al, 2004, Andersen & Majer, 2004, Burger, 2006). One notable exception to this trend has been in Australia, where ants were first employed as indicator components in the mid-1970s, by Majer and colleagues at the Alcoa World Alumina Australia bauxite mining operations in the Jarrah forests of southwestern Australia (Majer, 1983, Andersen & Majer, 2004, Majer et al, 2013). Today, ants are utilised as indicator components in a wide variety of land-management and ecosystem monitoring contexts in Australia, particularly monitoring of the impact of disturbances such as fire, grazing and mining, and the restoration of communities post-disturbance (Andersen & Hoffmann, 2003a, Andersen & Majer, 2004, Majer et al, 2013, Andersen et al, 2014, Lawes et al, 2017).
The popularity of ants as indicator components in Australia is a testa ment to their effectiveness, and ants make for particularly effective indicator
components, both globally and in Australia in particular. First and foremost, ants are themselves a key faunal group in Australia, particularly in the arid zone, being uniquely diverse and abundant on this continent (Andersen, 1990). Being so abundant and diverse, ants exert great influence on a wide variety of ecosystem processes and other faunal groups (Andersen, 1990). This includes, but is not limited to, ecosystem functions such as energy and nutrient cycling and litter decomposition through scavenging, and soil formation, structuring, aeration and drainage through their nests, close associations with plants such as pollination, but particularly the harvesting and subsequent dispersal of seeds, and regulation and influencing of the populations of other faunal groups through their
~ 27 ~
in terms of sheer abundance, but are also a critical component of their healthy functioning. This means that ants are a good choice of indicator component in Australia because they are more often than not one of the most important components of any particular ecosystem in Australia, making them worth monitoring for their own sake.
Of course, when selecting an indicator component to monitor community and ecosystem health and responses to disturbance, it is generally inherent to the selection process that the component indicates the status of other components. In this regard too, ants are a great indicator choice. In the first instance, their intrinsic importance to ecosystem function provision means that other taxa and processes are at least partially dependent on them and so the responses of these dependent taxa are likely to correlate with those of ants to some extent. In the Jarrah forests of Western Australia, species richness of ants has been found to be significantly correlated with that of total invertebrate species, and the
abundances a wide variety of other invertebrate taxa, including insect larvae, Acarina, Araneae, Blattodea, Caelifera, Coleoptera, Curcilionoidea,
Gryllacridoidea, Homoptera & Tettigonoidea (Majer, 1983), as well as with pl ant species richness, biomass of native vegetation and time since rehabilitation, with ant species diversity correlated with total vegetation biomass (Majer et al, 1982). Ant diversity was also positively associated with litter cover (Majer, Brennan & Moir, 2007). Their post-disturbance responses have not been found to correlate so closely with vertebrate taxa, however (Fox, 1982, Nichols & Nichols, 2003). That said, the community composition of ants has been found to be strongly associated with overall ecosystem community composition, even when
vertebrates are included (Bisevac & Majer, 2002). Overall, trends in ant species richness and diversity show unusually strong ties to a wide variety of
invertebrate taxa and to plant diversity and biomass, as well as broad community composition, making them a strong candidate for selection as an indicator
~ 28 ~
Representativeness is important for a potential indicator component taxon, but equally important is a well-characterised disturbance response. Here ants once again come out on top, having one of the best-characterised responses to disturbance of any invertebrate group (Andersen & Hoffmann, 2003a). This characterisation covers responses to mine rehabilitation, fire, grazing, pollutants, agriculture, urbanisation, and even the impact of military exercises (Woinarski et al, 2002, Andersen & Hoffmann, 2003a). The response of ants to post-mining rehabilitation is particularly well-studied across Australia and beyond (Fox, 1982, Majer et al 1982, Majer, 1983, Majer, 1997, Jackson & Fox, 1996, Bisevac & Majer, 1999, Andersen, 1997, Andersen et al, 2002, Andersen, Gómez et al, 2003, Hoffmann & Somes, 2003, Nichols & Nichols, 2003, Andersen & Hoffmann, 2003a, van Hamburg et al, 2004, Ottonetti, Tucci & Santini, 2006, Ribas et al, 2012).
Finally, ants also hold practical advantages over other invertebrates as an indicator taxon. This is due to the fact that they are easily and simply sampled, using simple equipment such as pitfall traps, as most Australian ants are epigaeic foragers and so the use of pitfall trapping targets most of the community
(Andersen, 1990, Greenslade, 1979, cited in Andersen, 1990, Alonso & Agosti, 2000) Ants are also comparatively easily sorted once sampled compared to other invertebrate taxa. At the species level, as a rule all samples are adult female workers so identification is not complicated by sexual or age-based
~ 29 ~
effort and specialist knowledge needed to use them as indicator components than other taxa, and so a much more feasible choice for integration into monitoring programmes than potential alternatives (Andersen, 1990).
Ants therefore are a key taxon in Australian ecosystems which is also
representative of a much broader range of taxa, well-studied and characterised in terms of disturbance response and relatively easy to work with. These
qualifications have secured the place of ants in terrestrial ecosystem monitoring in Australia. However, while ants are the best choice of indicator taxon, they are still not an easy choice of indicator taxon. Sorting of samples remains an
arduous, time-consuming task, and although less complicated than the identification of other invertebrates, still frequently requires specialist knowledge to identify each of the hundreds or even thousands of samples to species. Furthermore, the taxonomy of Australian ants is very incomplete, so samples may not be identifiable to species and must instead be assigned a study-specific species code (Andersen & Hoffmann, 1998a). These factors restrict the use of ants in monitoring and management efforts, as their use still requires considerable time, expense and specialist knowledge, so finding ways to address these issues would yield great social, economic and environmental benefits.
3 Mine site rehabilitation in Australia
M A
A GDP
50% of its exports (Minerals Council of Australia, 2017). However, the cost of this productivity is an incredibly environmentally destructive extraction process.
~ 30 ~
evolved from a commitment to leaving the area tidy under the first agreement in 1961, to a commitment to some rehabilitation in the form of reforestation and prevention of soil erosion in 1972, and by 2012 Alcoa had been committed to continuous research, monitoring and evaluation of its rehabilitation practices, with the aim to restore exhausted mining pits to the original Jarrah ecosystem featured at the site (Majer et al, 2013). The rehabilitation procedures employed have evolved in step, progressing from planting non-native species in 1966 to gradual improvements in practice throughout the 1970s, including ripping of the mine floor to improve root penetration, the use of fresh rather than stockpiled topsoil, direct seeding of native understorey species and two-layered removal of topsoil to preserve the seed bank and nutrient layers of the topsoil (Majer et al, 2013). A similar stepwise improvement of rehabilitation methods occurred at the Allied Eneabba Ltd and Associated Minerals Consolidated Ltd. Eneabba Mining area. In the 1970s, Majer reported that experimental small-scale rehabilitation at the Eneabba mining area, Western Australia, took the form of re-spreading of topsoil and associated plant material collected prior to mining over mining tailings after the completion of mining up to two years later, and later the application of mulched vegetation from the surrounding heathland over the topsoil (Black, 1979, in Majer et al, 1982, Majer et al, 1982). By 1998, a much more sophisticated programme had been implemented, with topsoil now sourced from new mining developments where possible and removed in such a way as to preserve the soil seed bank, ensuring the seeds and mycorrhiza of the topsoil being added were viable, and an extensive seed collection and
propagation programme having been established to re-establish those species that cannot be restored from the seed banks of the topsoil or mulch (Bisevac & Majer, 1999).
Part of the monitoring and evaluation of the restoration process
post-rehabilitation at these sites and others has been the inclusion of ants as indicator taxon, as discussed in section 2 of this introduction. Studies of restoration of mine sites using ants as indicator components typically make use of a
~ 31 ~
community such as species richness and diversity, or community composition, from rehabilitated sites are compared with representative local undisturbed sites (Majer et al, 1982, Andersen et al, 2003, Hamburg et al, 2004). Although some studies monitor the same sites over an extended period of time (Andersen, Hoffmann & Somes, 2003, Majer & Nichols, 1998, Majer et al, 2013), most studies have been single-instance studies surveying sites of a range of ages at once and constructing a chronosequence (sensu Majer & Nichols, 1998) from the results (Andersen & Majer, 2004). The cost limitations of surveying ant species abundance (as discussed in section 2) have likely contributed to the lack of long-term studies. Despite the fact that the Alcoa bauxite mines were some of the first rehabilitated sites to have been studied using ants, and have continued to be monitored, on and off, for over 37 years (Majer et al, 2013), the sites have still not fully recovered to a native assemblage, although there has been a noticeable improvement in how close rehabilitated sites have come to restoration as
rehabilitation methods have improved (Majer et al T
knowledge, no Australian rehabilitated site studies to date have discovered a rehabilitated site with an ant community composition fully resembling that of nearby native vegetation, with the exception of at Callide Mine, where a si ngle site (TH91) was discovered to have a community composition closely resembling that of the reference sites (Andersen, Hoffmann & Somes, 2003). This
~ 32 ~
Chapter 2 An evaluation of rehabilitation success at
German Creek Mine & Callide Mine
Introduction
Ants are widely utilised as indicator taxa in Australia, particularly in the mining industry, which has embraced them as a means of monitoring and evaluating their rehabilitation efforts (Andersen & Majer, 2004). The systems developed in Australia are also increasingly being embraced worldwide, with the mining industry once again leading the way, as pressure grows for ecologically
sustainable development, and scientists and agencies outside Australia recognise the value of incorporating terrestrial invertebrates into monitoring efforts
(Majer, 1997, Gómez et al, 2003, Andersen & Majer, 2004, van Hamburg et al, 2004, Ottonetti, Tucci & Santini, 2006,Ribas et al, 2012, Grandin et al, 2013, Siddig et al, 2016).
~ 33 ~
and gaps in site ages mean that it is not always possible to fully describe the ant succession with chronosequences, while long-term studies provide a continuous record of changes in the ant community from rehabilitation onwards, under fixed starting conditions (Majer & Nichols, 1998). However, in a comparison of the two approaches, the results of the chronosequence study were confirmed by the long-term results, suggesting chronosequences may be an acceptable substitute with the advantage of being much faster to perform (Majer & Nichols, 1998). However, as long-term studies are rare, and comparison between a
chronosequence and long-term study of the same site has only occurred once (Majer & Nichols, 1998), it is unclear how applicable this result is to other study sites. From a management perspective, chronosequences present additional problems, as they are only an estimation of rehabilitated site community changes, and given the variable conditions, do not guarantee that newer
rehabilitated sites will follow the same trajectory. Indeed, different rehabilitated sites can in fact take some very different paths following rehabilitation (see results). The somewhat abstract statistical nature of chronosequence results also made them harder to convey to non-scientists than the relatively clear trends of long-term study sites (Majer & Nichols, 1998). As such, while chronosequences appear to be an adequate substitute for long-term studies in investigations of environmental factors influencing post-rehabilitation ant community recovery, this needs further verification, and where possible long-term studies remain a more complete and comprehensible account of post-rehabilitation community dynamics, and irreplaceable for monitoring programmes.
The current study evaluates the success of the rehabilitation programmes at two mines, Callide and German Creek, in Queensland, using the ant community as a normative indicator component and community composition (abundances of species) as the indicator measurement. The study is somewhat unique in that it is a relatively short-term, but multi-year (4-6 years), study of multiple
~ 34 ~
allowing for the observation of year-on-year changes in community composition during the restoration process. It is also unique in that it makes use of two sets of monitoring data, meaning that, although the data from the two mines cannot be treated as replicates or pooled due to differences in location, ecology, length of study and study time, it is possible to qualitatively assess the broader
~ 35 ~
Methods
1 Study Sites
Data had been collected from German Creek Mine, Queensland, from 1997 to 2001, and from Callide Mine, Queensland, from 2001-2006 by Andersen & Hoffmann (except for Callide Mine in 2003, when data was collected by Stacey). (Andersen & Hoffmann, 1998a, 1998b, 1999, 2000a, 2001a, 2001b, 2002, 2003b 2005, 2006, Stacey, 2003, Hoffmann & Andersen, 2004). While the sampling and analysis procedures for both sites are the same unless specified, note that each site was subject to an independent study with independent species codes, and the data from each mine site are analysed separately.
German Creek is a black coal mine in the Bowen Basin, 25km SW of Middlemount and 240km from Mackay, in the semiarid tropics of Queensland. Land
rehabilitation is a continuous process that follows half a panel behind the coal -mining operation, so the ages of different rehabilitated sites vary (Anglo American 2018a). Ants were sampled from three reference sites and six rehabilitated sites (table 1). Reference sites 1, 3 & 7 were selected as a
representative subset of the local natural habitats from a 1997 pilot survey o f local undisturbed habitats (Andersen & Hoffman, 1997). Reference site 1 consisted of Blue Gum Woodland, 3 of Lancewood low woodland, and 7 of Yapunyah Woodland (Andersen & Hoffmann, 1998). The six rehabilitated sites were pit dump rehabilitations ranging from 1-11 years old as of 1998.
~ 36 ~
Table 1: Summary description of rehabilitated sites at German Creek Mine (1998) (taken from Andersen & Hoffmann, 1998b)
Site 8 Site 9 Site 10 Sit 11 Site 12 Site 13
Date of rehabilitation 1986 1994 1993 1993 1996 1994
Age of sampling (yrs) 11 3 4 4 1 3
Soil type Grey-brown
sandy clay loam
Grey-brown clay loam
- Red-brown sandy
loam
- Grey-brown
sandy clay loam
Slope 20% 20% 10% 20% 20% 20%
Contour interval (m) nil 50 nil 50 50 50
Dominant grass species
Golden Beard
(Chrysopogon
fallax)/
Red Natal
(Melinis repens)
Indian Blue
(Bothriochloa
pertusa)
Buffel
(Cenchrus ciliaris)
Buffel (C. ciliaris) Red Natal
(M. repens)
~ 37 ~
Callide Mine is a black coal mine in the Callide Basin, 20 kilometres from Biloela and 120km SW of Gladstone, in the semiarid tropics of Queensland (Anglo-American, 2018b). Land rehabilitation is concurrent to mining, taking place when a pit is mined out (Andersen, Hoffmann & Somes, 2003, Anglo-American, 2018b). Standard rehabilitation procedure involves the removal of vegetation and
stockpiling of native topsoil prior to mining, and following mining overburden dumps are reshaped into stable landforms and the stockpiled soil is respread and deep-ripped before seeds of locally collected plant species are sown (Andersen, Hoffmann & Somes, 2003). Rehabilitation techniques develop over time
~ 38 ~
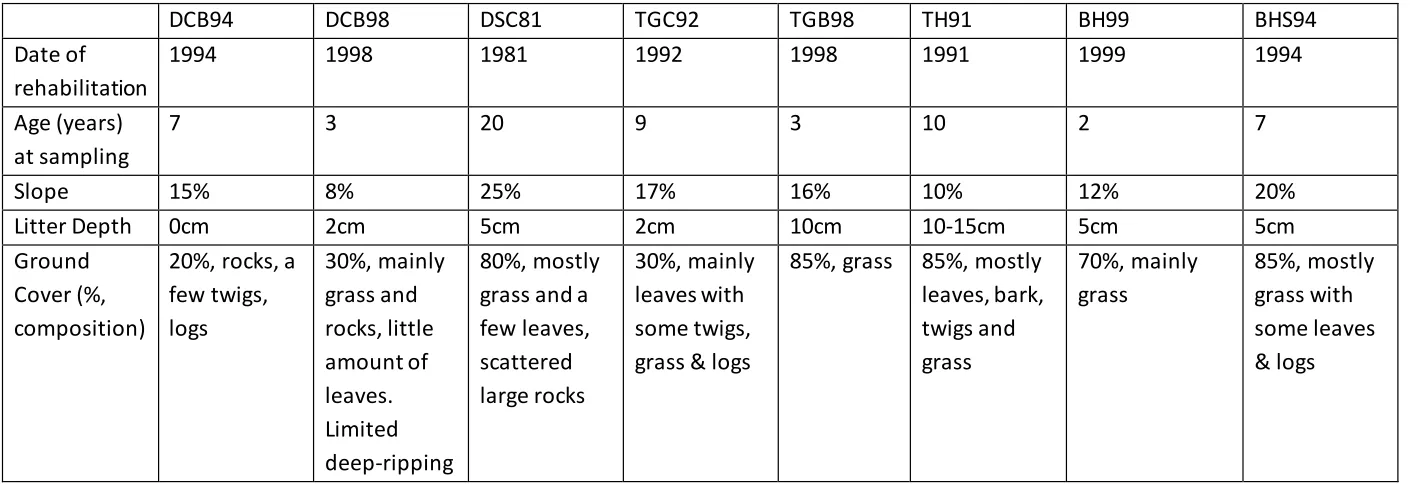
Table 2: Summary description of rehabilitated sites at Callide Mine (2001) (Taken from Andersen & Hoffmann, 2001b)
DCB94 DCB98 DSC81 TGC92 TGB98 TH91 BH99 BHS94
Date of rehabilitation
1994 1998 1981 1992 1998 1991 1999 1994
Age (years) at sampling
7 3 20 9 3 10 2 7
Slope 15% 8% 25% 17% 16% 10% 12% 20%
Litter Depth 0cm 2cm 5cm 2cm 10cm 10-15cm 5cm 5cm
Ground Cover (%, composition)
20%, rocks, a few twigs, logs 30%, mainly grass and rocks, little amount of leaves. Limited deep-ripping 80%, mostly grass and a few leaves, scattered large rocks 30%, mainly leaves with some twigs, grass & logs
~ 39 ~ Vegetation Acacias germinated, poor grass germination Acacias present but restricted in sampling area. Fairly sparse cover of Red Natal
(M. repens)
with some Rhodes grass
(Chloris
gayana) &
Buffel
(C. ciliaris)
- Patchy,
primarily Buffel
(C. ciliaris)
and Rhodes grass
(C. gayana).
Some lemon-scented gum (Corymbia citriodora), ironbark eucalypts, acacias
High levels of introduced pasture grasses and some acacias High vegetative cover, extremely good Acacia
and eucalypt establish-ment and cover, and some shrub and sparse native grass understorey
Low cover of native and introduced grasses & legumes, good numbers of
Acacia and
eucalypts also present cover not fully developed to high levels but good development conditions Early-stage cover of green panic (Panicum maximum), Buffel
(C. ciliaris),
Red Natal
(M. repens),
Urochloa &
Acacia, with
~ 40 ~ 2 Sampling
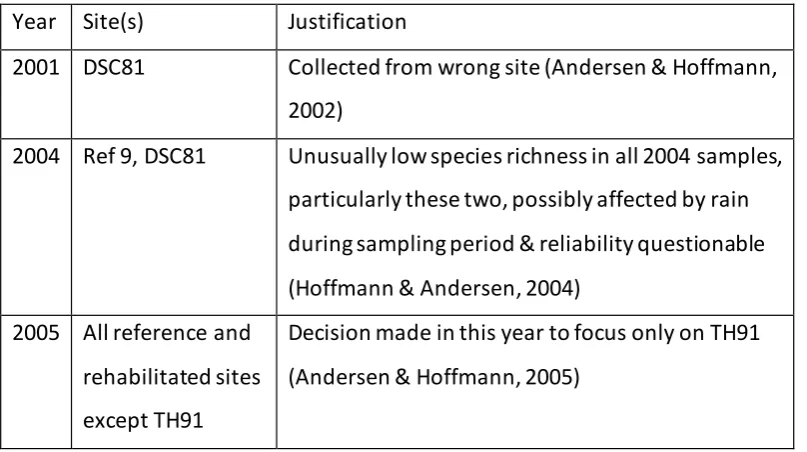
[image:41.595.42.446.332.558.2]Ants were sampled using 6.5cm diameter pitfall traps, partly filled with ethylene glycol as a preservative. At each sampling site a 5x3 grid of 15 pitfall traps with 10m spacing was established at each site (except BHS94, where only 14 traps were operative) during the wet season (Jan-Feb). At German Creek traps were operated for 4 days, whereas at Callide traps were operated for 5 days. Sampling was carried out from 1997 to 2001 at German Creek and from 2000 to 2006 at Callide. At Callide, not all sites were sampled in all years due to sampling constraints, and some further samples were excluded during analysis. For a full listing of exclusions see table 3.
Table 3: List of samples excluded from Callide Mine analysis
Year Site(s) Justification
2001 DSC81 Collected from wrong site (Andersen & Hoffmann, 2002)
2004 Ref 9, DSC81 Unusually low species richness in all 2004 samples, particularly these two, possibly affected by rain during sampling period & reliability questionable (Hoffmann & Andersen, 2004)
2005 All reference and rehabilitated sites except TH91
Decision made in this year to focus only on TH91 (Andersen & Hoffmann, 2005)
3 Analysis
~ 41 ~
Analysis was conducted by Conor Cooper in R v.3.4.3 with packages vegan and
nlme.
Ant abundances were square-root transformed to increase the contribution of rare species to site dissimilarity, and particularly to down-weight the
contributions of species of Iridomyrmex (rufoniger gp), which includes a number of hyperabundant species (Iridomyrmex species P & C (rufoniger gp) at Callide Mine, and Iridomyrmex species B & E,(rufoniger gp) at German Creek) with abundances orders of magnitude greater than other species at several samples, while retaining community structuring information in analysis (Clarke & Warwick, 2001).
Assessment of the recovery of rehabilitated mine-sites was carried out through the normative use of ants as an indicator component, with ant community composition (abundances of species) as the indicator measure. Recovery was assessed by comparison of ant community composition at rehabilitated sites to ant community composition at the unmined reference sites, sampled at the mines at the same time, representing the natural ant communities that existed on rehabilitated sites prior to mining. Sites with communities which become more similar to those on one or more of the reference sites are considered to be recovering, while those without are not. Though reference sites undergo
fluctuation in community composition, it is assumed that they are not
undergoing significant directional change in community composition, and so are suitable as a point of comparison.
In order to overcome the
each reference site the samples were used to estimate the Average Reference Community (ARC). These were estimated by calculating the median square-root transformed abundances of each species occurring at the site during the
~ 42 ~
sites, and hence its recovery, based on its dissimilarity to the ARC
(ARC-Dissimilarity approach).(ARC-Dissimilarity between site community samples, including the calculated ARCs, were calculated with a Bray-Curtis dissimilarity index, and the resulting distance matrix analysed with nonmetric Multidimensional Scaling (NMDS) fitted to principle components (Ottonetti, Tucci & Santini, 2006, Clarke & Warwick, 2001).
In order to assess whether sites were converging with age, a linear model of the effect of site age on dissimilarity of rehabilitated site samples from ARCs, with Site as a random factor, was fitted to ARC-Dissimilarity outputs (BC dissimilarity from ARC scores). The tracking of changes in an index of similarity between rehabilitated and reference site ant communities over time in order to chart recovery progress has been utilised in previous long-term monitoring of rehabilitated site ant community recovery (Majer & Nichols, 1998).
An idealised recovery scenario under the convergence model would see Bray-Curtis dissimilarities of rehabilitated sites from one or more ARCs decreasing year-on-year, undergoing clear directional movement towards the ARCs in NMDS Ordinations and a significant decrease in BC Dissimilarity with age on
ARCDissimilarity plots. Eventually rehabilitated sites would enter into a stable, non -directional pattern of fluctuation in community composition centred upon an average community composition resembling that of one of the reference site ARCs. A more generalised recovery scenario may see a rehabilitated site entering into such a pattern around an ARC position that does not resemble any one reference site but instead falls within the area of ordination space occupied by the reference sites as opposed to pre-recovery rehabilitated sites.
~ 43 ~
responses to temperature, stress and disturbance (Andersen, 1990). This classification divides Australian ants into nine functional groups based on their competitive interactions with each other, biogeography, and tolerance to temperature, stress and disturbance: Dominant Dolichoderinae, Subordinate Camponotini, the three Climate Specialist groups: Tropical, Cold an d Hot Climate Specialists, Generalised Myrmicinae, Opportunists, Cryptic Species and
~ 44 ~
Results
1 Callide Mine
1.1 Overview
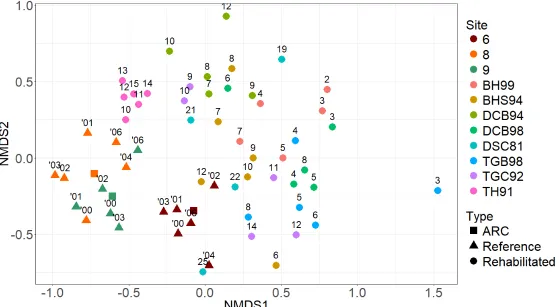
Reference and rehabilitated sites are not clearly separated in Non -Metric Multidimensional Scaling (NMDS) ordination (fig. 1), although the reference samples clearly group in the bottom-left corner of the ordination, and separation between reference and rehabilitated sites occurs predominantly on axis 1.
Examination of the samples in age order shows that reference community samples do not appear to exhibit systematic directional movement in ordination with time, and so there is no evidence that they are undergoing systematic variation (Andersen & Hoffmann, 2003b). This means the key assumption of the Reference-Comparison rehabilitation assessment, that variation in reference community composition is random rather than systematic, is upheld. Of the three reference sites, 8 and 9 overlap substantially on both NMDS axes, while reference 6 overlaps with them on NMDS axis 2 but is much more centrally positioned on axis 1. As a result, the rehabilitated sites are overall much closer to reference site 6 than to the other two reference sites. This also means the
convergence of rehabilitated sites to reference site 6 is much more strongly affected by movement along axis 2 than convergence on reference sites 8 or 9, and this is reflected in the ARC-Dissimilarity results (fig. 2).
~ 45 ~
Figure 1: Non-metric multidimensional scaling ordination of Callide Mine Sites based on ant species abundances, comparing reference (triangle) and
rehabilitated (circle) site types. ARCs (square) are also included to indicate their positioning within reference clusters. Point labels indicate age since
~ 46 ~
Linear models of overall trends of convergence across rehabilitated sites with time showed that, as a group, rehabilitated sites significantly converged on reference sites 6 and 9, but not on reference site 8 (Site 6: slope = -0.0054, SE = 0.002, t(32) =-2.83, p = 0.008) (Site 8: slope = -0.0043, SE = 0.003, t(32) = -1.59, p = 0.121) (Site 9: slope = -0.0087, SE = 0.003, t(32) = -3.31, p = 0.002). These results suggest that overall the rehabilitation programme at Callide Mine is succeeding.
1.2 Rehabilitated Sites
BH99 and TGB98 show the most linear convergence path along NMDS axis 1 (fig.
1) with substantial movement along axis 1 and relatively little movement on axis 2, and this is reflected in ARC-Dissimilarity (fig. 2), where both sites are shown to be converging with all three reference sites. BH99 has a notable downward trajectory on axis 2 as well however, and so is converging substantially more rapidly on reference sites 6 and 9 than reference site 8, which occurs higher up
BH
BSH94, the third site which converges with all three references in
ARC-Dissimilarity, takes a more erratic, spiralling path in the NMDS ordination. The majority of its movement is up and then down axis 2 towards reference site 6, with relatively little movement along axis 1 which is enough to push it into very close association with reference site 6 with a correspondingly rapid convergence trajectory in ARC-Dissimilarity, but yields only a relatively gradual convergence trajectory with reference site 8 and 9, as the movement towards either site by BHS94 is relatively small compared to its movement towards reference site 6.
DSC81 is the fourth site to converge on all three references in ARC-Dissimilarity,
~ 47 ~
at the conclusion of sampling this trajectory sees DSC81 rapidly converging on reference site 6 (figs. 1, 2a). This downward trajectory places it on a clear convergent path with reference 9 (2c) too, although notably DSC81 does passes by reference site 9 in NMDS, as it may potentially do for reference site 6. In contrast, this trajectory results in a very shallow decline in dissimilarity from reference site 8 (2b) overall, since ARC of reference site 8 is positioned higher up
axis 2 than that D“C
does not contribute as much to convergence with reference site 8 as it does to convergence with the other two reference sites.
DCB94 diverges from all three references in ARC-Dissimilarity (fig. 2), although is
close to neutral relative to reference 8. This reflects its relative lack of overall movement on NMDS axis 1 (fig. 1), with its position at the beginning of the sampling period being close to its final position, and its systematic divergen ce from all three reference sites on axis 2, moving up and away from all three.
DCB98 does not move systematically in NMDS ordination (fig. 1) and appears
prone to large fluctuations in community composition. This lack of systematic movement would appear to be reflected in the ARC-Dissimilarity graphs for reference sites 8 & 9 (figs. 2b & 2c), in relation to which DCB98 displays a very shallow convergent trajectory and an even more shallow divergent one
respectively, but is clearly converging with reference site 6. The NMDS and ARC-Dissimilarity results do not appear to agree for this site. It is important to note that NMDS is a low-dimensional representation of a much more complex arrangement of sites, so higher-dimensional representations may correspond more closely to the ARC-Dissimilarity results.
TGC92, in ARC-Dissimilarity (fig.2), is rapidly converging with reference site 6 (2a)
~ 48 ~
trajectory causes it to diverge from all three reference sites on axis 1, but brings it down towards reference site 6 on axis 2, closer than it started. Like DSC81, the trajectory of TGC92 may go on to carry it on past reference site 6 into
divergence, but as of surveying it remains convergent on this reference site.
TH91 is the only rehabilitated site to overlap with reference sites 8 & 9 on NMDS
axis 1 (fig. 1), being positioned further left on the predominant axis of separation of reference and rehabilitated sites than reference site 6, and this is reflected in their ARC-Dissimilarity results (figs. 2b & 2c) which place TH91 as the least dissimilar sites to the reference in each case. It experiences the least change in position year on year, even less than the three reference sites, giving the appearance of a stable, successfully rehabilitated site. However, in ARC-Dissimilarity (fig.2) it is divergent from reference sites 6 & 8 (2a & 2b) and
T
fact that TH91 in NMDS ordination actually shows a directional trend to its year-on-year movement, moving up and to the right, diverging from the reference sites, although it doubles back in the final year of sampling.
Overall there have been very mixed results from the Callide Mine rehabilitation programme while some rehabilitated sites are clearly converging on reference sites and on the road to recovery (BH99, TGB98, BSH94), the status of others is more ambiguous (DSC81, TGC92, DCB98, TH91), and DCB94 appear to be actively diverging from all reference communities. Out of the four ambiguous