eurostat
Entrée 01 le: § i} -06- Ì99l
Eurostat
Working Papers
Population and social conditions 3/1999/E/n°10
Guidelines and Table programme
for the Community Programme of
Population and social conditions 3/1999/E/n°10
Guidelines and Table programme
for the Community Programme of
Population and Housing Censuses in 2001
Volume II : Table Programme
The views expressed in this document are the author's and do not necessarily reflect the opinion of the European Commission
Population and social conditions 3/1999/E/n°10
Guidelines and Table Programme for the Community
Programme of Population and Housing Censuses in 2001
Volume II: Table Programme
GUIDELINES AND TABLE PROGRAMME FOR THE COMMUNITY PROGRAMME OF
POPULATION AND HOUSING CENSUSES IN 2001
TABLE PROGRAMME
INTRODUCTION
At its meeting in Helsinki on 28 May 1997, the Statistical Programme Committee approved the drawing-up of guidelines for coordinating, harmonising and synchronising the next wave of population and housing censuses.
It agreed on the main elements of the text put before it for this purpose and instructed a task force to supplement the text, in particular as regards the list and the definition of the variables, the Community programme of tables and the use by Eurostat of the data stored in the Member States.
The task force met in Luxembourg from 30 June to 3 July 1997. It was composed of representatives of Austria, Finland, Italy, Portugal, the United Kingdom and Norway and was chaired by Eurostat.
On the basis of the guidelines provided by the SPC (maximum account should be taken of the UNECE/Eurostat Recommendations; as complete a programme as possible of Community tables should be devised), the discussions at the January meeting of the Working Party on Censuses, and proposals by Eurostat, it drew up:
- a revised version of the "Guidelines for the Community programme of population and housing censuses in 2001";
an Annex 1 to these guidelines expanding and clarifying, where necessary, the UNECE/Eurostat
Recommendations;
- an Annex 2, comprising a Community programme of priority tables.
These documents were examined and approved by the Working Party on Censuses meeting held in Luxembourg on 15-16th October, 1997 and submitted to approval by the Statistical Programme Committee at its 27' meeting in Luxembourg, 26 and 27 November 1997.
th
A majority of the SPC agreed in principle the guidelines presented for the coordination, harmonisation and synchronisation of the next wave of Community population and housing censuses.
This comes from the fact that the table programme is almost entirely based on cross tabulations of so called core variables of the ECE/Eurostat Census Recommendations. These core variables have been identified as necessary and essential through years of serious work and user consultations by a great number of national and international experts participating in the preparatory work of the Recommendations. Because the variables are core variables, they are, and should be, included into the national census programmes within the ECE region. That is why the realisation of the table programme should not be too heavy a task to the Member States, provided that its contents will be duly taken into account while planning the national tabulation programmes
BACKGROUND
The Community programme of priority statistical tables to be derived from the 2001 wave of censuses, put forward by the Task Force of 30 June to 3 July 1997 for discussion by the Eurostat Working Party, is considerably more comprehensive than the previous programme requested by Eurostat for the 1990/91 series.
This development is due primarily to "institutional" decisions:
the last ECE/Eurostat meeting on the population and housing censuses (Geneva, 3-6 March
1997) asked the Eurostat Working Party in its conclusions (adopted by the 11-13 June Conference of European Statisticians) to design its programme of tables as a "programme illustrating the core tabulation programme" already examined by the participants. The ECE's "illustrative" programme was usually a considerably more detailed version of the "core" programme, incorporating, for example, additional cross-referencing of variables and more detailed classifications;
the Statistical Programme Committee of 28 May 1997 (Helsinki) had explicitly asked the Task Force to "make every effort to ensure that the priority programme of tables was as comprehensive as possible". This instruction echoed the concern of several national institutes to avoid drawing up an additional programme of tables in response to the priority programme.
The limits of the exercise have, however, been clearly set by the text of the "guidelines" submitted to the
Statistical Programme Committee: to avoid placing too heavy a burden on the national statistical institutes, the programme of tables would be restricted to essential or "core topic" variables and to fundamental (non-optional) classifications in the joint ECE/Eurostat recommendations.
However, the new programme is also the result of the shared conviction of the Working Party that it meets the need for comparative analysis of the population and housing statistics of the decade to come. The field covered by the censuses has changed a great deal in terms of both supply and demand:
on the supply side, the Labour Force Survey is now providing comparable annual statistics on a "hard core" of the active population and employment. Eurostat is tending to use it more and more often outside its traditional domain, at least for framing purposes. Its restricted field means, however, that peripheral populations (non-private households, older people etc.) are excluded; moreover, the description of the composition of households and family relationships is still too subsidiary an objective to provide detailed statistics on families, above all on complex households with several family nuclei;
on the demand side, the emphasis formerly placed on the description of the labour force no longer fits the extended scope of Community social policy, which is now no longer aimed solely at workers, but at all residents of the Community. Furthermore, questions which are becoming
future (new relationships between the sexes, the status of the various generations, ageing of the
population, prolonged adolescence, integration of
immigrants, expanding poverty, social exclusion, enlargement of citizenship etc.) concern groups which are often peripheral to the active population.
Most tables derived from the old programme still feature fields of interest characteristic of the 1960s and
1970s and were clearly designed with the aim of filling basic database cells rather than permitting comparative analysis. Most can, in fact, now be obtained each year from the Labour Force Survey. They fail to do justice to the wealth of information in censuses or to the unique opportunity they have to paint a comprehensive picture of the societies of the European Union.
The remit of the new priority tables project is therefore to make the best possible use of the specific advantages of censuses as:
elementary sources of information for data requested at a classification level (e.g. 3-digit ISCO-COM or NACE, detailed citizenship, etc.) or at a geographical level (e.g. NUTS 5) which are too detailed to be reliable in sample surveys;
sources of checks for framing data in household surveys (such as the distribution of private households by size, the number of families and the type of family nucleus) or regional data (such as the basic elements needed for projections of population or households at NUTS 3 level);
unique sources of information for data on specific populations poorly represented in household surveys (e.g. the proportion and distribution of persons living in institutional households, or the lifestyles of children or older people);
sources of comparative analysis of similar individuals living in different national contexts, thanks to the cross-referencing of most social or environmental variables with sex and age, and, often, as an indicator of citizenship (with the distinction between non-nationals who are citizens of the Community or otherwise). Such studies will enable the relative representation of various categories (women, young people, non-nationals, immigrants etc.) in the various European societies to be measured;
sources of comparative analysis of the structures of the various sub-populations (resident population, active population in employment, family nuclei, private households, housing etc.) at national but also at regional level (NUTS 3), enabling typologies of the European area to be compiled and Community policy to be better targeted.
ECE/Eurostat "core programme" for Europe. The local tables proposed at NUTS 5 level are at most two-dimensional (distribution by sex and another criterion) and are intended solely as basic building blocks for geographical aggregates of zones "of variable geometry".
If a national statistical institute unable for once to provide detailed is
LIST OF TABLES
TABLE 1 (National level) Usual resident population by sex, age, type of household and household status
TABLE 2 (National level) Usual resident population by sex, age, marital and cohabitational status and selected social indicators
TABLE 3 (National level) Usual resident population by sex, country of citizenship and age group
TABLE 4 (National level) Usual resident population by sex, country of birth and age group
TABLE 5 (National level) Usual resident population by sex, place of residence one year prior to the census, indicator of citizenship and age group
TABLE 6 (National level) Usual resident population by sex, age, and economic activity (current activity and employment status)
TABLE 7 (National level) Usual resident population by sex, of citizenship and economical activity
TABLE 8 (National level) Usual resident population aged 15 and over (living in private households) by sex, age group, family and non-family status, and
indicator of current activity
TABLE 9 (National level) Female resident population aged 15 and over by age group, family situation, and current activity status
TABLE 10 (National level) Usual resident population by sex, indicator of citizenship, age and highest level of educational attainment
TABLE 11 (National level) Resident population aged 15-74 by sex, age group, highest level of educational attainment, current economic activity and occupation
TABLE 12 (National level) Population in private households by sex, age group, indicator of citizenship and household size
TABLE 14 (National level) Usual resident population by sex, indicator of citizenship, family status and housing situation
TABLE 15 (National level) Employed persons aged 15 and over by sex, age group, indicator of citizenship and occupation
TABLE 16 (National level) Employed persons aged 15 and over by sex, age group, and detailed occupation
TABLE 17 (National level) Employed persons aged 15 and over by sex, age group, indicator of citizenship and industry (branch of economic activity)
TABLE 18 (National level) Employed persons aged 15 and over by sex, age group, and detailed industry (branch of economic activity)
TABLE 19 (National level) Employed persons aged 15 and over by sex, industry (branch of economic activity), status of employment and time usually worked indicator
TABLE 20 (National level) Employed persons aged 15 and over by sex, age group and place of work
TABLE 21 (National level) Family nuclei by type, number of resident children in the family, current economic activity of parents, and presence of other persons in the household
TABLE 22 (National level) Private households by type and size, number of economically active members and number of aged members
TABLE 23 (National level) Private households by type and citizenship composition
TABLE 24 (National level) Private households by type of household, tenure status, and type of living quarters
TABLE 25 (National level) Number of living quarters, dwellings, private households and occupants by type of living quarters
TABLE 26 (National level) Occupied* conventional dwellings by number of rooms and occupants and type of ownership
TABLE 27 (National level) Occupied* conventional dwellings by presence of comfort characteristics
TABLE 29 (Regional level NUTS 3) Usual resident population and economically active population by sex, age and indicator of internal or international migration
TABLE 30 (Regional level NUTS 3) Usual resident population by sex, group of age, type of household and household status
TABLE 31 (Regional level NUTS 3) Usual resident population by sex, group of age and economical status (current activity and status of employment)
TABLE 32 (Regional level NUTS 3) Usual resident population by sex, age group, marital and coba bitational status, size of household and selected social indicators
TABLE 33 (Regional level NUTS 3) Usual resident population by sex, country of citizenship and indicator of birth
TABLE 34 (Regional level NUTS 3) Usual resident population by sex, age group, highest educational attainment, current activity and occupation
TABLE 35 (Regional level NUTS 3) Usual resident population by sex, major branch of economic activity, indicator of citizenship and status of employment
TABLE 36 (Regional level NUTS 3) Private households by type and number of members and population by age group and economic activity
TABLE 37 (Regional level NUTS 3) Dwellings by indicator of conventional character, occupancy status, type of ownership and type of building
TABLE 38 (Local level NUTS 5) Main population characteristics
TABLE 39 (Local level NUTS 5) Main characteristics of private households and dwellings
Table 1 (NATIONAL LEVEL): Usual resident population by sex, age, type of household and household statue
Type of household and household status
Sex
Total
Total Child
Livins Spouse
in private households
Cohabitant Lone parent Living alone
Other Total Educational institutions
Health care institutions
Living in institutional households Institutions for retired or elderly persons
Military institutions
Religious institutions
Other institutions
Both sexes Total Age and age group
0 1 2 3 4 0-4
5 6 7 8 9 5-9
90-94 95 96 97 98 99 95-99
100+
Males
(as for 'Both sexes') Females
[image:16.842.69.801.81.481.2]11
TABLE 1 (National level) Usual resident population by sex, age, type of household and household status
Population base - Usuai residents
These are:
(a) persons usually resident and present at the time of the Census, and (b) persons usually resident but temporarily absent at the time of the Census
but not,
(c) persons temporarily present at the time of the Census who are usually resident elsewhere
Place of usual residence is the geographic place where the enumerated person usually resides. It may also be his/her legal residence. This may be either the same as, or different from, the place where he/she actually is at the time of the Census. A person's usual residence should be that where they normally sleep.
There may be difficulties in deciding usual residence for special cases. Students, migrants, those who have more than one place where they sleep, and those who spend time in institutions should be treated as usually resident at the address where they spend the majority of their night-rests. Nomads, homeless people, and those with no concept of usual address should be treated as usually resident at the place where they are enumerated.
Age
Age of person at last birthday, in single years
Babies who are less than 1 year old are given age of 0 years.
Type of household
This has two possible outcomes: 1. Living in private household
2. Living in institutional households
Household status
There are 6 outcomes for status of individuals living in private households, and a different 6 outcomes for those living in institutional households.
In private households, single person households are classified as 'Living alone'. Others' includes households of two or more persons not belonging to a family nucleus.
Institutional households are classified according to their principal purpose or target group
Educational institutions: dormitories
of educational institutions including religious schools, orphanages etc.
Health care institutions:
convalescence establishments, establishments for disabled, psychiatric
institutions, nursing homes, specialised welfare institutions or service homes
(with meal provided)
Institutions for retired or elderly
persons: old people's homes, service
homes (with meal provided), specialised shelter houses (with meal provided), specialised welfare institutions etc.
Military institutions: military
institutions or bases etc.
Religious institutions: convents,
monasteries etc.
Other institutions: non-specialised
welfare institutions, hotels, motels, tourist homes, correctional and penal
Tibi· 2 (NATIONAL LEVEL): Usual resident population by M X . age, marital and oohabltatlonal status and salectad social Indicators
Age and ag* group
Sax
Both saxes
Marital status (all persons) Total single married divorced widowed not stated
Persons living In consensual union, of which Total single married divorced widowed not stated
Others, of which Total single married divorced widowed not stated
Selected social Indicators living In multi-family private households living in a private household of 5 or more members child
lone parent non national
born outside the parent country
living outside the parent country at previous year primary level of education attainment A77or lesa tertiary level of education attainment economically inactive
attendant at educational Institutions unemployed
employer working at part time
occupation ISC01 (managers...) occupation ISC02 (professionals.)
Malea
(as for 'Both sexes')
Females (as for 'Both sexes')
Total 0
year 1 year old 2 years old 3 years old 4 years old 0-4 years old 5 years
13
TABLE 2 (National level)
Usual resident population by sex,
age, marital and cohabitational status and selected social indicators
This table should not be seen as one whole table appropriate for publication, it is, in fact, two tables, both of which are defined in terms of age (by individual years) and sex. Its purpose is to show all the information which should be produced in terms of individual age-years.
The first section shows the population by age, sex, marital status, and cohabitational status. Cohabitational status has two possible outcomes: a) persons in consensual union, and b) others (married, living alone etc.). The sum of these equals the whole population.
The second section breaks the population down by age, sex and selected social indicators.
Population base and definitions - as in Table 1
Age
Age of person at last birthday, in single years
Babies who are less than 1 year old are given age of 0 years.
Marital and cohabitational status
Table 3 (NATIONAL LEVEL) Usual resident population by sex. country of citizenship and age group Age group
Sex'citizenship
0-4 5-9 10-14 70-74 7S-7S
Both sexes'all
Total Country of citizenship
I EUROPE I I parent country 12 other EU
121 country A 122 country Β 13 EFTA 131 country A
14 European New Independent States 141 country A
15 Central Europe 151 country A 16 Remainder of Europe 161 country A 2 ASIA
21 Remainder of New independent States 211 country A
22 Middle East 221 country A 23 Remainder of Asia 231 country A 3 AMERICA 31 North America 311 country A 32 Remainder of America 321 country A 4 AFRICA 41 North Africa 411 country A 42 Remainder of Africa 421 country A 5 OCEANIA 51 country A
β OTHER (including not stated)
all
(as for 'Both sexes')
15
TABLE 3 (National level) Usual resident population by sex, country of citizenship and age group.
The main part of the table comprises data arranged to show the population by age, sex, and country of citizenship. Country is displayed hierarchically, with 'continents' as the broadest category, down to individual country level. The whole population of usual residents is covered, for both sexes together, and males and females separately.
Country classification
All countries of citizenship should be listed. Only one country of citizenship should be used for each person. In case of double citizenship, priority should be given to the parent country citizenship.
European New Independent States: Armenia, Azerbaijan, Belarus, Georgia, Republic of Moldova, Russian Federation, Ukraine
Central Europe: Albania, Bosnia and
Herzegovina, Bulgaria, Croatia, Czech Republic, Estonia, The Former
Yugoslav Republic of Macedonia, Hungary, Latvia, Lithuania, Poland, Slovakia, Slovenia, Federal Republic of Yugoslavia.
Remainder of Europe: Andorra,
Cyprus, Malta, Monaco, San Marino, Holy See (Vatican City State), Turkey Remainder of New Independent States: Kazakhstan, Kyrgyzstan, Tajikistan, Turkmenistan, Uzbekistan
Middle East: Bahrein, Iraq, Israel, Jordan, Kuwait, Lebanon, Oman, Palestine, Qatar, Saudi Arabia, Syrian Arab Republic, United Arab Emirates, Yemen
North America: Bermuda, Canada, United States
North Africa: Algeria, Egypt, Libyan Arab Jamahiriya, Morocco, Tunisia, Western Sahara
Age
Age of person at last birthday, in 5 year groups.
Table 4 (NATIONAL LEVEL) : Usual reeldent population by sex, country οΓ birth and age group Age group
Sex-country of birth
Both sexM'afl
Total Country of birth 1 EUROPE
11 parent country 12 other EU 121 country A 122 country Β 13 EFTA 131 country A
14 European New Independent States 141 country A
15 Central Europe 151 country A 16 Remainder of Europe 161 country A 2 ASIA
21 Remainder of New independent States 211 country A
22 Middle East 221 country A 23 Remainder of Asia 231 country A 3 AMERICA 31 North America 311 country A 32 Remainder of America 321 country A 4 AFRICA 41 North Africa 411 country A 42 Remainder of Africa 421 country A 5 OCEANIA 51 country A
6 OTHER (including not stated)
Males-all
(as for 'Both sexes')
Females-all
(as for 'Both sexes')
Total 10-14 70-74
[image:22.842.176.653.80.533.2]17
TABLE 4 (National level) Usual resident population by sex, country of birth and age group
The main part of the table comprises data arranged to show the population by age, sex, and country of birth. Country is displayed hierarchically, with 'continents' as the broadest category, down to individual country level. The whole population of usual residents is covered, for both sexes together, and for males and females separately.
Country classification
All countries of citizenship should be listed. Only one country of citizenship should be used for each person. In case of double citizenship, priority should be given to the parent country citizenship.
European New Independent States: Armenia, Azerbaijan, Belarus, Georgia, Republic of Moldova, Russian Federation, Ukraine
Central Europe: Albania, Bosnia and
Herzegovina, Bulgaria, Croatia, Czech
Republic, Estonia, The FormerYugoslav Republic of Macedonia, Hungary, Latvia, Lithuania, Poland, Slovakia, Slovenia, Federal Republic of Yugoslavia.
Remainder of Europe: Andorra,
Cyprus, Malta, Monaco, San Marino, Holy See (Vatican City State), Turkey Remainder of New Independent States: Kazakhstan, Kyrgyzstan, Tajikistan, Turkmenistan, Uzbekistan
Middle East: Bahrein, Iraq, Israel, Jordan, Kuwait, Lebanon, Oman, Palestine, Qatar, Saudi Arabia, Syrian Arab Republic, United Arab Emirates, Yemen
North America: Bermuda, Canada, United States
North Africa: Algeria, Egypt, Libyan Arab Jamahiriya, Morocco, Tunisia, Western Sahara
Age
Age of person at last birthday, in 5 year groups.
Taw· 5 (NATIONAL LEVEL! : Usual resident population by sex. piece of residence one year prior to tie census end ege group Age group
Sex'place of residence Both Mxee'all
Place of residence one year pnor to the census I EUROPE
I I in Í » parent country 1111n the teme address
112 in the seme NUTS 5 level piece of residence 113 eteewhere in the tame NUTS 4 lev« 114 elsewhere in the seme NUTS 3 level 115 elsewhere in ï * same NUTS 2 level 116 elsewhere In ine ssme NUTS t level 117 elsewhere In tue country 12 other EU
121countryA 122 country Β 13 EFTA 131 counöyA
14 European New independent Steles 141 countryA
15 Central Europe 131 countryA 1 β Remeinder of Europe 161 countryA 2 ASIA
21 Remainder of New independent States 211 county A
22 Middte East 221 country A 23 Remeinder of Aale 231 countryA 3 AMERICA 31 North Amanee 311 countryA 32 Remainder of America 321 countryA 4 AFRICA 41 North Africa 411 countryA 42 Remainder of Africa 421 countryA 5 OCEANIA 51 countryA
6 OTHER (including not stated) Melee'all
(SS for 'Both sexet'} Femelea'all (es for'Both sexet') Both M X · · * non nationalt {as for 'Both sexes')
5-9 10-14
19
TABLE 5 (National level) Usual resident population by sex, place of residence one year prior to the census, indicator of citizenship and age group
The main part of the table comprises data arranged to show the population by age, sex, and place (country) of residence one year prior to the census. Country is displayed hierarchically, with 'continents' as the broadest category, down to individual country level. The whole population of usual residents is covered, for both sexes together, and for males and females separately.
The fourth section of the table is a subset of the main part of the table, and shows the place of residence one year ago by age for non-nationals of the country conducting the census.
Remainder of New Independent States: Kazakhstan, Kyrgyzstan, Tajikistan, Turkmenistan, Uzbekistan
Middle East: Bahrein, Iraq, Israel, Jordan, Kuwait, Lebanon, Oman, Palestine, Qatar, Saudi Arabia, Syrian Arab Republic, United Arab Emirates, Yemen
North America: Bermuda, Canada, United States
North Africa: Algeria, Egypt, Libyan Arab Jamahiriya, Morocco, Tunisia, Western Sahara
Age
Age of person at last birthday, in 5 year groups. Babies who are less than
1 year old are given age of 0 years.
Country classification
All countries of citizenship should be listed. Only one country of citizenship should be used for each person. In case of double citizenship, priority should be given to the parent country citizenship.
European New Independent States: Armenia, Azerbaijan, Belarus, Georgia, Republic of Moldova, Russian Federation, Ukraine
Central Europe: Albania, Bosnia and Herzegovina, Bulgaria, Croatia, Czech Republic, Estonia, The Former Yugoslav Republic of Macedonia, Hungary, Latvia, Lithuania, Poland, Slovakia, Slovenia, Federal Republic of Yugoslavia.
Remainder of Europe: Andorra,
Current activity and employment status Sex Total resident population Total economically active Economically active total employed employee Employed
employer other
mptoyed
Unemployed Total
economically inactive
Economically Inactive of whlch+171 attendant at
educational Institutions
retired engaged in
family dutjes other economically Inactive parson not classifiable by a Both sexes Total
Age and age group 0-14 15 18 17 18 19 15-19 20 21 22 23 24 20-24 25 26 27 28 29 25-29 30-34 35-39 40-44 45-49 50-54 55 56 57 58 59 55-59 60 81 62 63 64 80-64 65 66 87 68 69 65-69 70 71 72 73 74 70-74 75+ Males
(as for 'Both sexes')
Females (as for 'Both sexes')
21
TABLE 6 (National level) Usual resident population by sex, age, and economic activity (current activity and employment status)
This table shows the economic activity of the population broken down by age and sex. Economic activity is split into two groups: economically active, and economically inactive. A third group includes those persons not classifiable by status.
The economically active population is then split into those who are employed, and those who are unemployed. Employed people are broken down further into three groups of
employment status:
Employee:
Those who should be counted as employees comprise all persons aged
15 and over who during the short reference period of preferably one week performed some work for pay, in cash or in kind, or were temporarily absent from the workplace where they had already worked and to which they had a formal attachment. This group excludes those who are self-employed. Employer:
Those who are self-employed or who own enterprises which exist with or without their physical presence and who, in this capacity, have engaged one or more persons, on a continuous basis, to work for him/her as 'employees'.
Other employed:
Own account workers, those producing goods or services for their own consumption, contributing family workers, members of producers' cooperatives. It also includes those who hold a 'self-employment job' but
have not employed anyone on a continuous basis.
The economically inactive population comprises all persons who were neither "employed" nor "unemployed" during the short reference period used to
measure "current activity". This population is split into four groups.
Attendant at educational institutions: Students who receive systematic instruction at any level of education, and attend full-time any regular educational institution.
Retired:
Those who receive income from property or investments, interests, rents, royalties, or pensions from former activities.
Engaged in family duties:
This includes 'homemakers' engaged in unpaid household duties in their own home, or caring for relatives or children.
Other economically inactive:
Those not falling into any of the above categories, who might be receiving public aid or private support, and, for example, children not attending school. Age
Table 7 (NATIONAL LEVEL): Usual resident population by sex. group of citizenship and economic activity (current activity and employment status) Current activity and
employment status Sex*citizerehip indicator Both sexes'all
Total Country of citizenship 1 EUROPE
11 parent country 12 other EU 13 EFTA
14 European New Independent States 15 Central Europe
16 Remainder of Europe 2 ASIA
21 Remainder of New Independent States 22 Middle East
23 Remainder of Asia 3 AMERICA 31 North America 32 Remainder of America 4 AFRICA
41 North Africa 42 Remainder of Africa 5 OCEANIA
6 OTHER (including not stated) Matassali
(as for 'Both sexes') Females'all (as for 'Both sexes')
Total resident population
Total
economically
active
Economically active total
employed
employee
Employed
employer other employed
Unemployed Total economically
inactive
Economically inactive of which attendant at
educational institutione
retired engaged in family duties
other economically
inactive
person not classifiable bystatus
o
[image:28.842.55.822.103.440.2]23
TABLE 7 (National level) Usual resident population by sex, group of citizenship, and economical activity (current activity and employment status
This table covers the whole population and shows the economic activity of the population broken down by sex and group of citizenship.
Economic activity is split into two groups: economically active, and economically inactive, a third group includes those persons not classifiable by status.
The economically active population is then split into those who are employed, and those who are unemployed. Employed people are broken down further into three groups:
Employee:
Those who should be counted as employees comprise all persons aged
15 and over who during the short reference period of preferably one week performed some work for pay, in cash or in kind, or were temporarily absent from the workplace where they had already worked and to which they had a formal attachment. This group excludes those who are self-employed. Employer:
Those who are self-employed or who own enterprises which exist with or without their physical presence and who, in this capacity, have engaged one or more persons, on a continuous basis, to work for him/her as 'employees'.
Other employed:
Own account workers (those producing goods or services for their own consumption), contributing family
workers, members of producers' cooperatives, it also includes those who hold a 'self-employment job' but have not employed anyone on a continuous basis.
The economically inactive population comprises all persons who were neither "employed" nor "unemployed" during the short reference period used to measure "current activity". This population is split into four groups.
Attendant at educational institutions: Students who receive systematic instruction at any level of education, and attend full-time any regular educational institution.
Retired:
Those who receive income from property or investments, interests, rents, royalties, or pensions from former activities.
Engaged in family duties:
This includes 'homemakers' engaged in unpaid household duties in their own home, or caring for relatives or children.
Other economically inactive:
Those not falling into any of the above categories, who might be receiving public aid or private support, and, for example, children not attending school.
Country classification
24
Georgia, Republic of Moldova, Russian Federation, Ukraine
Central Europe: Albania, Bosnia and Herzegovina, Bulgaria, Croatia, Czech Republic, Estonia, The Former Yugoslav Republic of Macedonia, Hungary, Latvia, Lithuania, Poland, Slovakia, Slovenia, Federal Republic of Yugoslavia.
Remainder of Europe: Andorra,
Cyprus, Malta, Monaco, San Marino, Holy See (Vatican City State), Turkey Remainder of New Independent States: Kazakhstan, Kyrgyzstan, Tajikistan, Turkmenistan, Uzbekistan
Middle East: Bahrein, Iraq, Israel, Jordan, Kuwait, Lebanon, Oman, Palestine, Qatar, Saudi Arabia, Syrian Arab Republic, United Arab Emirates, Yemen
North America: Bermuda, Canada, United States
Table 8 (NATIONAL LEVEL) : Usual resident population aged 15 and over, living in private households, by sex, age group, family and non-family status, and indicator of current activity
family and non-family status
Sex'current activity indicator
Both sexes'all
Total
Age group 15-19 20-24 25-29
60-64 65-69 70-74 75+
Males'all
(as for 'Both sexes')
Females'all (as for 'Both sexes')
Both sexes'economically active (as for 'Both sexes')
Both sexes'economically inactive (as for 'Both sexes')
Females*economically active (as for 'Both sexes')
Females'economically inactive (as for 'Both sexes')
Living in a family
Total child spouse cohabitant lone
parent
Not living in a family living
alone
26
TABLE 8 (National level) Usual resident population aged 15 and over, living in private households, by sex, age group, family and non-family status, and indicator of current activity
This table should be considered in two separate parts. The first part shows the population aged 15 and over by sex, age group, whether living in family, and position in family. Persons living in a family are classified as either
child, spouse, cohabitant, or lone
parent. Those who are not living in a
family are classified as either living
alone or other. Other includes two or
more persons not belongin to a family nucleus.
The second part of the table is similar to the first, but in addition to sub-dividing the population by age, it is broken down by economic activity (with two outcomes - active and
inactive).
Age
Table 9 (NATIONAL LEVEL) : Female resident population aged 15 and over by age group, family situation, and current activity status
famity situation
current activity status
All women
Total
Age group 15-19 20-24 25-29
60-64 65-69 70-74 75+
Economically active
(as for 'all women')
Employed
(as for 'all women')
Unemployed
(as for 'all women')
Economically inactive
(as for 'all women')
Persons not classified by status
(as for 'all women')
with partner or spouse Total without
child
Youn£
0 1 2 3 4
lest child aged
5 6 7-12 13-18 19-24 25+
without partner nor spouse Total without
child
Youngest child aged
0 1 2 3 4 5 6 7-12 13-18 19-24 25+
[image:33.842.67.792.133.468.2]28
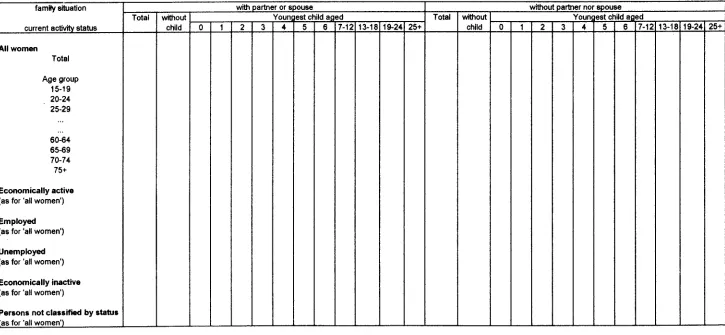
TABLE 9 (National level) Female resident population aged 15 and over by age group, family situation, and current activity status
This table considers a population base of all females aged 15 years or over living in private households.
The table shown is a concatenation of two separate tables. The first shows the population base by age group, and family situation. Age is grouped in 5 year age groups. Family situation is classified at two levels. The highest dimension shows whether a person is
with partner or spouse, or without
partner or spouse. A second dimension shows the age of a person's youngest child, or indicates that they are without child.
The second part of the table shows the same information for family situation, but breaks the population by economic activity status in addition to age group. The highest dimension of economic activity is bivariate - active or inactive.
The economically active part of the population is split into those employed
and those unemployed.
Age
Age of person at last birthday, in 5 year groups. Only those aged 15 years and over are included.
Age of youngest child
Table 10 (NATIONAL LEVEL) : Usual resident population by sex, indicator of citizenship, age and highest level of educational attainment Highest level of educational attainment
Sex'citizenship indicator Both sexes*ail
Total Age 0-14 1b 16 1/ 18 ia 15-19
20 21 22 23 24 20-24
2Í) 26 2/ 28 29 25-29 30-34 35-39 85-90 90-94 85+ Males'all
(as for 'Both sexes') Females'all (as for 'Both sexes')
Both sexes* non-nationals other EU citizens (as for 'Both sexes')
Both sexes* non-nationals non EU citizens (as for 'Both sexes')
Males* non-nationals other EU citizens (as for 'Both sexes')
Males* non-nationals non EU citizens (as for 'Both sexes')
Females* non-nationals other EU citizens (as for 'Both sexes')
Females* non-nationals non EU citizens (as for 'Both sexes')
Total No education at all
Pre primary (ISCED 0)
Primary (ISCED 1)
Lower secondary (ISCED 2) Total
Upper secondary
ISCED 3c ISCED 3b ISCED 3a Post secondary
ISCED 4 Total
Tertiary
ISCED 5b ISCED 5a ISCED 6
[image:35.842.61.821.84.521.2]30
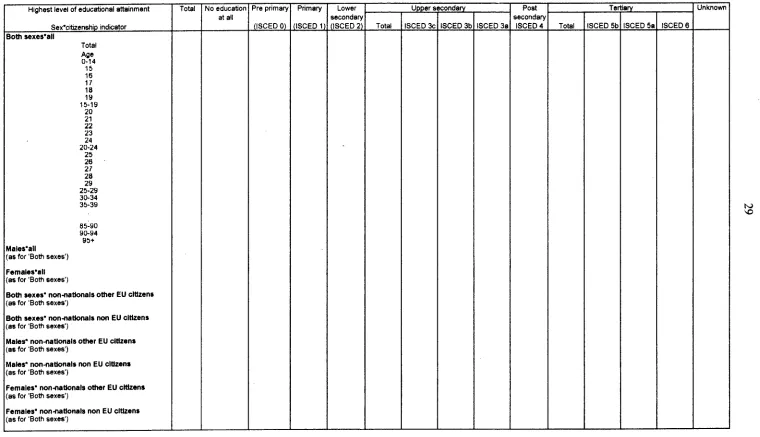
TABLE 10 (National level) Usual Resident population by sex, indicator of citizenship, age and highest level of educational attainment
This table is divided into two separate parts. The first part shows the population by age, sex, and highest level of educational attainment.
The second section of the table is a subset of the main part of the table, and shows the educational attainment (by sex and age) for non-nationals of the country conducting the census. This is broken down to show separate figures for EU citizens and non-EU citizens.
Educational attainment
Educational attainment refers essentially to the highest level successfully completed in the educational system of the country where the education was received. If relevant, "educational attainment" should take into account all deliberate, systematic and organised communication designed to bring about learning, even if these were provided outside schools and universities.
Information on educational attainment should be collected for all persons above the maximum age for starting compulsory schooling
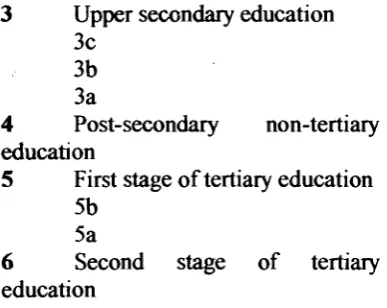
Countries should compile their data in accordance with the latest available revision of International Standard Classification of Education (ISCED). This is as follows:
0 1 2
No education at all Pre-primary education Primary education
Lower secondary education
3 Upper secondary education 3c
3b 3a
4 Post-secondary non-tertiary education
5 First stage of tertiary education 5b
5a
6 Second stage of tertiary education
No official denomination is used for 3c, 3b, 3a, 5b and 5a level, as each country defines in agreement with UNESCO what are its particular
educational programmes corresponding to each level.
Special attention needs to be paid to establishing the appropriate level/grade equivalence for persons who received their education under a different or foreign system and to situations where the educational system may have changed more than once.
Necessary deviations from the recommended definitions and classifications that result from particular characteristics of the national educational system should be explained in census publications. As a general commentary it can be said that:
level 5 typically corresponds to tertiary programmes which do not lead directly to an advanced research qualification (level 6 includes doctorates only), of which level 5a includes mostly usual university degrees, and level 5b mostly vocational programmes.
[image:36.595.300.494.75.229.2]31
education, of which level 3a are programmes designed to provide direct acces to ISCED 5a, level 3b are programmes designed to provide direct acces to ISCED 5b, and level 3c are programmes not designed to lead directly to ISCED 5 programmes.
Age
Age of person at last birthday, in whole numbers up to 30 years old, and in 5 year groups thereafter.
Highest lavai of educational attainment
Sex'aae group
Total No education atad
Pra primary
(ISCED 0)
Primary
(ISCED 1) Lower secondary (ISCED 2) Total
Upper secondary
ISCED 3c ISCED 3b ISCED 3a Pott secondary
ISCED 4
Tertiary Unknown
Total ISCED 5c ISCED Sa ISCED 6
Both sexes-all
Total
Current economic activity and occupation (ISCO-COM 1 digit)
Employed of which:
Legislatore, senior officials and managers (ISCO-COM 1) Professionals (ISCO-COM 2)
Technicians and associate professionals (ISCO-COM 3) Clerks (ISCO-COM 4)
Service workers and shop and market sales workers (ISCO-COM 5) Skill agricultural and Ashen/ workers (ISCO-COM β)
Craft and relative workers (ISCO-COM 7)
Plant and machine operators and assemblers (ISCO-COM 8) Elementary occupations (ISCO-COM 9)
Armad forcea (ISCO-COM 0) Unemployed
Economically Inactive Persons not classified by status
Males'all (as for 'Both sexes')
Famales'all (as for 'Both sexes')
Both sexes'aged 16-24 (as for 'Both sexes')
Both sexes'aged 26-34 (as for 'Both sexes')
Both sexes'aged 35-64 (as for 'Both sexes')
Both sexes'aged 66-74 (as for 'Both sexes')
males'aged 16-24 (as for 'Both sexes')
males'aged 26-34 (as for 'Both sexes')
males'aged 35-64 (as for 'Both sexes')
males'aged 55-74 (as for 'Both sexes')
females-aged 16-24 (as for 'Both sexes')
females-aged 26-34 (as for 'Both sexes')
females-aged 36-64 (as for 'Both sexes')
females'aged 66-74 (as for 'Both sexes')
33
TABLE 11 (National level) Resident population aged 15-74 by sex, age group, highest level of educational attainment, current activity and occupation
Educational attainment
Educational attainment refers essentially to the highest level successfully completed in the educational system of the country where the education was received, if relevant, "educational attainment" should take into account all deliberate, systematic and organised communication designed to bring about learning, even if these were provided outside schools and universities.
Information on educational attainment should be collected for all persons above the maximum age for starting compulsory schooling
Countries should compile their data in accordance with the latest available revision of International Standard Classification of Education (ISCED). This is as follows:
* No education at all 0 Pre-primary education
1 Primary education
2 Lower secondary education 3 Upper secondary education
3c 3b 3a
4 Post-secondary non-tertiary education
5 First stage of tertiary education 5b
5a
6 Second stage of tertiary education
No official denomination is used for 3c, 3b, 3a, 5b and 5a level, as each country defines in agreement with UNESCO what are its particular
educational programmes corresponding to each level.
Special attention needs to be paid to establishing the appropriate level/grade equivalence for persons who received their education under a different or foreign system and to situations where the educational system may have changed more than once.
Necessary deviations from the recommended definitions and classifications that result from particular characteristics of the national educational system should be explained in census publications. As a general commentary it can be said that:
level 5 typically corresponds to tertiary programmes which do not lead directly to an advanced research qualification (level 6 includes doctorates only), of which level 5a includes mostly usual university degrees, and level 5b mostly vocational programmes.
34
Current economic activity
Current economic activity status is the current relationship of a person to economic activity, based on a brief reference period such as one week or one day. the use of the "current activity" is considered most appropriate for countries where the economic activity of people is not influenced much by seasonal or other factors causing variations over the year, and it is recommended that countries in the ECE region collect information in the census on activity status based on this concept (i.e. the "labour force" concept). A time-reference period of one week should preferably be used, which may be either a specified recent fixed calendar week or the last seven days prior to enumeration.
Occupation
Occupation refers to the type of work done in a job. For purposes of international comparisons, it is recommended that countries make it possible to prepare tabulations in accordance with the latest revision available of the International Standard Classification of Occupations (ISCO).
At the time the present set of census recommendations was approved, the latest revision available was the one that was developed by the Fourteenth International Conference of Labour Statisticians (ICLS) in 1987 and adopted by the Governing Body of the International Labour Organisation (ILO) in 1988. Countries belonging to the European Economic Area should refer to ISCO-88 (COM).
Countries should code the collected occupational data at the lowest possible level supported by the responses. Some countries find it useful to ask for both the occupational title and a brief description of tasks and duties and duties performed on the job by each active person.
Countries coding "occupation" according to a national standard classification can establish correspondence with ISCO either through double coding or through "mapping" from the detailed groups of the national classification to ISCO Age
Table 12 (NATIONAL LEVEL) : Population in private households by sex, age group, indicator of citizenship and household size
Age group
Sex*citizenship indicator
Both sexes*all
Total
household size (number of members) 1 person
2 persons 3 persons 4 persons 5 persons 6 persons 7 persons or more
Males'all
(as for 'Both sexes')
Females*all (as for 'Both sexes')
Both sexes* non nationals other EU citizens (as for 'Both sexes')
Both sexes'non nationals non EU citizens (as for 'Both sexes')
Total 0-4 5-9 10-14 80-84 85-89
•
90-94 95-99 100+
[image:41.842.71.811.115.471.2]36
TABLE 12 (National level) Population in private households by sex, age group, indicator of citizenship and household size
This table is divided into two separate parts. The first part shows the population in private households by age, sex, and household size.
The second section of the table is a subset of the main part of the table, and shows the household size (by age and sex) for non-nationals of the country conducting the census. This is broken down to show separate figures for EU citizens and non-EU citizens.
Private households
The ECE/Eurostat recommendations accept two different concepts of a private household, one described as the 'housekeeping unit concept' and the other as the 'household-dwelling' concept, with a preference for the first one, based on economic relationships between members.
However, in the European Union context, the use of one concept or the
other does not lead to greatly differing household structures. Moreover, countries which use the "housekeeping unit" concept are always able to aggregate their results according to the more simple "household-dwelling" concept, while the contrary is often impossible.
So, for the priority statistical tables, it is recommended that countries use the "household-dwelling" definition of private households consisting of "the aggregate number of persons occupying a housing unit".
Household size (number of members)
Private households should be classified by size according to the total number of resident members in the household.
Age
Age of person at last birthday, in 5 year groups, last group being 100 and over.
Table 13 (NATIONAL LEVEL) : Usual resident population by sex, age group, and family situation Age group
Sex
Both sexes*all
Total
family situation 1 CHILD
11 living with both parents married 110 with no other child
111 with only one other child 112 with two or more other children 12 living with both parents cohabiting 120 with no other child
121 with only one other child 122 with two or more other children 13 living with a lone parent 130 with no other child 131 with only one other child 132 with two or more other children 2 SPOUSE
21 living with no child 22 living with only one child 23 living with two children 24 living with three children or more 3 COHABITANT
31 living with no child 32 living with only one child 33 living with two children 34 living with three children or more 4 LONE PARENT
41 living with only one child 42 living with two children 43 living with three children or more 5 PERSON LIVING ALONE β OTHER
61 living in private householde with members of a family nucleus 62 living in private households with others no members of a family nucleus 63 living in institutional households
64 living in other households
Males'all
(as for 'Both sexes')
Females'all
(as for 'Both sexes')
[image:43.842.71.700.88.522.2]38
TABLE 13 (National level) Usual resident population by sex, age group, and family situation
Family situation
Information should be derived for all persons on their family status. The classification used in the table is hierarchical, with 3 levels. At the highest level, individuals should be marked as child, spouse, cohabitant,
lone parent, person living alone, or
other. Classes 1 - 5 and 61,62 refer to
the population living in private
households and class 63 to the population living in institutional households (including Homeless). Levels 2 and 3 identify whether individuals are living with other adults and children.
Age
Table 14 (NATIONAL LEVEL) : Usual resident population by sex, indicator of citizenship, family status and housing situation (type of living quarters and tenure status)
type of living quarter and tenure status sex'indicator of citizenship
Both sexes'all
Total
family status 1 CHILD
11 living with both parents 12 living with a lone parent 2 SPOUSE
21 living with no child
22 living with at least one child 3 COHABITANT
31 living with no child
32 living with at least one child 4 LONE PARENT
5 PERSON LIVING ALONE 6 OTHER
Males'all
(as for 'Both sexes')
Females'all
(as for 'Both sexes')
Both sexes'non nationals other EU citizens
(as for 'Both sexes')
Both sexes'non nationals non EU citizens
(as for 'Both sexes')
total living in households in conventional dwellings total owner
occupied
tenants other forms of tenure
living in households in non conventional
dwellings
[image:45.842.73.753.102.497.2]40
TABLE 14 (National level)
Usual resident population by sex,
indicator of citizenship, family status and housing situation
This table is divided into two separate parts. The first part shows the statistics for the whole population
The second section of the table is a subset of the main part of the table, and shows the same information for non-nationals of the country conducting the census only. This is broken down to show separate figures for EU citizens and non-EU citizens.
Family status
Family status is less detailed than family situation, and gives information on the people sharing a dwelling, but not, for example, the number of children in the dwelling. Information on Family Status should be collected for all persons.
Housing situation
At the highest level, people are divided into three categories: conventional dwellings, non-conventional dwellings, and those living in households in collective living quarters.
Conventional dwellings
These are generally defined as a room or suite of rooms and its accessories (e.g. lobbies, corridors) in a permanent building or structurally separated part thereof which has been designed for habitation by one private household all the year round and is not at the time of the census used wholly for non-residential purposes. It should have separate access to the street, direct or via a garden or grounds, or to a common space within the building (staircase, passage, gallery, etc.), but it
need not necessarily have a bathroom or toilet available for the exclusive use of its occupants. A 'permanent building' is one which was constructed to be structurally stable for at least ten years, but some countries may wish to define permanence instead in terms of the method of construction or in terms of the building material used in the country. Detached rooms for habitation which are clearly designed to be part of the dwelling should be included, e.g. a room or rooms above a detached garage. A conventional dwelling is counted for census purposes whether or not it is occupied, although some topics and consequently some parts of the tabulation programme apply only to occupied conventional dwellings.
Individuals in conventional dwellings are broken down further to describe their tenancy situation. There are three alternatives:
a) Owner-occupied: Households of which a member is the owner of the housing unit. Households which are in the process of paying offa mortgage in the housing unit in which they live or in purchasing their housing unit over time under other financial arrangements should be classed as owner-occupied
b) Tenants: Households of which a member is a main-tenant of all or part of the housing unit, or a sub-tenant of an owner-occupier or main tenant c) Other forms of tenure: Households occupying all or part of a housing unit under some other form of tenure. Non-conventional dwellings
41
time of the census as the principal usual residence of one or more persons who are members of one or more private households. All of these are grouped under the term 'non-conventional' dwellings, the main distinction between their treatment for census purposes and the treatment of conventional dwellings being, first, that they are counted only if they are occupied in the sense defined above, and, second, that certain census topics do not apply to them (they are accordingly excluded from parts of the table programme). Non-conventional dwellings may include the following:
mobile housing units, semi-permanent housing units and other housing units designed (or not designed) for habitation.
Collective living quarters
Table 15 (NATIONAL LEVEL) : Employed persons aged 15 and over by sex, age group, Indicator of citizenship and occupation
Age group Sex*citizenship indicator Both sexes'all
Total
Occupation (ISCO-COM 1 digit level) Legislators, seniors officials and managers (ISCO-COM 1) Professionals (ISCO-COM 2)
Technicians and associate professionals (ISCO-COM 3) Clerks (ISCO-COM 4)
Service workers and shop and market sales workers (ISCO-COM 5) Skill agricultural and fishery workers (ISCO-COM 6)
Craft and relative workers (ISCO-COM 7)
Plant and machine operators and assemblers (ISCO-COM 8) Elementary occupations (ISCO-COM 9)
Armed forces (ISCO-COM 0)
Males'all (as for 'Both sexes') Females'all (as for 'Both sexes')
Both sexes'non nationals other EU citizens (ae for 'Both sexes')
Both sexes'non nationals non EU citizens (as for 'Both sexes')
Males'non nationals other EU citizens (as for 'Both sexes')
Males'non nationals non EU citizens (as for 'Both sexes')
Females*non nationals other EU citizens (as for 'Both sexes')
Females'non nationals non EU citizens (as for 'Both sexes')
[image:48.842.73.684.92.530.2]43
TABLE 15 (National level) Employed persons aged 15 and over by sex, age group, indicator of citizenship and occupation
This table is divided into two separate parts. The first part shows all employed persons aged 15 and over by age, sex, and occupation.
The second section of the table is a subset of the main part of the table, and shows employed persons aged 15 and over by sex, age group, and occupation for non-nationals of the country conducting the census. This is broken down to show separate figures for other EU citizens and non-EU citizens.
Occupation
Occupation refers to the type of work done in a job. For purposes of international comparisons, it is recommended that countries make it possible to prepare tabulations in accordance with the latest revision available of the International Standard Classification of Occupations (ISCO). At the time the present set of census recommendations was approved, the latest revision available was the one that was developed by the Fourteenth International Conference of Labour
Statisticians (ÌCIJS) in 1987 and adopted by the Governing Body of the International Labour Organisation (ILO) in 1988. Countries belonging to the European Economic Area should refer to ISCO-88 (COM).
Countries should code the collected occupational data at the lowest possible level supported by the responses. Some countries find it useful to ask for both the occupational title and a brief description of tasks and duties and duties performed on the job by each active person.
Countries coding "occupation" according to a national standard classification can establish correspondence with ISCO either through double coding or through "mapping" from the detailed groups of the national classification to ISCO. This table should be constructed using occupation classification at the ISCO-COM 1 digit level.
Age
Tibie 16 (NATIONAL LEVEL) : Employed persone aged 15 and over by sex, age group and detailed occupation
Major age group
Sex
Both sexes'all
Total
Detailed occupation (ISCO-COM 3 digit level) Legislators, senior officials and managers (ISCO-COM 1 ) ISCO-COM 11
ISCO-COM111
Professional» (ISCO-COM 2) ISCO-COM 21
ISCO-COM211
Technicians and associate professionals (ISCO-COM 3) ISCO-COM 31
ISCO-COM311
Clerks (ISCO-COM 4) ISCO-COM 41 ISCO-COM 411
Service workers and shop and market sales workers (ISCO-COM 5) ISCO-COM 51
ISCO-COM 511
Skill agricultural and fishery workers (ISCO-COM 6) ISCO-COM 61
ISCO-COM 611
Craft and relative workers (ISCO-COM 7) ISCO-COM 71
ISCO-COM 711
Plant and machine operators and aesembiers (ISCO-COM 8) ISCO-COM 81
ISCO-COM 811
Elementary occupations (ISCO-COM 9) ISCO-COM 91
ISCO-COM 911
Armed forces (ISCO-COM 0)
Males-all (as for 'Both sexes')
Females'all (as for 'Both sexes')
Total 15-24 25-34 35-54 55-74 75+
45
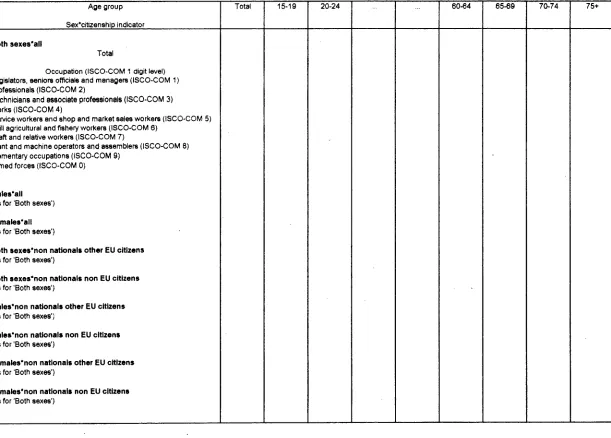
TABLE 16 (National level) Employed persons aged 15 and over by sex, age group, and detailed occupation
This table considers only the employed population aged 15 years and over, breaking it down by age, sex, and detailed occupation, at the ISCO-COM 3 digit level.
Detailed occupation
Occupation refers to the type of work done in a job. For purposes of international comparisons, it is recommended that countries make it possible to prepare tabulations in accordance with the latest revision available of the International Standard Classification of Occupations (ISCO). At the time the present set of census recommendations was approved, the latest revision available was the one that was developed by the Fourteenth International Conference of Labour Statisticians (ICLS) in 1987 and adopted by the Governing Body of the International Labour Organisation
(ILO) in 1988. Countries belonging to the European Economic Area should refer to ISCO-88 (COM).
Countries should code the collected occupational data at the lowest possible level supported by the responses. Some countries find it useful to ask for both the occupational title and a brief description of tasks and duties and duties performed on the job by each active person.
Countries coding "occupation" according to a national standard classification can establish correspondence with ISCO either through double coding or through "mapping" from the detailed groups of the national classification to ISCO This table should be constructed using occupation classification at the ISCO-COM 3 digit level.
Age