White Rose Research Online URL for this paper:
http://eprints.whiterose.ac.uk/130807/
Version: Published Version
Article:
Gregory-Smith, I. orcid.org/0000-0001-9383-6621 and Wright, P. (2018) Winners and
losers of corporate tournaments. Oxford Economic Papers. ISSN 0030-7653
https://doi.org/10.1093/oep/gpy033
eprints@whiterose.ac.uk
https://eprints.whiterose.ac.uk/
Reuse
This article is distributed under the terms of the Creative Commons Attribution (CC BY) licence. This licence
allows you to distribute, remix, tweak, and build upon the work, even commercially, as long as you credit the
authors for the original work. More information and the full terms of the licence here:
https://creativecommons.org/licenses/
Takedown
If you consider content in White Rose Research Online to be in breach of UK law, please notify us by
Winners and losers of corporate
tournaments
By Ian Gregory-Smith
aand Peter W. Wright
baUniversity of Sheffield b
Department of Economics, University of Sheffield, 9 Mappin Street, Sheffield S1 4DT; e-mail: p.wright@sheffield.ac.uk
Abstract
In a corporate tournament, executive directors are motivated by the prospect of promotion to CEO, with winners receiving large increases in remuneration. Tournament losers by contrast face a discrete loss in their valuation of their position, since the prospect of them becoming CEO is substantially reduced. We argue that this offers an opportunity to test the predictions of tournament theory by observing the quit behaviour and the wages of the losing directors. We find a sharp increase in the likelihood that directors leave the firm when the tournament ends. The directors who remain receive an increase in their remuneration following a rival’s promotion.
JEL classifications: J30, J31, J32.
1. Introduction
The Chief Executive Officer (CEO) and their executive board are thought to play a pivotal role in the success or failure of modern corporations. This is reflected in their pay, the escal-ation of which has been the subject of intense debate amongst academics, industry partici-pants, and reformers alike (Gabaix and Landier, 2008;Kaplan and Rauh, 2013;Piketty, 2014).
Whilst the upward trend in executive remuneration is noteworthy, the largest single pay rise in a director’s career occurs at the moment at which they are promoted to the CEO pos-ition (Mainet al., 1993). In order to understand why this might be the case, we need to understand the mechanisms by which executive pay is set. Neoclassical theory posits that all workers, including executives, are rewarded according to their marginal productivity, which in turn is determined by the demand for their human capital. However, many com-mentators have been sceptical about whether the very large increases observed on promo-tion actually reflect a step change in productivity. More recently, and especially following the escalation of CEO pay since the mid-1970s (Murphy, 1999), economists have explored the possibility that pay at the top may be determined by other factors.Gabaix and Landier
(2008)develop a model in which the best CEOs are competitively matched to the largest,
VCOxford University Press 2018.
This is an Open Access article distributed under the terms of the Creative Commons Attribution License
(http://creativecommons.org/licenses/by/4.0/), which permits unrestricted reuse, distribution, and reproduction in any medium, provided the original work is properly cited.
Oxford Economic Papers, 2018, 1–19 doi: 10.1093/oep/gpy033
w
n
lo
a
d
e
d
fro
m
h
ttp
s:
//a
ca
d
e
mi
c.
o
u
p
.co
m/
o
e
p
/a
d
va
n
ce
-a
rt
icl
e
-a
b
st
ra
ct
/d
o
i/1
0
.1
0
9
3
/o
e
p
/g
p
y0
3
3
/5
0
6
2
6
9
0
b
y
U
n
ive
rsi
ty
o
f S
h
e
ffi
e
ld
u
se
r
o
n
2
7
S
e
p
te
mb
e
r
2
0
1
most productive, firms. The growth of CEO pay can then also be explained by the growth in average firm size. An alternative view is provided by ‘managerial power’ theories which suggest that CEOs inflate their pay via their influence on the pay-setting process (Bebchuk
and Fried, 2003,2004), thus breaking the link to productivity. The advocates of corporate
tournament theory (e.g.Lazear and Rosen, 1981) instead argue that the large CEO ‘prize’ is central to how organisations structure their incentives and motivate their workers. The logic of this is that, within each level of the corporate hierarchy, a tournament develops whereby success at one level leads to both higher earnings and entry into the next level of the promotion competition (Rosen, 1986). At the highest level, the pay of the CEO reflects ultimate victory and serves to incentivise those at lower levels. It is the relevance of this last theory on which this paper primarily focuses.
How then might we seek to distinguish between tournament theory and other theories of wage determination? In this paper, we look at the compensation of all board members, especially those who miss out on a promotion to CEO. We suggest that this provides add-itional relevant information and the prospect of a cleaner test of the theory. We argue that since the promotion event is a potential cause of dissatisfaction amongst the remaining directors who had hoped to win the coveted position, if the firm wishes to retain these exec-utives, then we would observe wage increases for tournament losers. These are otherwise hard to explain.
Moreover, by drawing on a panel of both winning and losing executives, we are able to adjust for non-random attrition when estimating executive pay equations. Prior discussions of attrition in panel data settings have tended to conclude that attrition, whilst of theoretic-al concern, is often of secondary practictheoretic-al importance (Fitzgertheoretic-aldet al., 1998). However, in our context, this is potentially important as losing executives may leave the firm and bias the measured impact of the tournament on the executives who remain. Indeed, in our panel of winning and losing directors, the correction for attrition is statistically significant and impacts on the values of the estimated coefficients. We argue that future estimates of execu-tive pay equations and tests of tournament theory should therefore adjust for such attrition.
2. Tournament theory
The starting point for theoretical modelling of tournament theory is the paper of Lazear
andRosen (1981), in which two risk-neutral workersði¼j;kÞcompete for promotion. The
likelihood of promotionpdepends upon the level of outputqiattributable to the worker, which in turn is a function of the efforteiof the individual and luckli.The cost of effort
C(e) is positive and increasing (C0>0;C00>0).
On the assumption that the individuals seek to maximise their expected utility, the firm will choose the payoffs for the winnerW1and loserW2in order to maximise effort. In equi-librium, equating the marginal benefit to the marginal cost of effort gives:
ðW1W2Þdp=dei¼dCi=dei (1)
Hence, the marginal benefit of effort is increasing in the prize differential ðW1W2Þ. Extensions to the basic model suggest: the prize should also be increasing in the number of participants, since an increase in the number of players leads to a fall in the probability of winning and hence a fall in the expected return to a marginal increase in effort; a firm hier-archy should exhibit increasing growth in remuneration from one level to the next, as the number of additional promotion opportunities decreases. At the highest level, the difference
D
o
w
n
lo
a
d
e
d
fro
m
h
ttp
s:
//a
ca
d
e
mi
c.
o
u
p
.co
m/
o
e
p
/a
d
va
n
ce
-a
rt
icl
e
-a
b
st
ra
ct
/d
o
i/1
0
.1
0
9
3
/o
e
p
/g
p
y0
3
3
/5
0
6
2
6
9
0
b
y
U
n
ive
rsi
ty
o
f S
h
e
ffi
e
ld
u
se
r
o
n
2
7
S
e
p
te
mb
e
r
2
0
1
between winning and losing must compensate for the fact that there are no further opportu-nities for advancement (Eriksson, 1999).
The extant empirical evidence on compensation within organisations is broadly support-ive of tournament theory (Mainet al.,1993;Eriksson, 1999;Bognanno, 2001) in that effort is seen to increase with the value of the prize, particularly when the field of players is of a similar calibre.1However, a number of caveats apply to these findings: first, as noted by Prendergast (1999), a prize-effort correlation is evidence that incentives matter but not ne-cessarily that the reward structures have been designed to elicit the responses predicted by tournament theory. For instance,Rosen (1981)advances a marginal productivity justifica-tion for the convexity of remunerajustifica-tion through job grades, on the reasonable assumpjustifica-tion of imperfect substitutability of talent. Second, a number of problems exist in attempting a structural test of the theory. Theoretical settings of tournament theory typically model a closed competition in which the players in the tournament are clearly defined. In reality, employees in corporations are free to move between companies, and as such the prize of being CEO can be won by an individual who was not internal to the firm.2This should properly be considered when considering the reward for winning an executive tournament, yet neitherEriksson (1999)norMainet al.(1993)consider the impact of external hires on the outcome of internal tournaments.Bognanno (2001)identifies the external hires in his dataset but only briefly considers how the presence of external hires might reduce the prob-ability of winning for the tournament player.
In this paper we argue that extra traction may be gained by considering the losers of tournaments. The logic for this is provided by an implication of the model of Lazear and Rosen (1981): participants in the tournament endure pay below market rates because they value the chance of promotion (Mainet al., 1993). However, once they have lost the tour-nament, the expectation of their future income has fallen. If their chance of promotion has completely gone, then their pay should return to their external market level. In the context of middle managers,Gibbs (1995)examines a single firm and shows that when a manager is passed over for promotion, their performance declines. This is attributed to a failure by the firm to compensate for the forgone promotion incentive since, in the context of middle managers, the cost of running a more sophisticated pay scheme which updates to counter the loss of promotion incentive may be large. In our setting, where the pay of top executives is reviewed by a remuneration committee with the assistance of pay consultants, any ad-ministrative costs should be outweighed by getting the incentives correct.
A potential complication of rewarding tournament losers may exist if firms resist increasing their compensation because they fear that it will dilute the promotion incentive. Firms may instead elect for an ‘up or out’ employment model (Kahn and Huberman, 1988;
Sattinger, 1993;Gibbons and Waldman, 1999) so as to increase the differential between
1 Given that corporate wage structures are broadly consistent with the predictions of tournament
theory, research byKaleet al.(2009)has sought to examine whether tournament incentives are
successful in delivering increases in profitability.Kaleet al.(2009)find a strong and robust
relation-ship between the prize differential and firm performance. Of particular significance for this study is their finding that the tournament incentive is strongest when a new CEO appointment is due and weakest when a new CEO has just been appointed, consistent with the view that directors suffer a loss in promotion incentives following a rival’s appointment to CEO.
2 To avoid this problem, prior studies have focused on sporting or other closed-form competitions
which preclude the possibility of an external winner.
D
o
w
n
lo
a
d
e
d
fro
m
h
ttp
s:
//a
ca
d
e
mi
c.
o
u
p
.co
m/
o
e
p
/a
d
va
n
ce
-a
rt
icl
e
-a
b
st
ra
ct
/d
o
i/1
0
.1
0
9
3
/o
e
p
/g
p
y0
3
3
/5
0
6
2
6
9
0
b
y
U
n
ive
rsi
ty
o
f S
h
e
ffi
e
ld
u
se
r
o
n
2
7
S
e
p
te
mb
e
r
2
0
1
success and failure and elicit maximum effort. Hence the loss of a tournament may precipi-tate exit from the firm. This may also occur if the ‘outrage’ of shareholders prevents the compensation of the losers of a promotions competition (Bebchuk and Fried, 2003).3Such an approach would be less appropriate if large investments in firm-specific human capital are required, since an employee will be less willing to invest their time and effort into non-transferable skills if exit is a real possibility.
An additional consideration is raised byKaleet al.(2014), who analyse the likelihood of turnover for vice presidents of S&P 500 firms and find that pay inequalities within the firm increased the likelihood of exit over the period 1993–2004. In particular, when these pay inequalities are high by reference to the external market, the likelihood of exit is high. They argue that this is driven by ‘inequality aversion’ by executives. This implies that when tournament style incentives create pay differentials between the CEO and the other board members, executives are more likely to leave the firm.
The previous discussion therefore suggests two additional predictions associated with the tournament approach to remuneration. First, the loss of a tournament may lead to a wage increase for losers to compensate them for the loss of their promotion incentive; se-cond, those losers that are not sufficiently compensated may separate from the firm.
The combination of pay increases and employment separations of the sort discussed are not predicted by rival models of pay setting. A simple human capital model would not pre-dict any change in pay without an associated change in productivity. Further, to the extent that losing a competition reveals information about the individual which was previously private, the outside options of an individual might decrease following a tournament, lead-ing to a fall in wages. Finally, the match between the company and a director may also de-teriorate on the appointment of a new CEO, for example if the director finds it more difficult to work with the new management team, or the board doubts the ability of a losing director to work with the new CEO.
3. Data
The data used in this study contain information on all executive directors4of all companies in the FTSE 350 Index.5A particular advantage of our empirical setting is that we have data on the population of executives.6 The data span every financial year-end between
3 Firms may be able to ‘camouflage’ additional payments by referencing changes in remuneration
strategy to the change in CEO, and the need to realign pay with this new strategy.
4 In the UK, executive directors are those directors, including the CEO, that make up the executive
management team and participate in salary, bonus, and equity-based compensation schemes. Non-executive directors, who only receive a nominal fee for their part-time service, are not included in this sample. In the UK, there is no legal distinction between the CEO and the other
directors of a public company (Mainet al., 1996). Each director has their own service contract, and
all directors bear an equal fiduciary duty to their shareholders.
5 The ‘Manifest’ data is commercially available from Minerva Analytics.
6 In contrast, the Execucomp dataset, which is predominately used in the literature, covers only the
CEO, CFO, and the three other highest-paid officers in the company. Execucomp would be problem-atic for a study such as ours, where the focus is on the executive below CEO level. Other advan-tages of our dataset relative to Execucomp include position-level appointment and resignation dates (to the day), allowing the tracking of position changes within the boardroom, together with precise dates for the beginning and end of the financial year.
D
o
w
n
lo
a
d
e
d
fro
m
h
ttp
s:
//a
ca
d
e
mi
c.
o
u
p
.co
m/
o
e
p
/a
d
va
n
ce
-a
rt
icl
e
-a
b
st
ra
ct
/d
o
i/1
0
.1
0
9
3
/o
e
p
/g
p
y0
3
3
/5
0
6
2
6
9
0
b
y
U
n
ive
rsi
ty
o
f S
h
e
ffi
e
ld
u
se
r
o
n
2
7
S
e
p
te
mb
e
r
2
0
1
31 December 1996 and 31 December 2008, and therefore cover a full economic cycle—with market growth until 2001, decline post 9/11 and thedot.comcrash, followed by recovery be-fore the financial crisis of 2008. The dataset includes full remuneration details (other than pension benefits) on all board members, who are identified with precise appointment and res-ignation dates. To avoid survivorship bias, companies that drop out of the index prior to 2008 are included in the coverage until the company is wound up or taken private. Over the period of our data, we observe 705 companies and 6,228 company years.
We have information on 5,467 directors, with each director observed on average for 4.5 years. Certain data items, such as the return index, were obtained from Thomson Datastream.7
3.1 The incentive to win
Summary information on the remuneration of executive directors in the sample is provided
inTable 1. The incentive to win the executive competition is clear: the mean level of salary
and total remuneration is 65% and 86% more for the CEO than for other executive direc-tors. As noted previously, although this large uplift is consistent with tournament theory, it might also be a result of a CEO’s greater level of responsibility, status, and higher marginal impact on firm productivity.
3.2 The frequency and nature of tournaments
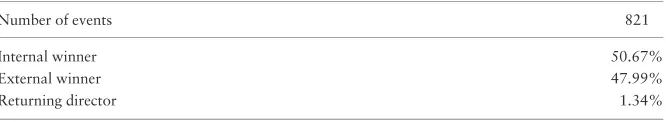
In our data, 821 tournament events are identified when there is the succession of a new Chief Executive. This amounts to one tournament for every 7.6 company years. The num-ber of tournaments peaked in 2001, although there is no strong indication of cyclicality.
[image:6.442.57.394.67.168.2]An interesting feature of tournaments is that the prize is frequently given to an outsider (Table 2). Although a small number of these outsiders may have prior (below director-level) history with the firm that we cannot observe, it is clear that the promotions competi-tion for the CEO post is not a closed tournament as in sporting settings, and as is often
Table 1.Real remuneration by position
Salary Total Remuneration Frequency
Position Mean Std. Dev. Mean Std. Dev. NxT
CEO 420,603 318,623 1,279,526 2,365,904 4,813
Joint Chair & CEO 384,405 222,183 818,244 951,247 552
Chair 344,548 250,071 786,364 3,030,140 1,294
Finance Director 252,120 186,214 654,255 1,043,961 5,430
Executive 254,157 179,725 688,114 2,548,257 12,048
Notes: Figures are calculated on an annualised basis with the requirement that a director served at least three months of the financial year. Total remuneration is salary, bonus, perquisites together with a grant-date valu-ation of equity-based incentives (i.e. deferred bonuses, share options, and long-term incentive plans [LTIPs]). The grant-date valuation is based on one-third of the face value, adjusted for vesting conditions on LTIPs. This approach provides a very close approximation to the Black-Scholes option valuations, which are more
com-mon in the US compensation literature (seeGregory-Smith [2012]for full details.). All figures are in December
2008 prices.
Source: Author’s calculations.
7 Definitions of all variables used in the analysis are detailed inTable A1.
D
o
w
n
lo
a
d
e
d
fro
m
h
ttp
s:
//a
ca
d
e
mi
c.
o
u
p
.co
m/
o
e
p
/a
d
va
n
ce
-a
rt
icl
e
-a
b
st
ra
ct
/d
o
i/1
0
.1
0
9
3
/o
e
p
/g
p
y0
3
3
/5
0
6
2
6
9
0
b
y
U
n
ive
rsi
ty
o
f S
h
e
ffi
e
ld
u
se
r
o
n
2
7
S
e
p
te
mb
e
r
2
0
1
assumed in theoretical work. One advantage of our empirical approach, which focuses on tournament losers, is that the hypothesised impact on wages and employment is robust to internal and external appointments.8
What determines whether firms recruit internally or externally? Although this is not the focus of the paper,Table 3indicates that internal recruitment is more prevalent in firms with larger boards, and in firms that are performing better than the industry average. There is anecdotal evidence that shareholders have a preference for an external appointment when performance has not been satisfactory in the hope that a break from the incumbent managers might help turn the company around.
3.3 Tournament losers
We now turn our attention to the losing directors that the tournament produces. The ‘losers’ are defined as those directors who have served at least 12 months prior to the suc-cession event. In the case where the prior CEO continues to serve on the board,
Table 2.The nature of tournament winners
Number of events 821
Internal winner 50.67%
External winner 47.99%
Returning director 1.34%
Notes: Internal winners are identified as those CEOs who served in the same company as an executive director in the prior year. External winners are CEOs appointed from outside the existing board. We classify a small number of winners as ‘returning directors’ who have a past history with the firm but were external on appointment.
[image:7.442.56.389.67.128.2]Source:Author’s calculations.
Table 3.The determinants of internal recruitment
ln(Sales) 0.0044
(0.40)
Number of executive directors 0.074***
(7.24)
Number of non-executive directors 0.0079
(0.83)
% Insiders 0.079
(0.77)
Industry adjusted return on assets. 0.0024**
(2.16)
Observations 753
Notes: Marginal effects of probit model reported. z-statistics in parentheses. ***p<0.01, ** p<0.05,
*p<0.1.
Source:Author’s calculations.
8 We do not have access to the employment history of an external appointee unless they were
previ-ously employed within the FTSE350. Hence our focus on the losing directors of the firm in which the tournament occurs.
D
o
w
n
lo
a
d
e
d
fro
m
h
ttp
s:
//a
ca
d
e
mi
c.
o
u
p
.co
m/
o
e
p
/a
d
va
n
ce
-a
rt
icl
e
-a
b
st
ra
ct
/d
o
i/1
0
.1
0
9
3
/o
e
p
/g
p
y0
3
3
/5
0
6
2
6
9
0
b
y
U
n
ive
rsi
ty
o
f S
h
e
ffi
e
ld
u
se
r
o
n
2
7
S
e
p
te
mb
e
r
2
0
1
we distinguish between losing executive directors (‘Non-CEO’) and the losing CEO. We are also able to separate the Non-CEO losers according to their losing position: the losing Chair, the losing Finance Director (FD), and other losing executive directors.9 Table 4 shows that each tournament produces approximately three Non-CEO losers. We also dis-tinguish between losing executive directors who continue to serve on the board (‘Non-CEO stayers’) and those losing executive directors who exit the board (‘Non-CEO leavers’). Of the 2,313 Non-CEO losers, 738 exit the sample, with 56 re-employed by other firms in the FTSE350.
Table 4shows that prior to the tournament, the mean salary of Non-CEO leavers is
£33,493 higher than those who stay with the firm. This confirms our suspicion that leavers are materially different to stayers. This result is consistent withKaleet al.(2014), who find that relatively higher paid vice presidents are more likely to leave at any point in time. This is reinforced by examining the smaller sample of those who left the firm and were re-employed at the board level in another FTSE350 firm, where the difference is £79,790. A naive comparison of the earnings of losing directors before and after the tournament event would therefore ignore the fact that the directors who remain are different to those who leave. This is also illustrated in the table, where losing directors who stay in the firm receive on average salary increases of £23,845 in the year after the tournament, compared with the year before the tournament.
4. Tournaments and the probability of executive exit
As discussed above, the occurrence of a succession event is likely to precipitate exits from the board of directors. Most obviously, following a tournament, the incumbent CEO typic-ally leaves the company, although 21% stay on in some capacity (normtypic-ally as Chair) in the next period.
Table 4.Pay and exit of losing executive directors
Last year in dataset? All
No Yes
Non-CEO leaver 56 738 794
Non-CEO stayer 1,519 0 1,519
Mean Salary year prior to tournament
Non-CEO leaver 336,973 287,085 290,676
Non-CEO stayer 257,183 257,183
Mean Salary year after tournament
Non-CEO leaver 327,276 327,276
Non-CEO stayer 281,028 281,028
Notes: 794 directors (34.3%) exit the firm within 12 months of losing the tournament.
Source:Author’s calculations.
9 We checked the titles of the executive directors to ensure that their job description does not
pre-clude them from promotion to CEO. For example, it is unlikely that the Head of Human Resources would ever be in the tournament. In the UK, the Head of Human Resources is typically not an ex-ecutive director.
D
o
w
n
lo
a
d
e
d
fro
m
h
ttp
s:
//a
ca
d
e
mi
c.
o
u
p
.co
m/
o
e
p
/a
d
va
n
ce
-a
rt
icl
e
-a
b
st
ra
ct
/d
o
i/1
0
.1
0
9
3
/o
e
p
/g
p
y0
3
3
/5
0
6
2
6
9
0
b
y
U
n
ive
rsi
ty
o
f S
h
e
ffi
e
ld
u
se
r
o
n
2
7
S
e
p
te
mb
e
r
2
0
1
Also as discussed, many losers leave the company around the time of the succession event. Of those that have not won the tournament to become CEO, about one-third (34.3%) leave the company in the same year. This compares with a normal turnover rate of just under a quarter (24.3%).
Table 5looks at this process in more detail by modelling the likelihood of executive exit
for individualiusing a random-effects probit model:
Pðexitit¼1jzit;wit;ciÞ ¼UðzitatþwitbtþciÞ t¼2;. . .;T (2)
whereciis the unobserved effect andzitare the tournament variables that explain exit. In witwe include those variables used previously in the literature to explain executive turn-over. These include the characteristics of the executive (such as age), the structure of the board, and the performance of the firm. Additionally, we include variables relating to abso-lute and relative compensation, both internal and external to the firm, to reflect the argu-ments presented inKaleet al.(2014)relating to inequality aversion.
The impact of the tournament event is clearly seen, with column (1) showing that the probability of exit from the firm is raised substantially by 19 percentage points. Column (2)
ofTable 5examines how this impact varies according to whether the successor CEO is an
internal or external hire. Although both types of appointment raise the probability of exit, an enhanced probability is particularly noticeable if the appointed CEO is from outside the company.
Table 5also investigates the impact of the tournament on losing players who remain for
the next financial year. It is interesting to note that even those executives who initially stay have an enhanced probability of exit in the next year (9 percentage points, ‘Non-CEO stayer’ column (1)). In column (3), this effect is broken down by the losing executives’ pos-ition. Executive directors and Finance Directors are seen to be more likely to leave in the next year than a company’s Chair. However, column (4) suggests that the likelihood of fi-nance director exit is only significantly enhanced when the tournament’s winner is an exter-nal hire. This suggests that interexter-nal appointments reflect a broader desire to maintain the continuity of the board.
Further evidence of succession planning is evidenced by the fact that a number of CEOs who have stepped down and been replaced initially stay on in the firm. We see, however, that their likelihood of exit in the next period is high (14 percentage points, ‘CEO stayer’ column (1)).
The results above suggest that the loss of a tournament enhances the likelihood of exit. As a robustness check, we seek to confirm that the tournaments that we identify are genu-ine. We do this in two ways. First, in a small number of firms, a ‘CEO designate’ is announced which would effectively end the tournament early. As can be seen in the table, the point estimate of ‘CEO designate’ is almost identical to that of the tournament event.10 Second, we examine whether some directors may have private inside information on who the next CEO will be, and that this is unobserved to us. We do this by introducing a vari-able that anticipates the succession event (Eventtþ1). This variable is indeed statistically significant; however, its marginal impact is small—the likelihood of leaving the firm in an-ticipation of a tournament is raised by less than 2 percentage points, compared with almost 20 percentage points for the tournament itself.
10 It should be noted that the frequency of such cases in our sample is very small (four) and affects
only 19 executive-years. This to be expected in the UK, where naming a designate is very rare.
D
o
w
n
lo
a
d
e
d
fro
m
h
ttp
s:
//a
ca
d
e
mi
c.
o
u
p
.co
m/
o
e
p
/a
d
va
n
ce
-a
rt
icl
e
-a
b
st
ra
ct
/d
o
i/1
0
.1
0
9
3
/o
e
p
/g
p
y0
3
3
/5
0
6
2
6
9
0
b
y
U
n
ive
rsi
ty
o
f S
h
e
ffi
e
ld
u
se
r
o
n
2
7
S
e
p
te
mb
e
r
2
0
1
Table 5.The probability of exit after the end of a tournament
(1) (2) (3) (4)
Tournament event 0.19*** 0.19***
(22.8) (22.3)
Successor type:
Internal 0.15*** 0.15***
(16.9) (16.7)
External 0.24*** 0.24***
(20.0) (19.5)
Lost Tournament:
Non-CEO stayer 0.087*** 0.085***
(7.41) (7.19)
Chair 0.0094
(0.22)
Finance Director 0.079***
(4.66)
Executive 0.098***
(7.16) Non-CEO stayer: internal successor
Chair 0.080
(1.41)
Finance Director 0.046*
(1.87)
Executive 0.093***
(5.12) Non-CEO stayer: external successor
Chair 0.089
(1.44)
Finance Director 0.11***
(4.83)
Executive 0.10***
(5.40)
CEO stayer 0.14*** 0.14*** 0.14***
(4.63) (4.63) (4.59)
CEO stayer: Int. successor 0.12***
(2.96)
CEO stayer: Ext. successor 0.17***
(3.60) Controls:
Tournament Eventtþ1 0.020** 0.019** 0.020** 0.019**
(2.20) (2.11) (2.20) (2.10)
CEO designate 0.17*** 0.20*** 0.17*** 0.20***
(2.98) (3.62) (2.97) (3.60)
ln(Total remuneration) 0.0060 0.0044 0.0059 0.0045
(0.99) (0.73) (0.97) (0.73)
CEO*ln(Total remuneration) 0.0020** 0.0021*** 0.0021*** 0.0021***
(2.56) (2.58) (2.59) (2.66)
Relative remuneration 0.031*** 0.030*** 0.031*** 0.029***
(3.65) (3.54) (3.54) (3.34)
(continued)
D
o
w
n
lo
a
d
e
d
fro
m
h
ttp
s:
//a
ca
d
e
mi
c.
o
u
p
.co
m/
o
e
p
/a
d
va
n
ce
-a
rt
icl
e
-a
b
st
ra
ct
/d
o
i/1
0
.1
0
9
3
/o
e
p
/g
p
y0
3
3
/5
0
6
2
6
9
0
b
y
U
n
ive
rsi
ty
o
f S
h
e
ffi
e
ld
u
se
r
o
n
2
7
S
e
p
te
mb
e
r
2
0
1
We include variables relating to internal and external compensation in the regression. These provide controls for the outside options of the executives, as well as controlling for inequality aversion. It can be seen that the absolute level of executive pay has no estimated impact on turnover for board members, although there is a small retention effect for the CEO. By contrast, an executive’s compensation relative to the median executive in the firm increases the propensity to exit. This may reflect the quality of the executive relative to their peers and hence a greater number of outside opportunities. However, this is not the case for CEOs; higher-paid CEOs are less likely to exit, presumably as they have reached the zenith of the tournament, and they are less likely to gain from moving to another firm.Kaleet al.
(2014)also argue that pay inequality in the boardroom can influence turnover if individuals
[image:11.442.59.389.65.366.2]have an aversion to this. We therefore control for ‘internal inequality’ in pay by taking the log of the ratio of CEO pay to executive pay. Consistent with Kale et al. (2014), this increases the likelihood of executive exit, and so illustrates a potential cost to the firm of increasing tournament incentives. We also measure ‘external inequality’ by comparing pay inequality to a benchmark of firms of the same size (total sales quartiles by year). However, external inequality does not seem to impact on executive exit in our setting.
Table 5.Continued
(1) (2) (3) (4)
CEO*(Relative remuneration) 0.0042** 0.0039** 0.0040** 0.0038**
(2.24) (2.15) (2.18) (2.06)
Internal inequality 0.0026** 0.0025** 0.0028** 0.0024**
(2.24) (2.39) (2.44) (2.39)
External inequality 0.0031 0.0035 0.0033 0.0035
(0.66) (0.76) (0.70) (0.75)
Age 50-60 0.053*** 0.052*** 0.053*** 0.052***
(7.30) (7.30) (7.04) (7.04)
Age 60þ 0.15*** 0.15*** 0.15*** 0.15***
(8.49) (8.47) (8.27) (8.31)
Number of executive directors 0.0020 0.0030 0.0019 0.0029
(0.98) (1.48) (0.91) (1.41)
Number of non-executive directors 0.0016 0.0014 0.0015 0.0014
(0.72) (0.65) (0.68) (0.63)
% insiders 0.055** 0.052** 0.055** 0.052**
(2.30) (2.21) (2.29) (2.20)
ln(Sales) 0.0027 0.0027 0.0027 0.0028
(1.08) (1.09) (1.10) (1.14)
Industry adjusted total shareholder return 0.0025 0.0044 0.0025 0.0050
(0.34) (0.60) (0.35) (0.68)
Industry adjusted return on assets 0.0017*** 0.0016*** 0.0017*** 0.0016***
(5.65) (5.70) (5.65) (5.63)
Year dummies Yes Yes Yes Yes
observations 16,295 16,295 16,295 16,295
Notes: Estimations based on random effects probit model. Marginal effects reported. z-statistics clustered at
the level of the company in parentheses. ***p<0.01, **p<0.05, *p<0.1.
Source:Author’s calculations.
D
o
w
n
lo
a
d
e
d
fro
m
h
ttp
s:
//a
ca
d
e
mi
c.
o
u
p
.co
m/
o
e
p
/a
d
va
n
ce
-a
rt
icl
e
-a
b
st
ra
ct
/d
o
i/1
0
.1
0
9
3
/o
e
p
/g
p
y0
3
3
/5
0
6
2
6
9
0
b
y
U
n
ive
rsi
ty
o
f S
h
e
ffi
e
ld
u
se
r
o
n
2
7
S
e
p
te
mb
e
r
2
0
1
Other firm-level controls behave as would be expected: older individuals have a higher likelihood of exiting at any point in time, as do those in companies with a low return on assets in comparison with the industry mean. A board with a high percentage of insider directors also reduces the likelihood of executive exit.
5. Tournaments and executive pay
Finally, we turn to the question of the impact of CEO succession on the remuneration of board members. As we have discussed, CEO tournaments generate winners and losers. Whilst some of the losers remain on the board, some of the losers will leave. If this attrition is non-random, as we suspect it is, then this will generate bias in the estimated coefficients unless it is corrected for.
Suppose that the model to be estimated is a linear, unobserved effects panel data model as follows:
yit¼xitbþciþuit; t¼1;. . .;T (3)
whereyitis the remuneration outcome of interest,xitare its determinants, andciis the un-observed effect.Wooldridge (2002, p. 586) suggests that because of the sequential nature of the attrition process, it is natural to first difference the data in order to remove the fixed effect:
Dyit¼DxitbþDuit; t¼2;. . .;T (4)
Since, conditional on being in the sample in the previous period,si;t1¼1, selection into a periodt2 may be modelled as the outcome of a binary process,11the following attrition corrected regression can be estimated:
Dyit¼Dxitbþq2d2tkit^ þ:::þqTdTtkit^ þit; t¼2;. . .;T (5)
whered2tthroughdTt are time dummies and thekit^ are the inverse Mills ratios from the followingT– 1 probit models:
Pðsit¼1jwit;si;t1Þ ¼UðwitdtÞ t¼2;. . .;T (6)
where inwitwe include the same characteristics of the executive, the structure of the board, and the performance of the firm as inequation (2). Note that in (5) identification of the tournament effect and of the correction adjustments is achieved not just by exclusion restrictions but also by the timing of the executive pay setting process: the tournament event occurs att– 1 and affects the likelihood of executive exit, and hence the probability of sur-vival betweent– 1 andt; the final settlement of executive pay is determined by the firm’s remuneration committee at timet. Hence, when pay is determined, the outcome of the tournament is known, with individuals either having triumphed or lost, and possibly left the firm.
Table 6reports the results for salary, withTable 7the impact on total remuneration.
The first column of each table reports a fixed-effects regression (equation 3), which is standard in the literature, and gives the mean within-individual difference in salary for the
11 For simplicity we assume that such attrition is an ‘absorbing state’ in that once a person drops
out of the sample they do not re-enter. This is an approximation in our data since 56 losers reappear as directors in other FTSE 350 companies.
D
o
w
n
lo
a
d
e
d
fro
m
h
ttp
s:
//a
ca
d
e
mi
c.
o
u
p
.co
m/
o
e
p
/a
d
va
n
ce
-a
rt
icl
e
-a
b
st
ra
ct
/d
o
i/1
0
.1
0
9
3
/o
e
p
/g
p
y0
3
3
/5
0
6
2
6
9
0
b
y
U
n
ive
rsi
ty
o
f S
h
e
ffi
e
ld
u
se
r
o
n
2
7
S
e
p
te
mb
e
r
2
0
1
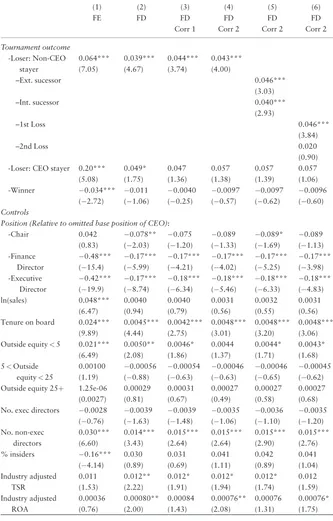
Table 6.The salary of directors
(1) (2) (3) (4) (5) (6)
FE FD FD FD FD FD
Corr 1 Corr 2 Corr 2 Corr 2
Tournament outcome -Loser: Non-CEO
stayer
0.064*** 0.039*** 0.044*** 0.043***
(7.05) (4.67) (3.74) (4.00)
–Ext. sucessor 0.046***
(3.03)
–Int. sucessor 0.040***
(2.93)
–1st Loss 0.046***
(3.84)
–2nd Loss 0.020
(0.90)
-Loser: CEO stayer 0.20*** 0.049* 0.047 0.057 0.057 0.057
(5.08) (1.75) (1.36) (1.38) (1.39) (1.06)
-Winner 0.034*** 0.011 0.0040 0.0097 0.0097 0.0096
(2.72) (1.06) (0.25) (0.57) (0.62) (0.60) Controls
Position (Relative to omitted base position of CEO):
-Chair 0.042 0.078** 0.075 0.089 0.089* 0.089
(0.83) (2.03) (1.20) (1.33) (1.69) (1.13)
-Finance Director
0.48*** 0.17*** 0.17*** 0.17*** 0.17*** 0.17***
(15.4) (5.99) (4.21) (4.02) (5.25) (3.98) -Executive
Director
0.42*** 0.17*** 0.18*** 0.18*** 0.18*** 0.18***
(19.9) (8.74) (6.34) (5.46) (6.33) (4.83)
ln(sales) 0.048*** 0.0040 0.0040 0.0031 0.0032 0.0031
(6.47) (0.94) (0.79) (0.56) (0.55) (0.56)
Tenure on board 0.024*** 0.0045*** 0.0042*** 0.0048*** 0.0048*** 0.0048***
(9.89) (4.44) (2.75) (3.01) (3.20) (3.06)
Outside equity<5 0.021*** 0.0050** 0.0046* 0.0044 0.0044* 0.0043*
(6.49) (2.08) (1.86) (1.37) (1.71) (1.68)
5<Outside equity<25
0.00100 0.00056 0.00054 0.00046 0.00046 0.00045
(1.19) (0.88) (0.63) (0.63) (0.65) (0.62)
Outside equity 25þ 1.25e-06 0.00029 0.00031 0.00027 0.00027 0.00027
(0.0027) (0.81) (0.67) (0.49) (0.58) (0.68)
No. exec directors 0.0028 0.0039 0.0039 0.0035 0.0036 0.0035
(0.76) (1.63) (1.48) (1.06) (1.10) (1.20) No. non-exec
directors
0.030*** 0.014*** 0.015*** 0.015*** 0.015*** 0.015***
(6.60) (3.43) (2.64) (2.64) (2.90) (2.76)
% insiders 0.16*** 0.030 0.031 0.041 0.042 0.041
(4.14) (0.89) (0.69) (1.11) (0.89) (1.04)
Industry adjusted TSR
0.011 0.012** 0.012* 0.012* 0.012* 0.012
(1.53) (2.22) (1.91) (1.94) (1.74) (1.59)
Industry adjusted ROA
0.00036 0.00080** 0.00084 0.00076** 0.00076 0.00076*
(0.76) (2.00) (1.43) (2.08) (1.31) (1.75)
(continued)
D
o
w
n
lo
a
d
e
d
fro
m
h
ttp
s:
//a
ca
d
e
mi
c.
o
u
p
.co
m/
o
e
p
/a
d
va
n
ce
-a
rt
icl
e
-a
b
st
ra
ct
/d
o
i/1
0
.1
0
9
3
/o
e
p
/g
p
y0
3
3
/5
0
6
2
6
9
0
b
y
U
n
ive
rsi
ty
o
f S
h
e
ffi
e
ld
u
se
r
o
n
2
7
S
e
p
te
mb
e
r
2
0
1
different job positions. The second column reports the first differenced specification (4), which allows us to focus on the impact of the tournament event and the immediate impact on remuneration of transitions between positions.12
The third column controls for the non-random nature of directors that leave a firm’s board (5). In columns four through six, we allow for a further element of selection, in that we differentiate between those individuals who leave the firm and gain employment in an-other FTSE350 firm and those who leave and do not reappear in the sample. Columns four through six therefore represent our preferred specifications.
Turning first to the position variable, this serves to illustrate the extent to which other members of the board earn less than the Chief Executive. Columns two through six indicate that CEOs have a salary 17–18% higher than executive directors and total remuneration that is 26–27% greater. The promotion to CEO therefore represents a considerable prize.
Directors of firms that are performing well compared to the industry average, whether measured by total shareholder return or return on assets, receive greater remuneration.13
Turning to the variables relating to the succession event, the winner variable indicates that they will initially be appointed at a point in the remuneration distribution below the mean for CEOs. However, as a result of their change in position, the winner of the tourna-ment will receive a large immediate uplift in their pay.Table 7, columns two through six, shows that newly appointed CEOs have a total remuneration which is 13% greater than other executive directors.
CEOs who step down from their position but remain with the firm will experience a fall in both salary and total remuneration if they move to become a ‘normal’ executive director. Movements from CEO are, however, typically, although not always, to Chair, in which case their salary appears to be cushioned.
[image:14.442.58.393.65.154.2]Turning to losing board members, we see that, as implied by tournament theory, these individuals receive an uplift in both their salary (3.9–4.4%) and total remu-neration (3.6–3.9%). Since we control for tenure and include year dummies, this uplift is
Table 6.Continued
(1) (2) (3) (4) (5) (6)
FE FD FD FD FD FD
Corr 1 Corr 2 Corr 2 Corr 2
Observations 19,570 14,531 14,531 14,531 14,531 14,531
R-squared 0.309 0.014 0.015 0.018 0.018 0.018
Year dummies Yes Yes Yes Yes Yes Yes
Attrition correction No No Yes Yes Yes Yes
Notes:t-statistics clustered at the level of the company in parentheses, bootstrapped in respect of columns
(3)–(6). ***p<0.01, **p<0.05, *p<0.1.
Source:Author’s calculations.
12 We would hence expect the first differenced estimates to be smaller, as observed.
13 The elasticity with respect to company size (as measured by sales) is lower in column (1) than
typically reported in the literature due to controls for individual fixed effects. It is not statistically significant in differenced formulations.
D
o
w
n
lo
a
d
e
d
fro
m
h
ttp
s:
//a
ca
d
e
mi
c.
o
u
p
.co
m/
o
e
p
/a
d
va
n
ce
-a
rt
icl
e
-a
b
st
ra
ct
/d
o
i/1
0
.1
0
9
3
/o
e
p
/g
p
y0
3
3
/5
0
6
2
6
9
0
b
y
U
n
ive
rsi
ty
o
f S
h
e
ffi
e
ld
u
se
r
o
n
2
7
S
e
p
te
mb
e
r
2
0
1
Table 7.The total remuneration of directors
(1) (2) (3) (4) (5) (6)
FE FD FD FD FD FD
Corr 1 Corr 2 Corr 2 Corr 2
Tournament outcome -Loser: Non-CEO
stayer
0.056*** 0.039*** 0.039*** 0.036**
(3.41) (2.86) (2.71) (2.15)
–Ext. sucessor 0.055**
(2.06)
–Int. sucessor 0.023
(0.96)
–1st Loss 0.044**
(2.04)
–2nd Loss 0.024
(0.60)
-Loser: CEO stayer 0.27*** 0.028 0.027 0.051 0.051 0.051
(3.39) (0.40) (0.33) (0.54) (0.48) (0.38)
-Winner 0.18*** 0.13*** 0.12*** 0.14*** 0.14*** 0.14***
(6.96) (4.59) (3.50) (3.69) (3.66) (3.68) Controls
Position (Relative to omitted base position of CEO):
-Chair 0.084 0.0092 0.0054 0.040 0.040 0.040
(0.91) (0.12) (0.041) (0.27) (0.39) (0.30) -Finance Director 0.61*** 0.24*** 0.24*** 0.26*** 0.26*** 0.25***
(13.0) (5.10) (3.69) (3.58) (3.98) (3.06) -Executive Director 0.56*** 0.26*** 0.26*** 0.27*** 0.27*** 0.27***
(16.1) (6.78) (4.81) (4.76) (4.80) (4.60)
ln(sales) 0.073*** 0.0039 0.0041 0.0012 0.0013 0.0011
(6.34) (0.48) (0.40) (0.17) (0.15) (0.10)
Tenure on board 0.036*** 0.0089*** 0.0091** 0.011*** 0.011** 0.011***
(9.17) (3.69) (2.27) (3.20) (2.50) (3.00)
Outside equity<5 0.029*** 0.0018 0.0016 0.0013 0.0014 0.0012
(4.62) (0.35) (0.34) (0.22) (0.20) (0.23)
5<Outside equity<25
0.00016 0.0016 0.0017 0.0015 0.0015 0.0015
(0.1–1) (1.11) (1.59) (1.08) (0.85) (1.10)
Outside equity 25þ 0.00100 0.00062 0.00066 0.00058 0.00058 0.00058
(1.36) (0.90) (1.33) (1.03) (1.01) (0.99)
No. exec directors 0.011 0.022*** 0.022*** 0.024*** 0.024*** 0.024***
(1.57) (3.64) (4.42) (4.82) (3.77) (4.29)
No. non-exec directors 0.044*** 0.0096 0.0098 0.011 0.011 0.011
(5.18) (1.25) (1.39) (1.33) (1.39) (1.36)
% insiders 0.22*** 0.069 0.067 0.094 0.094 0.093
(3.24) (1.14) (1.05) (1.42) (1.57) (1.40)
Industry adjusted TSR 0.059*** 0.029** 0.030** 0.029*** 0.029*** 0.030***
(4.13) (2.43) (2.37) (2.68) (2.62) (2.96)
Industry adjusted ROA 0.0018** 0.0020** 0.0021*** 0.0019** 0.0020** 0.0019**
(2.12) (2.37) (2.65) (2.06) (2.38) (2.17)
(continued)
D
o
w
n
lo
a
d
e
d
fro
m
h
ttp
s:
//a
ca
d
e
mi
c.
o
u
p
.co
m/
o
e
p
/a
d
va
n
ce
-a
rt
icl
e
-a
b
st
ra
ct
/d
o
i/1
0
.1
0
9
3
/o
e
p
/g
p
y0
3
3
/5
0
6
2
6
9
0
b
y
U
n
ive
rsi
ty
o
f S
h
e
ffi
e
ld
u
se
r
o
n
2
7
S
e
p
te
mb
e
r
2
0
1
above what would otherwise be expectedceteris paribus.In column five, we separate the uplift for the losers by whether the winner of the tournament was an internal or external hire. The uplift is marginally higher in the case of external winners, but the coefficients are not statistically different from each other.
Column 6 separates the impact of the first tournament loss from the second tournament loss. This is because once a director has been passed over for promotion, they may no lon-ger be an active participant in future tournaments, and if not, they will have received com-pensation for their expected loss. They will not then receive a pay boost after the second tournament ends. This assumption appears to hold, as it is only the first loss that gives rise to the uplift, with directors who have lost before seeing no change in either their salary or total remuneration (column six). This may help to distinguish the impact of tournament loss from other possible explanations for an uplift following the appointment of a new CEO such as a compensation for disruption, or payments to smooth transition (which would expect to be repeated).
It is important to emphasise that the uplift observed is not the result of non-random at-trition of executive directors since, as discussed above, in columns three through six we ex-plicitly correct for attrition. Although the measured size of the impact is slightly reduced as we move from column two to columns three and four, the effect retains a high level of stat-istical significance.14
6. Conclusions
[image:16.442.54.389.66.153.2]Tournament theory predicts that directors will be willing to accept a level of remuneration less than their marginal product if there is a prospect that they might become the CEO in the future, with the large increase in pay that this entails. An implication of this is that, should the directors lose a tournament, and hence experience a discrete fall in the likelihood of succeeding to the post of CEO, they will need to be compensated in terms of higher re-muneration or they will leave the firm. This paper presents evidence both on the likelihood of executive exit accompanying a change of the CEO, and also on the compensation of sur-viving directors.
Table 7.Continued
(1) (2) (3) (4) (5) (6)
FE FD FD FD FD FD
Corr 1 Corr 2 Corr 2 Corr 2
Observations 19,641 14,582 14,582 14,582 14,582 14,582
R-squared 0.310 0.019 0.020 0.026 0.027 0.027
Year dummies Yes Yes Yes Yes Yes Yes
Attrition correction No No Yes Yes Yes Yes
Notes:t-statistics clustered at the level of the company in parentheses, bootstrapped in respect of columns
(3)–(6). ***p<0.01, **p<0.05, *p<0.1.
Source:Author’s calculations.
14 The importance of correcting for attrition may be noted by the fact that the lambdas are jointly
statistically significant (total remuneration:v2(12)¼49.24,v2(24)¼113.72)).
D
o
w
n
lo
a
d
e
d
fro
m
h
ttp
s:
//a
ca
d
e
mi
c.
o
u
p
.co
m/
o
e
p
/a
d
va
n
ce
-a
rt
icl
e
-a
b
st
ra
ct
/d
o
i/1
0
.1
0
9
3
/o
e
p
/g
p
y0
3
3
/5
0
6
2
6
9
0
b
y
U
n
ive
rsi
ty
o
f S
h
e
ffi
e
ld
u
se
r
o
n
2
7
S
e
p
te
mb
e
r
2
0
1
The data suggest that the process by which directors leave the firm is non-random, and adjusting for this attrition is important when estimating the impact of tournament loss. We find that losing a tournament increases the probability of firm exit by 15–24%. We also find strong evidence that losing directors that stay with the firm are compensated by a higher remuneration package. This suggests that the opportunity for promotion is material-ly important to the director, as posited in the tournament model.
Recent reforms in the USA and Europe have sought to make the remuneration of all board members transparent and their actions accountable to shareholders. It is therefore important to fully understand the setting of board pay. An implication of our findings is that prior studies of executive remuneration, which have failed to model CEO succession, may be missing an important part of the story. Further, since they have ignored attrition and the impact of tournaments on executive exits, such studies will have obtained biased estimates of the determinants of executive pay.
Supplementary material
Supplementary material is available online at the OUP website. This comprises the replication files. The Manifest data is commercially available from Minerva Analytics.
Acknowledgments
The authors thank participants at the European Association for Research in Industrial Economics (2015), seminar participants from the University of Lancaster, and an anonymous referee for use-ful comments.
References
Bebchuk, L.A. and Fried, J.(2003) Executive compensation as an agency problem,Journal of
Economic Perspectives,17, 71–92.
Bebchuk, L.A. and Fried, J. (2004) Pay Without Performance: The Unfulfilled Promise of Executive Compensation, Harvard University Press, Cambridge, MA.
Bognanno, M.L.(2001) Corporate tournaments,Journal of Labor Economics,19, 290–315. Eriksson, T.(1999) Executive compensation and tournament theory: empirical tests on Danish
data,Journal of Labor Economics,17, 262–80.
Fitzgerald, J., Gottschalk, P., and Moffitt, R.(1998)An analysis of sample attrition in panel data: the Michigan Panel Study of Income Dynamics, Working Paper 220, National Bureau of Economic Research, Cambridge, MA.
Gabaix, X. and Landier, A.(2008) Why has CEO pay increased so much?Quarterly Journal of
Economics,123, 49–100.
Gibbons, R. and Waldman, M. (1999) Careers in organizations: theory and evidence, in O. Ashenfelter and D. Card (eds)Handbook of Labor Economics,vol. 3, Elsevier, Amsterdam, 2373–437.
Gibbs, M.(1995) Incentive compensation in a corporate hierarchy,Journal of Accounting and
Economics,19, 247–77.
Gregory-Smith, I.(2012) Chief executive pay and remuneration committee independence,Oxford Bulletin of Economics and Statistics,74, 510–32.
Kahn, C. and Huberman, G.(1988) Two-sided uncertainty and ‘up-or-out’ contracts,Journal of
Labor Economics,6, 423–44.
D
o
w
n
lo
a
d
e
d
fro
m
h
ttp
s:
//a
ca
d
e
mi
c.
o
u
p
.co
m/
o
e
p
/a
d
va
n
ce
-a
rt
icl
e
-a
b
st
ra
ct
/d
o
i/1
0
.1
0
9
3
/o
e
p
/g
p
y0
3
3
/5
0
6
2
6
9
0
b
y
U
n
ive
rsi
ty
o
f S
h
e
ffi
e
ld
u
se
r
o
n
2
7
S
e
p
te
mb
e
r
2
0
1
Kale, J.R., Reis, E., and Venkateswaran, A.(2009) Rank-order tournaments and incentive align-ment: the effect on firm performance,Journal of Finance,64, 1479–512.
Kale, J.R., Reis, E., and Venkateswaran, A.(2014) Pay inequalities and managerial turnover,
Journal of Empirical Finance,27, 21–39.
Kaplan, S.N. and Rauh, J.(2013) It’s the market: the broad-based rise in the return to top talent,
Journal of Economic Perspectives,27, 35–56.
Lazear, E.P. and Rosen, S.(1981) Rank-order tournaments as optimum labor contracts,Journal
of Political Economy,89, 841–64.
Main, B.G.M., Bruce, A., and Buck, T.(1996) Total board remuneration and company perform-ance,Economic Journal,106, 1627–44.
Main, B.G.M., O’Reilly, C.A., and Wade, J.(1993) Top executive pay: tournament or teamwork?
Journal of Labor Economics,11, 606–28.
Murphy, K.(1999) Executive compensation, in O. Ashenfelter and D. Card (eds)Handbook of
Labor Economics,vol. 3, Elsevier, Amsterdam, 1–89.
Piketty, T.(2014)Capital in the Twenty-First Century, Harvard University Press, Cambridge, MA.
Prendergast, C.(1999) The provision of incentives in firms,Journal of Economic Literature,37, 7–63.
Rosen, S.(1981) The economics of superstars,American Economic Review,71, 845–58. Rosen, S.(1986) Prizes and incentives in elimination tournaments,American Economic Review,
76, 701–15.
Sattinger, M.(1993) Assignment models of the distribution of earnings, Journal of Economic Literature,31, 831–80.
Wooldridge, J.M.(2002)Econometric Analysis of Cross Section and Panel Data, MIT Press, Cambridge, MA.
D
o
w
n
lo
a
d
e
d
fro
m
h
ttp
s:
//a
ca
d
e
mi
c.
o
u
p
.co
m/
o
e
p
/a
d
va
n
ce
-a
rt
icl
e
-a
b
st
ra
ct
/d
o
i/1
0
.1
0
9
3
/o
e
p
/g
p
y0
3
3
/5
0
6
2
6
9
0
b
y
U
n
ive
rsi
ty
o
f S
h
e
ffi
e
ld
u
se
r
o
n
2
7
S
e
p
te
mb
e
r
2
0
1
Appendix
Table A1.Variable descriptions
Variable Comment
Pay Variables All measures of remuneration are expressed in December 2008 prices, pro-rata if served a period other than 12 months, subject to serving at least 3 months of the financial year.
Total remuneration includes all forms of cash payment excepting pensions and including salary, bonuses, perquisites, and a grant date value of options and equity incentives (one-third of their face value).
Position Variables We separately identify four types of executive position in our sample: Chief Executive (including combined roles), an Executive Chair, a Finance Director, and other Executive Directors. In the UK, non-executive directors receive a nominal fee and so are excluded from the analysis.
Tournament Event Identifies the year in which the CEO was replaced. The succession is ‘internal’ if the new CEO was appointed from within the existing board, and ‘external’ otherwise.
Non-CEO leaver An Executive Director, Finance Director, or Chair is identified as a Non-CEO leaver if they leave the firm in the same financial year as the appointment of the new CEO, subject to having served on the board for at least 12 months.
Non-CEO stayer A director is identified as a Non-CEO stayer if they are still in the firm in the financial year following the appointment of the new CEO, subject to having served on the board for at least 12 months.
CEO stayer If the outgoing CEO takes up another position in the company within 12 months of their resignation as CEO. For example, if the CEO assumes the position of Chair.
Loser: non-CEO stayer A Non-CEO stayer, where the tournament event occurred in the prior period in the panel.
Loser: CEO stayer A CEO stayer, where the tournament event occurred in the prior period in the panel.
Pay fairness variables Relative remuneration: pay relative to median executive in firm. Internal inequality: logarithm of ratio CEO: executive pay gap. External inequality: CEO: executive pay gap in firm relative to
CEO: median executive pay gap in benchmark firm (in same size quartile defined by sales).
CEO Designate Individual named on board as successor to current CEO. Total Shareholder Return (TSR) The difference in the log of the return index from Thompson
Datastream. The return index captures both the movement in share price and income from dividends.
ln(Sales) The log of Sales measured in £000s, annualized and in December 2008 prices.
% Insiders The number of executive directors and non-independent non-executive directors as a percentage of the total number of directors on the board.
Industry Adjusted TSR TSR minus the TSR of the median firm by Thompson Datastream’s industry classifications.
(continued)
D
o
w
n
lo
a
d
e
d
fro
m
h
ttp
s:
//a
ca
d
e
mi
c.
o
u
p
.co
m/
o
e
p
/a
d
va
n
ce
-a
rt
icl
e
-a
b
st
ra
ct
/d
o
i/1
0
.1
0
9
3
/o
e
p
/g
p
y0
3
3
/5
0
6
2
6
9
0
b
y
U
n
ive
rsi
ty
o
f S
h
e
ffi
e
ld
u
se
r
o
n
2
7
S
e
p
te
mb
e
r
2
0
1
Table A1.Continued
Variable Comment
Industry Adjusted ROA Return on Assets minus the Return on Assets of the median firm by Thompson Datastream’s industry classifications.
Age The age of the CEO at the financial year-end.
Number of executive directors The number of executive directors at the financial year-end including the CEO.
Number of non-executive directors
The number of non-executive directors at the financial year-end excluding the Chair.
Outside equity The aggregate number of shares held by outside major shareholders at the year-end as a percentage of the issued share capital. Outside major shareholders are those holding in excess of 3% of the voting stock as disclosed in the annual report and accounts and who do not serve as directors of the company.
Tenure The number of years of service on the board.
Source: Author’s definitions
D
o
w
n
lo
a
d
e
d
fro
m
h
ttp
s:
//a
ca
d
e
mi
c.
o
u
p
.co
m/
o
e
p
/a
d
va
n
ce
-a
rt
icl
e
-a
b
st
ra
ct
/d
o
i/1
0
.1
0
9
3
/o
e
p
/g
p
y0
3
3
/5
0
6
2
6
9
0
b
y
U
n
ive
rsi
ty
o
f S
h
e
ffi
e
ld
u
se
r
o
n
2
7
S
e
p
te
mb
e
r
2
0
1