White Rose Research Online URL for this paper: http://eprints.whiterose.ac.uk/116291/
Version: Accepted Version
Article:
Cohen, Dale and Quinlan, Philip Thomas orcid.org/0000-0002-8847-6390 (2017) The log-linear response function of the bounded number-line task is unrelated to the psychological representation of quantity. Psychonomic Bulletin and Review. ISSN 1069-9384
https://doi.org/10.3758/s13423-017-1290-z
[email protected] https://eprints.whiterose.ac.uk/ Reuse
Items deposited in White Rose Research Online are protected by copyright, with all rights reserved unless indicated otherwise. They may be downloaded and/or printed for private study, or other acts as permitted by national copyright laws. The publisher or other rights holders may allow further reproduction and re-use of the full text version. This is indicated by the licence information on the White Rose Research Online record for the item.
Takedown
If you consider content in White Rose Research Online to be in breach of UK law, please notify us by
The log-linear response function of the bounded number-line task is unrelated to the
psychological representation of quantity
Dale J. Cohen
The University of North Carolina at Wilmington
Philip T. Quinlan
The University of York
Keywords: Numerical Cognition; Number line; logarithmic function; log-linear shift;
computational modeling
Authors Note
Correspondence concerning this article should be sent to Dale J. Cohen, PhD.,
Department of Psychology, University of North Carolina Wilmington, 601 South
College Road, Wilmington, NC 28403-5612. Email:[email protected]. Phone:
910.962.3917. Fax: 910.962.7010. Both authors contributed equally to this
Abstract
The bounded number-line task has been used extensively to assess the numerical
competence of both children and adults. One consistent finding is that young
children display a logarithmic response function, whereas older children and adults
display a more linear response function. Traditionally, these log-linear functions
have been interpreted as providing a transparent window onto the nature of the
participantsÕ psychological representation of quantity (termed here a direct response
strategy). Here we show that the direct response strategy produces the log-linear
response function regardless of whether the psychological representation of quantity
is compressive or expansive. Simply put, the log-linear response function results
from task constraints rather than the psychological representation of quantities. We
also demonstrate that a proportion/subtraction response strategy produces response
patterns that almost perfectly correlate with the psychological representation of
quantity. We therefore urge researchers not to interpret the log-linear response
The log-linear response function of the bounded number-line task is unrelated to the
psychological representation of quantity
According to the National Council of Teachers of Mathematics (NCTM)
Principles and Standards document (ÒCommon Core StandardsÓ, 2010), the link
between numerical symbols and oneÕs psychological representation of quantity
(termed number sense) is a crucial component in K-12 studentsÕ ability to understand
symbolic numbers, learn new systems of number representations, understand
relationships among numbers and number systems, and make reasonable
estimates. The bounded number-line task is one of the principal tools for teaching
and measuring number sense in children (see e.g., ÒCommon Core StandardsÓ,
2010; Berteletti, Lucangeli, Piazza, Dehaene, & Zorzi, 2010; Dehaene, Izard, Spelke,
& Pica, 2008; Laski & Siegler, 2007; Thompson & Opfer, 2008). Much of the
evidence supporting the use of the bounded number-line task to measure number
sense comes from papers making conclusions about the underlying psychological
quantity representations from the logarithmic and linear response patterns of children
and adults (e.g., Geary, Hoard, Nugent, & Byrd-Craven, 2008; Laski & Siegler, 2007;
Opfer & Siegler, 2007; Siegler & Booth, 2004; Siegler & Opfer, 2003). In contrast to
this well-established view, here we demonstrate that the logarithmic and linear
response patterns in the bounded number-line task provide no information about the
form of the underlying psychological representation of quantity.
The bounded number line task is very simple. A participant is presented with a
number together with a horizontal line. The line designates a range of values, with
the minimum value situated at the left-most edge of the line and the maximum value
situated at the right-most edge. The participant is asked to indicate where on the line
the corresponding quantity, conveyed by the number, would be located given the
bounded range of values. Of central importance is the shape of the function
target values. Various cognitive strategies have been put forward to explain
performance. Traditionally, researchers have assumed that a participantÕs response
function to the bounded number-line task provides a direct window on their
psychological understanding of quantities (Booth & Siegler, 2006; Opfer & Siegler,
2012; Opfer, Thompson, & Kim, 2016; Siegler & Booth, 2004; we term this a direct
response strategy). Researchers who accept the direct response strategy have
interpreted the bounded number-line data as indicating that childrenÕs psychological
understanding of quantities is logarithmic, whereas older children and adults
psychological understanding of quantities is linear (Booth & Siegler, 2006; Laski &
Siegler, 2007; Opfer & Siegler, 2005, 2012; Siegler & Opfer, 2003, Siegler & Booth,
2004; Siegler & Ramani, 2006; Siegler, Thompson & Opfer, 2009).
More recently, researchers have extended these ideas by fitting a log-linear
function to the data. By introducing systematic changes to the parameters of this
function, it can mimic a log function, a linear function, and a mixture of the two
(Anobile, Cicchini, & Burr, 2012; Opfer, Thompson, & Kim, 2016). Despite this
apparently promising approach, here we show that constraints of the bounded
number-line task force a log-linear response pattern when the participant uses a
direct response strategy regardless of the underlying numerical representation of
quantity. We conclude, therefore, that researchers cannot draw any conclusions
about participantsÕ representation of quantity based on a log-linear (and thus a
logarithmic) response pattern.
There is general agreement in the literature that the psychological
understanding of a quantity, say a Ò5Ó, depends on a representation captured by a
distribution on a continuum of quantities (often described as a Òmental number-lineÓ).
Different assumptions that have been made about the nature of these quantity
distributions and their spacing on the line. Two important theoretical alternatives are
(i) the linear model with scalar variability, and, (ii) the logarithmic model with fixed
variability. The linear model with scalar variability assumes that the means of the
(e.g., 1, 2, 3, etc.) are equidistant from one another, but the standard deviations
(SDs) of those distributions increases proportionally with the quantity they represent.
The logarithmic model with fixed variability assumes that the means of the
distributions that represent the psychological understanding of successive integers
are logarithmically spaced, but the SDs of those distributions remain constant.
The fact that young children produce a logarithmic response pattern in the
bounded number-line task sits comfortably with the logarithmic model (Opfer &
Siegler, 2005, 2012; Thompson & Opfer, 2008). In addition, the fact that older
children and adults produce a near linear response pattern on the bounded
number-line task sits comfortably with the number-linear model (Booth & Siegler, 2006; Siegler &
Booth, 2004). This age-related pattern has led to the hypothesis that there is a
development change such that an initial logarithmic representational system is
replaced by a linear representational system as a person ages. Such a view is
captured by the log-linear shift hypothesis (Siegler & Ramani, 2006; Siegler, et al.,
2009).
The log-linear shift hypothesis is based on the assumption that the bounded
number-line task provides a transparent window on the nature of the mental
representation of quantities. It is assumed that a participantÕs response function will
mirror his or her underlying representation of quantity. According to Siegler and
Booth (2004), ÒSeveral groups of investigators have hypothesized that childrenÕs
estimation reflects their internal representation of numbersÓ (p. 429). Furthermore,
Opfer et. al (2016) made the argument that the bounded number-line provides an
ideal template for directly measuring the underlying quantity representations, in the
following way, ÒBecause line length itself is not psychophysically compressive or
expansive (Lu & Dosher, 2013), the task provides a relatively straightforward method
for assessing compression in numerical magnitude representations.Ó (p. 12).
Recently, an alternate view has emerged that focuses on the role that
strategies play in the bounded number-line task (see e.g., Barth & Paladino, 2011;
Blanc-Goldhammer, 2011; Cohen & Sarnecka, 2014; Friso-van den Bos,
Kroesbergen, Van Luit, Xenidou-Dervou, Jonkman, Van der Schoot, et al., 2015;
Hurst & Cordes, 2015; Hurst, Relander, & Cordes, 2016; Slusser, Santiago, & Barth,
2013). The counter argument is that (i) that successful completion of the bounded
number-line task depends on the deployment of an appropriate cognitive strategy,
and, (ii) only when these strategies are modelled, can a meaningful estimate of the
participantÕs underlying quantity representation be obtained. For example, Cohen
and Blanc-Goldhammer (2011) presented evidence that adults used a
proportion/subtraction strategy to estimate the position of the target value on the
bounded number-line. The strategy was put forward by Hollands and Dyre (2000) in
their work on how observers make proportion estimates. According to Hollands and
Dyre (2000), observers estimate the position of the target value from the left-hand
boundary as well as from the right-hand boundary (e.g., upper bound Ð target value).
This provides a means by which the observer scales the line to the quantities. This
strategy is modelled by the Cyclic Power Model (CPM, see Hollands & Dyre, 2000).
Cohen and Blanc-Goldhammer (2011) found that the CPM provided a superior fit to
adultÕs bounded number-line data than either the linear or logarithmic functions.
These results were replicated in older children (Barth & Paladino, 2011; Cohen &
Sarnecka, 2014; Slusser et al., 2013).
To date, researchers have assumed that the direct response strategy and the
proportion/subtraction strategy give rise to response functions that correlate with the
underlying quantity representations. Perhaps surprisingly, this assumption has
never been tested. As a consequence, we report on a number of computer
simulations that test this critical assumption. The key issue is whether reasonably
accurate estimates of underlying quantity representations can be made from the data
produced from the direct response hypothesis and, separately, the
Methods
We ran computer simulations of the direct response hypothesis and the
proportion/subtraction hypothesis.
Quantity representation
For all simulations, we first simulated an underlying quantity representation for
the integers contained within the upper and lower boundaries of the number-line.
Here, we only consider a number-line ranging from 0-50, but the results generalize to
any range. For each integer, Θi we generated a quantity distribution such that the
psychological representation of that integer was set to ψi = Θβ
i + ei, where β denotes
the numerical bias and e denotes the error around the mean. For the simulation, we
varied β from 0.6 (negatively accelerating, similar to the log) to 1.4 (positively
accelerating, similar to exponential), in 0.2 intervals. When β =1, there is no bias.
We simulated a variety of error distributions: that is, normal distributions with fixed
and scalar variance, and the gamma distribution. We focus on the simulations with a
gamma distribution (shape parameter = log(target)+1). The gamma distribution
produces similar data to the normal distribution with scalar variance, but has the
advantage of never producing a value below zero. Any variation in the outcomes was
mostly attributable to the chosen standard deviation.
Task completion
Direct response strategy
For each target value, we sampled an estimate from the corresponding
quantity distribution. Because the direct response strategy does not specify a means
by which an observer maps the length of the line to quantity, the response estimate
equaled the sampled estimate multiplied by a unit length. We varied unit lengths
from 0.5-3.0 in 0.5 intervals. A unit length of 1.0 indicates an accurate mapping of
line length to quantity. The response estimate was valid if fell between the lower and
repeated the sampling and calculation process until we obtained a valid estimate. If
we failed to calculate a valid response estimate in 1000 attempts, we assigned the
response estimate the value of the boundary it was closest to. We repeated this
process 20 times for each target value.
Proportion/subtraction strategy
For each target value, we sampled an estimate from its corresponding
quantity distribution and one from the quantity distribution corresponding to the
distance from the right boundary (upper boundary Ð target). We then calculated a
response estimate from either the one-cycle or two-cycle CPM from those values.
We repeated the sampling and calculation process until we obtained a valid
estimate. If we failed to obtain a valid estimate in 1000 attempts, we assigned the
response estimate the value of the boundary it was closest to. We repeated this
process 20 times for each target value.
Results
For each strategy (direct response, one-cycle proportion/subtraction, and two-cycle
proportion/subtraction) we fit the log-linear function developed by Anobile et. al,
(2012; see also Cicchini, Anobile, & Burr, 2014). The log-linear function has two free
parameters: (i) p(log) which identifies the proportion of log fit (vs. linear fit) and, (ii) a
a scaling parameter. For the one-cycle proportion/subtraction, and two-cycle
proportion/subtraction, we also fit the one- and two-cycle CPM. The CPM functions
have one free parameter: β which is the estimate of numerical bias. We present the
fit statistics in Tables 1 and 2. We present figures of the fits for a subset of the
simulations assuming gamma distributions in Figures 1 and 2.
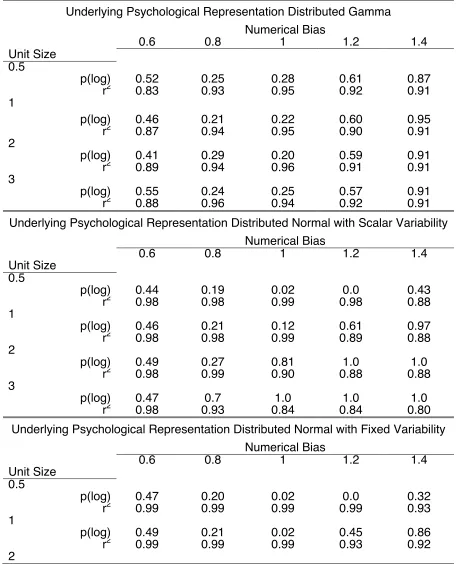
As seen in Table 1 and Figure 1, the log-linear function fit all direct response
simulations well, regardless of the bias of the underlying quantity representation. In
fact, when the bias of the underlying quantity representation is negatively
accelerating (similar to a log function) the log-linear function fit least well (β = 0.6
condition). More concerning is the fact that the log-linear function fit extremely well
positively accelerating (expansive, rather than compressive). In addition, p(log)
increases with the positively accelerating biases. These findings result from the fact
that observers cannot respond outside the bounds of the bounded number line. As
such, the bounds of the number-line truncate the distributions of the larger numbers,
thus forcing a negatively accelerating response function. We therefore conclude that
the direct response strategy in the bounded number-line task manifests as a
log-linear response pattern regardless of the underlying psychological representation of
quantity. The clear implication is that the log-linear pattern observed in behavioural
data arise because of the constraints of the bounded number-line task, rather than
the participantÕs psychological understanding of numbers.
As seen in Table 2 and Figure 2, the one and two-cycle functions fit all
proportion/subtraction response simulations well (mean r2 = 0.986), regardless of the
bias of the underlying quantity representation. Importantly, the estimated β from
both the one and two-cycle CPM functions are almost perfectly correlated with the
simulated β of the quantity representations (r > 0.99), though with a small, but
consistent, underestimation. Finally, Figure 2 shows the typical ÒMÓ shaped error
pattern that results in the bounded number task emerges when participants use the
half way mark as a reference point. One can conclude from these data that the
proportion/subtraction response strategy in the bounded number-line task manifests
as a CPM response pattern that reflects the response bias regardless of the
underlying psychological representation of quantity.
Finally, we also note that the log-linear function fit all proportion/subtraction
response simulations well (mean r2 > 0.98), despite the fact that they were generated
using the proportion/subtraction response strategy. This is because the
proportion/subtraction response strategy produces relatively linear response patterns
with slight curves that the log-linear function can mimic. This simulation underscores
Hollands and Dyre (2000) caution that one must take extreme care not to confuse
Discussion
The results of the simulations are very clear: log-linear (and thus logarithmic)
response patterns in the bounded number-line task provide no information about the
underlying quantity representation of the observer. Log-linear (and thus logarithmic)
response functions result from the constraints of the task itself: the bounds of the
number-line truncate the distributions of the larger numbers. In contrast, if
participants are able to carry-out the proportion/subtraction strategy, the resulting
response functions, when modelled correctly, are near perfectly correlated with the
numerical bias of the underlying quantity representation.
These findings raise the possibility that the log-linear pattern displayed by
young children is the result of a na•ve direct response strategy. That is, very young
children may not have the mensuration skills to equate a line length with quantity in
the bounded number-line task (see Cohen & Sarnecka, 2014). Nevertheless, these
young children may still understand the ordinal and interval properties of numbers.
In this instance, the children may arbitrarily choose a certain length to correspond to
a single unit. The young child may then use this line length to complete the task as
we describe in the direct response strategy. In this scenario, the childrenÕs
responses would necessarily result in a log-linear response function regardless of
the childrenÕs underlying psychological representation of quantity.
It is, of course, possible to generate a specific quantity representation or
participant strategy in which our conclusions do not hold1. For example, a quantity
representation that is both noise free and somehow scaled to the dimensions of the
number-line will be mirrored in a participantÕs responses with a version of the direct
response strategy. The ability to generate such an example, however, does not
weaken our conclusions as they currently stand. The strength of a scientific model is
typically gauged relative to the number of alternative hypotheses that can also
explain the data. Here, we demonstrate that when the log-linear function fits well
with the number-line data, this result alone is consistent with innumerable alternative
strategies). As a result, the log-linear fit provides no substantive evidence about the
underlying psychological representation of quantities. This result reflects a fatal flaw
in the many previous studies that have used such fits to support particular theoretical
accounts of numerical competency. In contrast, when the CPM function fits the
number-line data, currently the only model that explains this fit is the
proportion/subtraction strategy applied on a specific underlying quantity
representation. Until researchers propose viable alternative models that predict the
CPM fits as well as the proportion/subtraction strategy model, the most plausible
conclusion is that the CPM provides important information about the underlying
psychological representation of the quantity.
In sum, we assert, on the basis of our computer simulations, that the bounded
number-line task does not provide a transparent window on the mental
representation of quantities. The constraints of the task will produce a log-linear
response function when the direct response strategy is applied regardless of the
underlying psychological representation of quantity. We therefore urge that
researchers stop offering psychological accounts of the log-linear response functions
(and hence the logarithmic, linear, or mixture of the two response functions) in the
bounded number-line task that are based on particular assumptions about mental
representations of quantities. We temper this negative conclusion with a more
positive encouragement: if the proportion/subtraction strategy is deployed by the
participant and modelled by the researcher, then one can recover useful information
about the participantÕs quantity representation. Furthermore, researchers may also
consider using the unbounded number line task (see Cohen & Blanc-Goldhammer,
2011). This avoids the problems we have described and, critically, the associated
data are uncontaminated by the effects of truncation that are evident in those from
References
Anobile, G., Cicchini, G. M., & Burr, D. C. (2012). Linear mapping of numbers onto
space requires attention. Cognition, 122, 454-459. doi:
http://dx.doi.org/10.1016/j.cognition.2011.11.006
Barth, H. C., & Paladino, A. M. (2011). The development of numerical estimation:
Evidence against a representational shift. Developmental Science, 14,
545-551. doi: http://dx.doi.org/10.1111/j.1467-7687.2010.00962.x
Barth, H. C., Slusser, E. B., Cohen, D., & Paladino, A. M. (2011). A sense of
proportion: commentary on Opfer, Siegler and Young. Developmental
Science, 14, 1205-1206. doi:
http://dx.doi.org/10.1111/j.1467-7687.2011.01081.x
Berteletti, I., Lucangeli, D., Piazza, M., Dehaene, S., & Zorzi, M. (2010). Numerical
estimation in preschoolers. Developmental Psychology, 46, 545-551. doi:
http://dx.doi.org/10.1037/a0017887
Booth, J. L., & Siegler, R. S. (2006). Developmental and individual differences in
pure number estimation. Developmental Psychology, 41, 189-201. doi:
http://dx.doi.org/10.1037/0012-1649.41.6.189
Chesney, D. L., & Matthews, P. G. (2013). Knowledge on the line: Manipulating
beliefs about the magnitudes of symbolic affects the linearity of line estimation
tasks. Psychonomic Bulletin & Review, 20, 1146-1153. doi:
http://dx.doi.org/10.3758/s13423-013-0446-8
Cicchini, G. M., Anobile, G., & Burr, D. C. (2014). Compressive mapping of number
to space reflects dynamic encoding mechanisms, not static logarithmic
transform. Proceedings of the National Academy of Science of the USA, 111,
7867Ð7872. doi: http://dx.doi.org/10.1073/pnas.1402785111
Cohen, D. J., & Blanc-Goldhammer, D. (2011). Numerical bias in bounded and
unbounded number line tasks. Psychonomic Bulletin and Review, 18,
Cohen, D. J., & Sarnecka, B. (2014). Children's number-line estimation shows
development of measurement skills (not number representations).
Developmental Psychology, 50, 1640-1652. doi:
http://dx.doi.org/10.1037/a0035901
Common Core State Standards Initiative. (2010). Retrieved from
http://www.corestandards.org/Math/ website:
Dehaene, S., Izard, V., Spelke, E., & Pica, P. (2008). Log or linear? Distinct intuitions
of the number scale in Western and Amazonian indigene cultures. Science,
320, 1217-1220. doi: http://dx.doi.org/10.1126/science.1156540
Friso-van den Bos, I., Kroesbergen, E. H., Van Luit, J. E. H., Xenidou-Dervou, I.,
Jonkman, L. M., Van der Schoot, M., & Van Lieshout, E. C. D. M. (2015).
Longitudinal development of number line estimation and mathematics
performance in primary school children. Journal of Experimental Child
Psychology, 134, 12-29. doi: http://dx.doi.org/10.1016/j.jecp.2015.02.002
Geary, D., Hoard, M. K., Nugent, L., & Byrd-Craven, J. (2008). Development of
number line representations in children with mathematical learning disability.
Developmental Neurobiology, 33, 277-299. doi:
http://dx.doi.org/10.1080/87565640801982361
Hollands, J. G., & Dyre, B. P. (2000). Bias in proportion judgments: The cyclical
power model. Psychological Review, 107, 500-524.
Hurst, M., & Cordes, S. (2015). Rational Number Comparisons Across Notation:
Fractions, Decimals, and Whole Numbers. Journal of Experimental
Psychology: Human Perception and Performance, 42, 281-293. doi:
http://dx.doi.org/10.1037/xhp0000140
Hurst, M., Relander, C., & Cordes, S. (2016). Biases and Benefits of Number Lines
and Pie Charts in Proportion Representation. In A. Papafragou, D. Grodner,
D. Mirman & J. C. Trueswell (Eds.), Proceedings of the 38th Annual
Conference of the Cognitive Science Society. Philadelphia, PA: Cognitive
Laski, E. V., & Siegler, R. S. (2007). Is 27 a Big Number? Correlational and Causal
Connections Among Numerical Categorization, Number Line Estimation, and
Numerical Magnitude Comparison. Child Development, 78, 1723-1743. doi:
http://www.jstor.org/stable/4620734
Lu, Z., & Dosher, B. A. (2013). Visual psychophysics: From laboratory to theory.
Cambridge, MA: MIT Press.
Opfer, J. E., & Siegler, R. S. (2005). Microgenetic changes in representations of
numerical magnitude. Paper presented at the Proceedings of the XXVII
Annual Conference of the Cognitive Science Society, Stresa, Italy.
Opfer, J. E., & Siegler, R. S. (2007). Representational change and children's
numerical estimation. Cognitive Psychology, 55, 169-195. doi:
http://dx.doi.org/10.1016/j.cogpsych.2006.09.002
Opfer, J. E., & Siegler, R. S. (2012). Development of quantitative thinking. In K. J.
Holyoak & R. G. Morrison (Eds.), Oxford handbook of thinking and reasoning.
Oxford: UK: OUP.
Opfer, J. E., Thompson, C. A., & Kim, D. (2016). Free versus anchored numerical
estimation: A unified approach. Cognition, 149, 11-17. doi:
http://dx.doi.org/10.1016/j.cognition.2015.11.015
Siegler, R. S., & Booth, J. L. (2004). Development of numerical estimation in young
children. Child Development, 75, 428-444. doi:
http://dx.doi.org/10.1111/j.1467-8624.2004.00684.x
Siegler, R. S., & Opfer, J. E. (2003). The development of numerical estimation:
Evidence for multiple representations of numerical quantity. Psychological
Science, 14, 237-243. doi: http://dx.doi.org/10.1111/1467-9280.02438
Siegler, R. S., & Ramani, G. B. (2006). Early development of estimation skills. APS
Observer, 19, 34-44.
Siegler, R. S., Thompson, C. A., & Opfer, J. E. (2009). The Logarithmic-To-Linear
and Education, 3, 143-150. doi:
http://dx.doi.org/10.1111/j.1751-228X.2009.01064.x
Slusser, E. B., Santiago, R. T., & Barth, H. C. (2013). Developmental change in
numerical estimation. Journal of Experimental Psychology: General, 142,
193-208. doi: http://dx.doi.org/10.1037/a0028560
Thompson, C. A., & Opfer, J. E. (2008). Costs and benefits of representational
change: Effects if context on age and sex differences in symbolic magnitude
estimation. Journal of Experimental Child Psychology, 101, 20-51. doi:
Table 1.
Fit statistics for the log-linear model to data simulated using the direct estimate
strategy with underlying quantity representations having numerical biases ranging
from 0.6 (negatively accelerating) to 1.4 (positively accelerating) and varying
estimated unit sizes
Underlying Psychological Representation Distributed Gamma Numerical Bias
0.6 0.8 1 1.2 1.4
Unit Size 0.5
p(log) 0.52 0.25 0.28 0.61 0.87
r2 0.83 0.93 0.95 0.92 0.91
1
p(log) 0.46 0.21 0.22 0.60 0.95
r2 0.87 0.94 0.95 0.90 0.91
2
p(log) 0.41 0.29 0.20 0.59 0.91
r2 0.89 0.94 0.96 0.91 0.91
3
p(log) 0.55 0.24 0.25 0.57 0.91
r2 0.88 0.96 0.94 0.92 0.91
Underlying Psychological Representation Distributed Normal with Scalar Variability Numerical Bias
0.6 0.8 1 1.2 1.4
Unit Size 0.5
p(log) 0.44 0.19 0.02 0.0 0.43
r2 0.98 0.98 0.99 0.98 0.88
1
p(log) 0.46 0.21 0.12 0.61 0.97
r2 0.98 0.98 0.99 0.89 0.88
2
p(log) 0.49 0.27 0.81 1.0 1.0
r2 0.98 0.99 0.90 0.88 0.88
3
p(log) 0.47 0.7 1.0 1.0 1.0
r2 0.98 0.93 0.84 0.84 0.80
Underlying Psychological Representation Distributed Normal with Fixed Variability Numerical Bias
0.6 0.8 1 1.2 1.4
Unit Size 0.5
p(log) 0.47 0.20 0.02 0.0 0.32
r2 0.99 0.99 0.99 0.99 0.93
1
p(log) 0.49 0.21 0.02 0.45 0.86
r2 0.99 0.99 0.99 0.93 0.92
p(log) 0.48 0.19 0.60 1.0 1.0
r2 0.99 0.99 0.93 0.92 0.75
3
p(log) 0.47 0.51 1.0 1.0 1.0
r2 0.99 0.96 0.92 0.88 0.76
Table 2
Fit statistics for the log-linear model, one-cycle, and two-cycle CPM model to data
simulated using the proportion/subtraction strategy with underlying quantity
representations having numerical biases ranging from 0.6 (negatively accelerating)
to 1.4 (positively accelerating)
Underlying Psychological Representation Distributed Gamma Numerical Bias
0.6 0.8 1 1.2 1.4
Model Log-Linear
p(log) 0.41 0.21 0.02 0.0 0.0
r2 0.95 0.98 0.99 .99 0.98
1-Cycle CPM
Estimated Bias 0.57 0.73 0.96 1.11 1.32
r2 0.96 0.98 0.99 0.99 0.99
2-Cycle CPM
Estimated Bias 0.54 0.73 0.87 1.10 1.32
r2 .99 .99 .99 .99 .99
Underlying Psychological Representation Distributed Normal with Scalar Variability Numerical Bias
0.6 0.8 1 1.2 1.4
Model Log-Linear
p(log) 0.36 0.14 0.02 0.0 0.0
r2 0.98 0.99 0.99 0.99 0.98
1-Cycle CPM
Estimated Bias 0.60 0.80 0.98 1.18 1.35
r2 0.99 0.99 0.99 0.99 0.99
2-Cycle CPM
Estimated Bias 0.57 0.77 0.98 0.16 1.37
r2 0.99 0.99 0.99 0.99 0.99
Underlying Psychological Representation Distributed Normal with Fixed Variability Numerical Bias
0.6 0.8 1 1.2 1.4
Model Log-Linear
p(log) 0.35 0.15 0.01 0.0 0.0
r2 0.98 0.99 0.99 0.99 0.98
1-Cycle CPM
Estimated Bias 0.61 0.80 1.00 1.19 1.37
r2 0.99 0.99 0.99 0.99 0.99
2-Cycle CPM
Estimated Bias 0.61 0.81 1.00 1.20 1.31
Numerical Bias
0.8 1 1.2 1.4
Quantity Represen-tation
Unit Size
3.0
2.5
2.0
1.0
[image:21.595.52.550.67.294.2]0.5
Figure 1. The simulated underlying gamma quantity representations, their resulting
response estimates, and the log-linear fit to the simulated data for the direct
response strategy in the bounded number-line task. Columns represent changes in
numerical bias (ranging from 0.8-1.4 in 0.2 intervals) and the rows represent
changes in the estimated length line corresponding to a single unit: Unit size = 1 is
an accurate estimate, Unit size < 1 is an underestimate, Unit size > 1 is an
Numerical Bias
0.8 1 1.2 1.4
Quantity Represen-tation
Means
1-Cycle
2-Cycle
SDs
1-Cycle SDs
Figure 2. The simulated underlying gamma quantity representations, their resulting
response estimates and SDs, and the one and two-cycle fit to the simulated data for
the proportion/subtraction strategy in the bounded number-line task. Columns
Footnotes
1 One may question our simulation of negatively accelerating quantity
representations using power functions, rather than a log function. Here, we
demonstrate that the log-linear function fits the responses derived from all quantity
representations, regardless of their form (positively and negatively accelerating).
Demonstrating that the log-linear function also fits the responses manifesting from a
true logarithmic quantity representation is unnecessary.