eurostat
eurostat
STATISTISCHES AMT DER EUROPÄISCHEN GEMEINSCHAFTEN
STATISTICAL OFFICE OF THE EUROPEAN COMMUNITIES
OFFICE STATISTIQUE DES COMMUNAUTÉS EUROPÉENNES
L-2920 Luxembourg — Tél. (352) 43 01-1 — Télex COMEUR LU 3423
B-1049 Bruxelles, rue de la Loi 200 — Tél. (32-2) 299 11 11
Eurostat hat die Aufgabe, den
Informa-tionsbedarf der Kommission und aller am
Aufbau des Binnenmarktes Beteiligten
mit Hilfe des europäischen statistischen
Systems zu decken.
Um der Öffentlichkeit die große Menge an
verfügbaren Daten zugänglich zu machen
und Benutzem die Orientierung zu
erleichtern, werden zwei Arten von
Publi-kationen angeboten: Statistische
Doku-mente und Veröffentlichungen.
Statistische Dokumente sind für den
Fachmann konzipiert und enthalten das
ausführliche Datenmaterial:
Bezugs-daten, bei denen die Konzepte allgemein
bekannt, standardisiert und
wissenschaft-lich fundiert sind. Diese Daten werden in
einer sehr tiefen Gliederung dargeboten.
Die Statistischen Dokumente wenden
sich an Fachleute, die in der Lage sind,
selbständig die benötigten Daten aus der
Fülle des dargebotenen Materials
auszu-wählen. Diese Daten sind in gedruckter
Form und/oder auf Diskette,
Magnet-band, CD-ROM verfügbar. Statistische
Dokumente unterscheiden sich auch
optisch von anderen Veröffentlichungen
durch den mit einer stilisierten Graphik
versehenen weißen Einband.
Veröffentlichungen wenden sich an eine
ganz bestimmte Zielgruppe, wie zum
Beispiel an den Bildungsbereich oder an
Entscheidungsträger in Politik und
Ver-waltung. Sie enthalten ausgewählte und
auf die Bedürfnisse einer Zielgruppe
abgestellte und kommentierte
Informa-tionen. Eurostat übernimmt hier also eine
Art Beraterrolle.
Für einen breiteren Benutzerkreis gibt
Eurostat Jahrbücher und periodische
Veröffentlichungen heraus. Diese
enthal-ten statistische Ergebnisse für eine erste
Analyse sowie Hinweise auf weiteres
Datenmaterial für vertiefende
Unter-suchungen. Diese Veröffentlichungen
werden in gedruckter Form und in
Daten-banken angeboten, die in Menütechnik
zugänglich sind.
Um Benutzem die Datensuche zu
erleich-tern, hat Eurostat Themenkreise, d. h.
eine Untergliederung nach Sachgebieten,
eingeführt. Daneben sind sowohl die
Statistischen Dokumente als auch die
Veröffentlichungen in bestimmte Reihen,
wie zum Beispiel „Jahrbücher",
„Kon-It is Eurostat's responsibility to use the
European statistical system to meet the
requirements of the Commission and all
parties involved in the development of the
single market.
To ensure that the vast quantity of
ac-cessible data is made widely available,
and to help each user make proper use of
this information, Eurostat has set up two
main categories of document: statistical
documents and publications.
The statistical document is aimed at
spe-cialists and provides the most complete
sets of data: reference data where the
methodology is well-established,
stand-ardized, uniform and scientific. These
data are presented in great detail. The
statistical document is intended for
ex-perts who are capable of using their own
means to seek out what they require. The
information is provided on paper and/or
on diskette, magnetic tape, CD-ROM. The
white cover sheet bears a stylized motif
which distinguishes the statistical
docu-ment from other publications.
The publications proper tend to be
com-piled for a well-defined and targeted
public, such as educational circles or
political and administrative
decision-makers. The information in these
docu-ments is selected, sorted and annotated
to suit the target public. In this instance,
therefore, Eurostat works in an advisory
capacity.
Where the readership is wider and less
well-defined, Eurostat provides the
infor-mation required for an initial analysis,
such as yearbooks and periodicals which
contain data permitting more in-depth
studies. These publications are available
on paper or in videotext databases.
To help the user focus his research,
Eurostat has created themes', i.e. subject
classifications. The statistical documents
and publications are listed by series: e.g.
yearbooks, short-term trends or
method-ology in order to facilitate access to the
statistical data.
Y. Franchet
Director-General
Pour établir, évaluer ou apprécier les
dif-férentes politiques communautaires, la
Commission européenne a besoin
d'infor-mations.
Eurostat a pour mission, à travers le
sys-tème statistique européen, de répondre
aux besoins de la Commission et de
l'en-semble des personnes impliquées dans
le développement du marché unique.
Pour mettre à la disposition de tous
l'im-portante quantité de données accessibles
et faire en sorte que chacun puisse
s'orienter correctement dans cet
ensem-ble, deux grandes catégories de
docu-ments ont été créées: les docudocu-ments
statistiques et les publications.
Le document statistique s'adresse aux
spécialistes. Il fournit les données les plus
complètes: données de référence où la
méthodologie est bien connue,
standar-disée, normalisée et scientifique. Ces
données sont présentées à un niveau très
détaillé. Le document statistique est
des-tiné aux experts capables de rechercher,
par leurs propres moyens, les données
requises. Les informations sont alors
disponibles sur papier et/ou sur disquette,
bande magnétique, CD-ROM. La
couver-ture blanche ornée d'un graphisme stylisé
démarque le document statistique des
autres publications.
Les publications proprement dites
peu-vent, elles, être réalisées pour un public
bien déterminé, ciblé, par exemple
l'enseignement ou les décideurs
politi-ques ou administratifs. Des informations
sélectionnées, triées et commentées en
fonction de ce public lui sont apportées.
Eurostat joue, dès lors, le rôle de
conseil-ler.
Dans le cas d'un public plus large, moins
défini, Eurostat procure des éléments
nécessaires à une première analyse, les
annuaires et les périodiques, dans
les-quels figurent les renseignements
adé-quats pour approfondir l'étude. Ces
publications sont présentées sur papier
ou dans des banques de données de type
vidéotex.
ENERGIEPREISE
Eine Übersicht über die Verbraucherpreise
für Gas, Elektrizität und Erdölprodukte
in der Europäischen Union bis 1994
ENERGY PRICES
A summary of consumer prices
for gas, electricity and oil
in the European Union up to 1994
PRIX DE L'ÉNERGIE
Un aperçu des prix à la consommation
du gaz, de l'électricité et des produits pétroliers
à l'intérieur de l'Union européenne,
mis à jour jusqu'en 1994
Themenkreis / Theme / Thème
Energie und Industrie / Energy and industry / Énergie et industrie
Reihe / Series / Série
Bibliographische Daten befinden sich am Ende der Veröffentlichung.
Cataloguing data can be found at the end of this publication.
Une fiche bibliographique figure à la fin de l'ouvrage.
Für alle Informationen über diese Veröffentlichung wenden Sie sich bitte an:
For all information concerning this publication, contact:
Pour toute information concernant cette publication, s'adresser à:
Eurostat, tél. (352) 43 01-3 20 40
Manuscktipt abgeschlossen im Oktober 1994
Manuskript completed in October 1994
Manuscrit terminé en octobre 1994
Luxembourg: Office des publications officielles des Communautés européennes, 1995
ISBN 92-826-8320-6
© EGKS-EG-EAG, Brüssel · Luxemburg, 1995
Nachdruck — ausgenommen zu kommerziellen Zwecken — mit Quellenangabe gestattet.
© ECSC-EC-EAEC, Brussels · Luxembourg, 1995
EUROSTAT - ENERGIEPREISE 1973-1994
INHALTSVERZEICHNIS
Seite
EINLEITUNG
.11
STATISTISCHE TABELLEN
I. Endverbraucherpreise für Energie
in Landeswährung, ECU und KKS
II. Preisvergleich auf Endenergieebene
-Sektoren Industrie und Haushalte (mit Grafiken)
III. Preisvergleich auf Nutzenergieebene
-Sektoren Industrie und Haushalte
Sektoren Industrie und Haushalte nach Indizes
IV. Steuerinzidenz
15 bis 104
105 bis 112
113 bis 116
117 und 118
119 bis 126
ANHÄNGE
Anhang I : Quellenangaben und Anmerkungen zur Methodik
127 bis 129
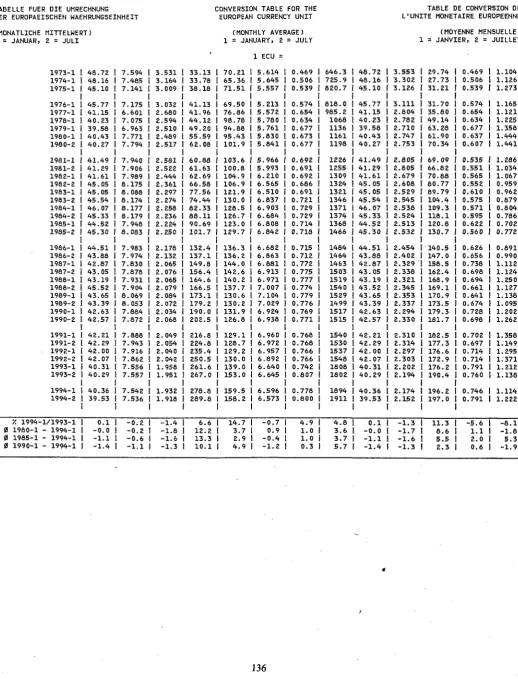
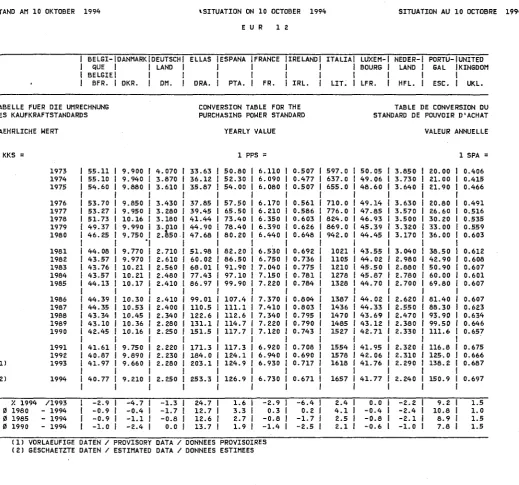
Anhang II : Umrechnungstabellen
136 bis 139
Anhang III Endenergiebilanzen verwendet für gewogene Mittelwerte
- Haushaltsverbraucher
- Industrieverbraucher
140 und 141
142 und 143
EUROSTAT - ENERGY PRICES 1973-1994
TABLE OF CONTENTS
INTRODUCTION
Page
12
STATISTICAL TABLES
I. Final consumer prices of energy
in national currencies, ECU and PPS
II. Comparison between supplied energy prices
-Industrial and household sector (with graphics)
III. Comparison between useful energy prices
-Industrial and household sector
Industrial and household sector with Indices
IV.
Incidence of taxation
15 to 104
105
to
112
113 to 116
117 and 118
119 to 126
ANNEXES
Annex I : Notes on sources and methods
130 to 132
Annex II :
Conversion tables
136 to 139
Annex
Final "Energy Balance sheet", used for the weighted averages
- Household consumers 140 and 141
- Industrial consumers 142 and 143
EUROSTAT- PRIX DE L'ENERGIE 1973-1994
TABLE DES MATIERES
Page
INTRODUCTION
13
TABLEAUX STATISTIQUES
I. Prix à la consommation finale de l'énergie
en monnaies nationales, ECU et SPA
II. Comparaison entre les prix de l'énergie finale
-Secteurs industriel et domestique (avec graphiques)
III. Comparaison entre les prix de l'énergie utile
-Secteurs industriel et domestique
Secteurs industriel et domestique d'après indices
IV. Incidence de la fiscalité
15 à 104
105à 112
113 à 116
117 et 118
119 à 126
ANNEXES
Annexe I :
Note concernant les sources et la méthodologie
133 à 135
Annexe II :
Tables de conversion
136 à 139
Annexe III : Consommation finale en 1000 tep utilisée
pour les pondérations
- Utilisateurs domestiques
- Utilisateurs industriels
140 et 141
142 et 143
EUROSTAT - ENERGIEPREISE 1973-1994
ZEICHEN UND ABKÜRZUNGEN
Kein Nachweis vorhanden
1980 = 100
0
kWh
GWh
h
a
GJ
Ho
Hu
HS
tRÖE
MWSt
BFR
DKR
ØRE
DM
Pf
DR
PTA
FF v
Cent.
IRE
Pence
LIT
LFR
HFL
Cent
ESC
UK£
Pence
ECU
KKS
BIP
EUR 12
EUROSTAT
Basisjahr
jährlicher durchschnittlicher pr
Kilowattstunden
Gigawattstunden (10
6kWh)
Stunde
Jahr
Gigajoule (10
3MJ)
oberer Heizwert
• unterer Heizwert
hoher Schwefelgehalt
Tonne Rohöleinheiten
Mehrwertsteuer
Belgische Francken
Dänische Kroner
1/100 Dänische Kronen
Deutsche Mark
Pfennig
Drachmen
Spanische Peseten
Französischer Franken
1/100 Französischer Franken
Irisches Pfund
1/100 Irisches Pfund
Italienische Lire
Luxemburgischer Franken
Holländische Gulden
1/100 Holländische Gulden
Portugiesische Eskudos
Pfund Sterling
1/100 Pfund Sterling
Europäische Währungseinheit
Kaufkraftstandard
Bruttoinlandsprodukt
EUROSTAT - ENERGY PRICES 1973-1994
SYMBOLS AND ABBREVIATIONS
1980 = 100
ø
kWh
GWh
h
a
GJ
GCV
NCV
HSC
toe
VAT
No data available
Reference year
Annual average percentage increase
Kilowatt hour
Gigawatt hour (10
6kWh)
Hour
Year
Gigajoule (10
3MJ)
Gross calorific value
Net calorific value
High sulphur content
Tonne of oil equivalent
Value added tax
BFR
DKR
ØRE
DM
Pf
DR
PTA
FF
Cent.
IRE
Pence
LIT
LFR
HFL
Cent
ESC
UK£
Pence
ECU
PPS
GDP
EUR 12
EUROSTAT
Belgian franc
Danish crown
1/100 Danish crown
German mark
Pfennig
Drachma
Peseta
French franc
1/100 French franc
Irish pound
1/100 Irish pound
Italian lira
Luxembourg franc
Dutch guilder
1/100 Dutch guilder
Escudo
Pound sterling
1/100 Pound sterling
European currency unit
Purchasing power standard
Gross domestic product
EUROSTAT PRIX DE L'ENERGIE 19731994
SIGNES ET ABREVIATIONS
1980 = 100
0
kWh
GWh
h
a
GJ
PCS
PCI
HTS
tep
TVA
BFR
DKR
ØRE
DM
Pf
DR
PTA
FF
Cent.
IRE
Pence
LIT
LFR
HFL
Cent
ESC
UK£
Pence
ECU
SPA
PIB
EUR 12
EUROSTAT
Donnée non disponible
Année de base
Pourcentage annuel moyen d'évolution
Kilowattheure
Gigawattheure (10
6kWh)
Heure
Année
Gigajoule (10
3MJ)
Pouvoir calorifique supérieur
Pouvoir calorifique inférieur
Haute teneur en soufre
Tonne d'équivalent pétrole
Taxe à la valeur ajoutée
Franc belge
Couronne danoise
1/100 Couronne danoise
Deutsche Mark
1/100 Deutsche Mark
Drachme
Peseta
Franc français
1/100 Franc français
Livre irlandaise
1/100 Livre irlandaise
Lire italienne
Franc luxembourgeois
Florin néerlandais
1/100 Florin néerlandais
Escudo
Livre sterling
1/100 Livre sterling
Unité monétaire européenne
Standard de pouvoir d'achat
Produit intérieur brut
EUROSTAT - ENERGIEPREISE 1973-1994
1. EINLEITUNG
EUROSTAT sammelt und veröffentlicht zahlreiche Angaben über die Energiepreise in den
Mitgliedstaaten. Mit der vorliegenden Veröffentlichung soll für die grossen Energieträger in
möglichst knapper Form über die Preise der letzten Jahre informiert werden. Es wurden daher
bewusst nur die Entwicklungen bis zu dem Zeitpunkt betrachtet, zu dem Informationen für alle
Energieträger verfügbar waren. Einzelne Preisangaben für spezifische Energieträger können aus
der Fachpresse und insbesondere aus:
- dem wöchentlichen "Oel-Preis-Bulletin"
- den halbjährlichen Schnellberichten über Gas und Elektrizität
- den jährlichen Veröffentlichungen "Gaspreise" und "Elektrizitätspreise"
der Kommission entnommen werden.
EUROSTAT - ENERGY PRICES 1973-1994
1. INTRODUCTION
EUROSTAT collects and publishes a wide range of information on energy prices in the Member
States. The aim of this publication is to summarize as succintly as possible the most recent price
information for the principal energy sources. It is therefore deliberately confined to trends up to the
date at which information for all these energy sources was available. More detailed prices for
particular sources can be found in the specialist press and notably in:
- the weekly "Oil Price Bulletin"
- the half-yearly "Rapid Reports" for "Gas" and "Electricity"
- the yearly publications "Gas prices" and "Electricity prices"
published by the Commission.
EUROSTAT- PRIX DE L'ENERGIE 1973-1994
1. INTRODUCTION
EUROSTAT recueille et publie de nombreuses informations sur les prix de l'énergie dans les Etats
membres. Le but de cette publication est de rassembler de la manière la plus synthétique possible
les informations les plus récentes sur les prix couvrant les principales sources d'énergie. Elle se
limite par conséquent à l'évolution observée jusqu'au moment où les informations pour toutes ces
sources ont été disponibles. Pour certaines sources d'énergie, le lecteur intéressé trouvera des
données de prix plus détaillées dans les publications spécialisées de la Commission, et en
particulier, dans :
- le "bulletin Pétrolier", hebdomadaire
- les notes rapides semestrielles sur le "Gaz" et "l'Electricité"
- les publications annuelles "Prix du Gaz" et "Prix de l'Electricité".
NATURGAS NATURAL GAS GAZ NATUREL
i : JANUAR JANUARY JANVIER Ζ· J U L I
JULY J U I L L E T
BELGIQUE BRUXELLES BFR
y. y. a y. β y. 0
DANMARK ( 1 ) KOEBENHAVN DKR
y. y. 0 y. 0 y. 0 94 80 8 5 90
94 80 8 5 90
1 9 7 3 - 1 1 9 7 4 - 1 1 9 7 5 - 1 1 9 7 6 - 1 1 9 7 7 - 1 1 9 7 8 - 1 1 9 7 9 - 1 1 9 8 0 - 1 1 9 8 1 - 1 1 9 8 2 - 1 1 9 8 3 - 1 1 9 8 4 - 1 1 9 8 5 - 1 1 9 8 6 - 1 1 9 8 7 - 1 1 9 8 8 - 1 1 9 8 9 - 1 1 9 9 0 - 1 1 9 9 1 - 1 - 2 1 9 9 2 - 1 - 2 1 9 9 3 - 1 - 2 1 9 9 4 - 1 - 2 - 1 / 9 3 - 1 - 1 9 4 - 1 - 1 9 4 - 1 - 1 9 4 - 1 1 9 7 3 - 1 1 9 7 4 - 1 1 9 7 5 - 1 1 9 7 6 - 1 1 9 7 7 - 1 1 9 7 8 - 1 1 9 7 9 - 1 1 9 8 0 - 1 1 9 8 1 - 1 1 9 8 2 - 1 1 9 8 3 - 1 1 9 8 4 - 1 1 9 8 5 - 1 1 9 8 6 - 1 1 9 8 7 - 1 1 9 8 8 - 1 1 9 8 9 - 1 1 9 9 0 - 1 1 9 9 1 - 1 - 2 1 9 9 2 - 1 - 2 1 9 9 3 - 1 - 2 1 9 9 4 - 1 - 2 - 1 / 9 3 - 1 - 1 9 4 - 1 - 1 9 4 - 1 - 1 9 4 - 1
HAUSHALTSVERBRAUCHER: 1 6 . 7 4 GJ/JAHR HOUSEHOLD CONSUMER: 16 74 GJ/YEAR CONSOMMATEURS DOMESTIQUES: 1 6 . 7 4 GJ/AN NATIONALE WAEHRUNG
NATIONAL CURRENCY MONNAIE NATIONALE STEUERN I OHNE INBEGR. IMEHRWERT.
WITH 1 TAXES 1 TAXES 1 COMPRISES 1
2 4 5 . 0 2 5 2 . 6 3 0 0 . 7 3 1 7 . 0 3 4 1 . 0 3 5 2 . 0 3 5 5 . 4 3 6 3 . 4 4 5 8 . 4 5 4 6 . 4 5 9 1 . 3 6 2 8 . 5 6 6 3 . 9 6 4 8 . 6 5 1 9 . 5 5 1 7 . 1 5 0 6 . 7 5 4 4 . 5 5 6 9 . 0 5 6 9 . 1 5 6 2 . 0 5 6 5 . 0 5 6 4 . 1 5 6 2 . 6 5 8 9 . 9
4 . 6 3 . 1 - 1 . 3 2 . 0 2 4 . 3 3 2 6 . 5 3 4 3 . 3 5 4 3 . 9 8 5 9 . 1 9 6 6 . 8 7 7 7 . 0 1 1 1 1 . 2 0 1 3 4 . 4 0 1 4 3 . 0 6 1 7 2 . 2 9 1 7 0 . 6 8 1 6 2 . 0 1 1 6 3 . 1 0 1 4 0 . 2 1 1 5 4 . 1 3 1 7 1 . 8 5 2 0 0 . 0 0 2 4 7 . 3 5 2 2 7 . 3 1 2 5 0 . 9 1 2 4 7 . 6 0 2 3 4 . 9 4 2 4 0 . 0 6 2 0 7 . 2 9
- 1 1 . 8 4 . 5 2 . 8 1 0 . 9
VAT EXC. HORS
TVA 2 3 1 . 1 2 3 8 . 3 2 7 9 . 1 2 9 9 . 0 3 2 2 . 0 3 3 2 . 0 3 3 5 . 3 3 6 1 . 7 3 9 5 . 2 4 6 7 . 0 5 0 5 . 4 5 3 7 . 2 5 6 7 . 5 5 5 4 . 4 4 4 4 . 0 4 4 2 . 2 4 3 3 . 1 4 6 5 . 4 4 8 6 . 3 4 8 6 . 4 4 8 0 . 3 4 7 2 . 8 4 7 2 . 0 4 7 0 . 8 4 8 9 . 6
2 1 . 1 5 2 3 . 0 6 3 7 . 6 9 4 0 . 2 5 5 1 . 4 7 5 6 . 6 7 6 4 . 0 4 9 2 . 4 7 1 1 0 . 1 6 1 1 7 . 2 6 1 4 1 . 2 2 1 3 9 . 9 0 1 3 2 . 8 0 1 3 3 . 6 9 1 1 4 . 9 3 1 2 6 . 3 4 1 4 0 . 8 6 1 6 3 . 9 2 2 0 2 . 7 5 1 8 6 . 3 2 2 0 0 . 7 3 1 9 8 . 0 8 1 8 7 . 9 5 1 9 2 . 0 5 1 6 5 . 8 3
OHNE STEUERN
TAXES EXC. HORS TAXES
2 3 1 . 1 2 3 8 . 3 2 7 9 . 1 f 2 9 9 . 0 3 2 2 . 0 3 3 2 . 0 3 3 5 . 3 3 6 1 . 7 3 9 5 . 2 4 6 7 . 0 5 0 5 . 4 5 3 7 . 2 5 6 7 . 5 5 5 4 . 4 4 4 4 . 0 4 4 2 . 2 4 3 3 . 1 4 6 5 . 4 4 8 6 . 3 4 8 6 . 4 4 8 0 . 3 4 7 2 . 8 4 7 2 . 0 4 7 0 . 8 4 7 5 . 9
2 1 . 1 5 2 3 . 0 6 3 7 . 6 9 4 0 . 2 5 5 1 . 4 7 5 6 . 6 7 6 4 . 0 4 8 0 . 5 3 1 0 0 . 6 0 1 0 7 . 7 1 1 3 1 . 6 6 1 3 9 . 9 0 1 3 2 . 8 0 1 3 3 . 6 9 1 1 4 . 9 3 1 2 6 . 3 4 1 4 0 . 8 6 1 6 3 . 9 2 2 0 2 . 7 5 1 8 6 . 3 2 2 0 0 . 7 3 1 9 8 . 0 8 1 8 7 . 9 5 1 9 2 . 0 5 1 6 5 . 8 3
KKS
STEUERN INBEGR.
WITH TAXES TAXES COMPRISES
4 . 4 5 4 . 5 8 5 . 5 1 5 . 9 0 6 . 4 0 6 . 8 0 7 . 2 0 8 . 2 9 1 0 . 4 0 1 2 . 5 4 1 3 . 5 1 1 4 . 4 3 1 5 . 0 4 1 4 . 6 1 1 1 . 7 1 1 1 . 9 3 1 1 . 7 6 1 2 . 8 3 1 3 . 6 7 1 3 . 6 8 1 3 . 7 5 1 3 . 8 2 1 3 . 4 4 1 3 . 4 0 1 4 . 4 7
7 . 7 4 . 1 - 0 . 4 3 . 1 2 . 4 6 2 . 6 7 4 . 3 9 4 . 4 6 5 . 9 5 6 . 5 8 7 . 7 1 1 1 . 4 1 1 3 . 7 6 1 4 . 3 5 1 6 . 8 7 1 6 . 7 2 1 5 . 9 3 1 5 . 8 3 1 3 . 3 2 1 4 . 7 5 1 6 . 5 9 1 9 . 6 9 2 5 . 3 7 2 3 . 3 1 2 5 . 3 7 2 5 . 04 2 4 . 3 2 2 4 . 8 5 2 2 . 5 1 - 7 . 5 5 . 0 3 . 9 3 . 4
PPS
OHNE MEHRWERT.
VAT EXC. HORS TVA 4 . 1 9 4 . 3 2 5 . 1 1 5 . 5 7 6 . 0 4 6 . 4 2 6 . 7 9 7 . 8 2 8 . 9 7 1 0 . 7 2 1 1 . 5 5 1 2 . 3 3 1 2 . 8 6 1 2 . 4 9 1 0 . 0 1 1 0 . 2 0 1 0 . 0 5 1 0 . 9 6 1 1 . 6 9 1 1 . 6 9 1 1 . 7 5 1 1 . 5 7 1 1 . 2 5 1 1 . 2 2 1 2 . 0 1
2 . 1 4 2 . 3 2 3 . 8 1 4 . 0 9 5 . 1 7 5 . 5 8 6 . 4 1 9 . 4 8 1 1 . 2 8 1 1 . 7 6 1 3 . 8 3 1 3 . 7 0 1 3 . 0 6 1 2 . 9 8 1 0 . 9 1 1 2 . 0 9 1 3 . 6 0 1 6 . 1 3 2 0 . 7 9 1 9 . 1 1 2 0 . 3 0 2 0 . 0 3 1 9 . 4 6 1 9 . 8 8 1 8 . 0 1
SPA
OHNE STEUERN
TAXES EXC. HORS TAXES
4 . 1 9 4 . 3 2 5 . 1 1 5 . 5 7 6 . 0 4 6 . 4 2 6 . 7 9 7 . 8 2 8 . 9 7 1 0 . 7 2 1 1 . 5 5 1 2 . 3 3 1 2 . 8 6 1 2 . 4 9 1 0 . 0 1 1 0 . 2 0 1 0 . 0 5 1 0 . 9 6 1 1 . 6 9 1 1 . 6 9 1 1 . 7 5 1 1 . 5 7 1 1 . 2 5 1 1 . 2 2 1 1 . 6 7
2 . 1 4 2 . 3 2 3 . Θ 1 4 . 0 9 5 . 1 7 5 . 5 8 6 . 4 1 8 . 2 6 1 0 . 3 0 1 0 . 8 0 1 2 - 9 0 1 3 . 7 0 1 3 . 0 6 1 2 . 9 8 1 0 . 9 1 1 2 . 0 9 1 3 . 6 0 1 6 . 1 3 2 0 . 7 9 1 9 . 1 1 2 0 . 3 0 2 0 . 03 1 9 . 4 6 1 9 . a-a 1 8 . 0 1
STEUERN I
PREISE PRO GJ ( H O ) PRICES PER GJ (GCV) PRIX PAR GJ ( P C S )
ECUS
OHNE INBEGR. IMEHRWERT.
WITH 1 TAXES I TAXES I COMPRISES 1
5 . 0 3 5 . 2 5 6 . 6 7 6 . 9 3 8 . 2 9 8 . 7 5 8 . 9 8 9 . 4 8 1 1 . 0 5 1 3 . 1 3 1 3 . 1 3 1 3 . 6 4 1 4 . 9 1 1 4 . 5 7 1 2 . 1 2 1 1 . 9 7 1 1 . 6 1 1 2 . 7 7 1 3 . 4 8 1 3 . 4 6 1 3 . 3 8 1 3 . 4 3 1 3 . 9 9 1 3 . 9 6 1 4 . 6 2
4 . 5 3 . 1 - 0 . 2 3 . 4 3 . 2 0 3 . 5 4 6 . 0 7 6 . 1 3 8 . 9 7 9 . 4 5 1 1 . 0 6 1 4 . 3 1 1 6 . 9 3 1 7 . 9 1 2 1 . 3 0 2 0 . 8 7 2 0 . 3 8 £ 0 . 4 3 1 7 . M 1 9 . 4 5 ε ι . 3 0 £ 5 - 3 ? 3 1 - 3 6
~ : t
-3 1 . 7 9 3 1 . 5 0 3 1 . V9 3 1 . 7 ? 1 8 7 . * » 1
- 1 1 . 6
*.e
ί 3 . * Ι ε . β
VAT EXC. HORS TVA 4 . 7 4 4 . 9 5 6 . 1 9 6 . 5 3 7 . 8 2 8 . 2 5 8 . 4 7 8 . 9 5 9 . 5 2 1 1 . 2 2 1 1 . 2 2 1 1 . 6 6 1 2 . 7 5 1 2 . 4 6 1 0 . 3 6 1 0 . 2 4 9 . 9 2 1 0 . 9 2 1 1 . 5 2 1 1 . 5 0 1 1 . 4 3 1 1 . 2 4 1 1 . 7 1 1 1 . 6 8 1 2 . 1 3
2 . 7 9 3 . 0 8 5 . 2 8 5 . 6 1 7.SO 6 . 0 1 9 . 2 0 1 1 . 9 0 1 3 - 8 7 1 4 . &a 1 7 . * * 1 7 . 1 1 1 6 . 7 1 1 6 . 7 5 M . S B 1 5 - 9 3 1 7 . « £ SO-?« SS. ~t> 2 3 . * 6 £ 5 . 3 6 E E . s a
æ*.a?
¡SM
2 1 . OT
OHNE 1
STEUERN I
TAXES I
EXC. 1
HORS I
TAXES I
4 . 7 4 1 4 . 9 5 1 6 . 1 9 1 6 . 5 3 1 7 . 8 2 1 6 . 2 5 1 8 . 4 7 1 8 . 9 5 1 9 . 5 2 1 1 1 . 2 2 1 1 1 . 2 2 1 1 1 . 6 6 1 1 2 . 7 5 1
1 2 . 4 6 1 1 0 . 3 6 1 1 0 . 2 4 I 9 . 9 2 1 1 0 . 9 2 1 1 1 . 5 2 1 1 1 . 5 0 1 1 1 . 4 3 1 1 1 . 2 4 I 1 1 . 7 1 I 1 1 . 6 8 1 1 1 . 7 9 1
2 . 7 9 1 3 . 0 8 i 5 . 2 3 1 5 . 6 1 j
?.ao I
8 3 1 Β 9 . 2 0 1 1 0 . 3 6 ì I ι
1 2 . 6 7 I 1 3 * 3 I 1 & . Î S i! 1 7 . 1 1 1 1 & . 7 1 1
1 6 7 5 β M r . * * 1] JSWS il 1 7 . 4 6 IS
Β
2 5 . 7 8 I £ 3 . % à ! 3 . 3 6 i
Í S .
a I
2Ά.&7 I S - % 1 1 EL. TOs
I
Î
NATURGAS NATURAL GAS GAZ NATUREL
HAUSHALTSVERBRAUCHER: 16.74 GJ/JAHR HOUSEHOLD CONSUMER: 16.74 GJ/YEAR CONSOMMATEURS DOMESTIQUES: 16.74 GJ/AN
PREISE PRO GJ (HO PRICES PER GJ IGCV PRIX PAR GJ (PCS NATIONALE WAEHRUNG
NATIONAL CURRENCY
MONNAIE NATIONALE
KKS
PPS
SPA
ECUSi: JANUAR JANUARY JANVIER 2: JULI
JULY JUILLET
STEUERN I OHNE INBEGR. IMEHRWERT.
WITH I VAT TAXES I EXC. TAXES I HORS COMPRISES I TVA
OHNE STEUERN
TAXES EXC. HORS TAXES
STEUERN I OHNE INBEGR. IMEHRWERT.
WITH I VAT TAXES I EXC. TAXES I HORS COMPRISES| TVA
OHNE STEUERN
TAXES EXC. HORS TAXES
STEUERN I OHNE INBEGR. IMEHRWERT.
WITH I VAT TAXES I EXC. TAXES | HORS COMPRISES I TVA
OHNE STEUERN
TAXES EXC. HORS TAXES
DEUTSCHLAND DUESSELDORF
DM
1973-1
1974-1
1975-1
1976-1
1977-1
1978-1
1979-1
1980-1
1981-1
1982-1
1983-1
1984-1
1985-1
1986-1
1987-1
1988-1
1989-1
1990-1
1991-1
-2
1992-1
- 2
1993-1
- 2
1994-1
- 2
16.05
14.59
16.05
22.13
22.13
22.33
22.33
22.53
27.33
35.47
33.85
33.85
33.85
23.97
23.97
24.03
25.77
26.29
28.53
28.53
28.54
28.14
28.14
27.49
14.46
13.14
14.46
19.94
19.94
19.94
19.94
19.94
24.19
31.39
29.69
29.69
29.69
21.03
21.03
21.08
22.60
23.06
25.03
25.03
25.04
24.47
24.47
23.90
14.46
13.14
14.46
19.94
19.94
19.94
19.94
19.94
24.19
31.39
29.69
29.69
29.69
21.03
21.03
20.36
21.88
22.33
24.03
24.03
24.04
23.47
23.47
22.90
3.94
3.77
4.45
6.45
6.75
7.02
7.42
7.91
10.08
13.59
13.65
14.05
14.05
9.99
10.24
10.54
11.45
11.84
12.85
12.79
12.80
12.34
12.34
12.22
3.55
3.40
4 . 0 1
5.81
6.08
6.27
6.62
7.00
8.93
12.03
11.97
12.32
12.32
6.76
8.99
9.25
10.04
10.39
11.27
11.22
11.23
10.73
10.73
10.62
3.55
3.40
4.01
5.81
6.08
6.27
6.62
7.00
8.93
12.03
11.97
12.32
12.32
8.76
8.99
8.93
9.72
10.06
10.82
10.78
10.78
10.29
10.29
10.18
4.55
4.61
5.33
7.30
6.26
8.61
8.90
9.05
10.59
14.51
14.99
15.22
15.54
11.61
11.61
11.53
12.67
12.83
13.89
13.99
13.97
14.37
14.42.
14.23
4.09
4.15
4.80
6.58
7.44
7.69
7.94
8.01
9.37
12.84
13.15
13.35
13.63
10.19
10.18
10.11
11.11
11.26
12.18
12.27
12.26
12.50
12.54
12.37
4.09
4.15
4.80
6.56
7.44
7.69
7.94
8.01
9.37
12.84
13.15
13.35
13.63
10.19
10.18
9.77
10.76
10.90
11.70
11.78
11.77
11.99
12.03
11.86
·/. 94-1/93-1
·/. 0 80-1 94-1
'λ 0 85-1 94-1
'/. 0 90-1 94-1
-2.3
1.4
-2.3
1.6
-1.0
3.2
-1.5
1.6
-1.0
3.3
-0.7
2.9
ELUS (1)
DR
1973-1
1974-1
1975-1
1976-1
1977-1
1978-1
1979-1
1980-1
1981-1
1982-1
1983-1
1984-1
1985-1
1986-1
1987-1
1988-1
1989-1
1990-1
1991-1
-2
1992-1
-2
y. 94-1/93-1
y. 0 80-1 94-1
'Ζ. 0 85-1 94-1
y. 0 90-1 94-1
NATURGAS NATURAL GAS GAZ NATUREL
i: JANUAR JANUARY JANVIER 2: JULI
JULY JUILLET
ESPANA (1)
BARCELONA
PTA
y. y. ø
y. 0
y. 0
FRANCE
PARIS
FF
y.
y. 0
y. 0
y. 0 94 80 85 90
94 80 85 90
19731 19741 19751
19761 19771 19781 19791 19801
19811 19821 19831 19841 19651
19861 19871 19881 19891 19901
19911 2 19921 2 19931 2 19941 2
1/931 1 941 1 941 1 941
19731 19741 19751
19761 19771 19781 19791 19801
19811 19821 19831 19841 19851
19861 19871 19881 19891 19901
19911 2 19921 2 19931 2 19941 2
1/931 1 941 1 941 1 941
HAUSHALTSVERBRAUCHER: 16 74 GJ/JAHR HOUSEHOLD CONSUMER: 16.74 GJ/YEAR CONSOMMATEURS DOMESTIQUES
NATIONALE WAEHRUNG NATIONAL CURRENCY MONNAIE NATIONALE
STEUERN 1 OHNE INBEGR. IMEHRWERT.
WITH I
TAXES I TAXES I COMPRISES!
.
•
•
953.0
953.0 1102.0 1236.0 1454.0 1558.0
1991.0 1643.0 1643.0 1653.0 1694.0
1777.0 1777.0 1945.3 1945.3 1979.7 1979.7 1979.7
0.0 5.4 2.7 4.0
25.41 26.93 36.10
36.08 38.53 41.02 45.15 57.77
66.11 79.00 87.70 94.47 108.61
104.70 86.68 83.26 82.54 84.58
67.86 69.08 90.26 87.96
I 86.25
I 86.25
i 86.25
I 0.0
I 2.9
! 2.5
0.5 VAT EXC. HORS TVA
.
•
■
953.0
953.0 1102.0 1236.0 1454.0 1558.0
1778.0 1467.0 1467.0 1476.0 1512.0
1586.0 1586.0 1721.5 1721.5 1721.5 1721.5 1721.5
21.61 22.90 30.70
30.68 32.76 34.88 38.39 49.13
56.22 67.18 73.94 79.66 91.58
88.28 73.09 70.20 70.91 72.63
75.40 76.42 77.42 75.48 74.04 74.04 74.04
OHNE STEUERN
TAXES EXC. HORS TAXES
.
•
*
931.0
931.0 1080.0 1196.0 1433.0 1535.0
1752.0 1445.0 1445.0 1406.0 1490.0
1563.0 1563.0 1721.5 1721.5 1721.5 1721.5 1721.5
21.61 22.90 30.70
30.68 32.76 34.88 38.39 49.13
56.22 67.18 73.94 79.66 91.58
88.28 73.09 70.20 70.91 72.63
75.40 76.42 77.42 75.4Ö 74.04 74.04 74.04
KKS
STEUERN |
16.74 GJ/AN
PPS
OHNE INBEGR. ¡MEHRWERT.
WITH I
TAXES I TAXES I COMPRISES!
,
11.68
11.59 12.74 13.45 14.97 15.60
18.54 14.79 14.59 14.41 14.39
15.15 15.15 15.68 15.68 15.85 15.85 15.60
1.6 2.0 0.0 2.0
4.16 4.42 5.94
5.85 6.20 6.46 7.07 8.97
10.12 11.70 12.46 13.21 15.04
14.21 11.70 11.34 11.43 11.88
12.70 12.87 13.01 12.67
I 12.45
ί 12.45 [ 12.82
3.0 2.6 I -1.8 I 1.9
VAT EXC. HORS TVA
,
■
•
11.88 11.59 12.74 13.45 14.97 15.60 16.55 13.20 13.03 12.87 12.85 13.52 13.52 13.87 13.87 13.78 13.78 13.57
3.54 3.76 5.05 4.97 5.28 5.49 6.01 7.63 8.61 9.95 10.50 11.14 12.68 11.98 9.86 9.56 9.82 10.20 10.90 11.04 11.16 10.88 10.68 10.68 11.00
SPA
OHNE STEUERN
TAXES EXC. HORS TAXES
.
•
■
11.61 11.33 12.49 13.01 14.76 15.37 16.31 13.01 12.83 12.26 12.66 13.32 13.32 13.87 13.87 13.78 13.78 13.57
3.54 3.76 5.05 4.97 5.28 5.49 6.01 7.63 8.61 9.95 10.50 11.14 12.68 11.96 9.86 9.56 9.82 10.20 10.90 11.04 11.16 10.88 10.68 10.68 11.00
STEUERN I
PREISE PRO GJ (HO) PRICES PER GJ (GCV) PRIX PAR GJ (PCS)
ECUS
OHNE INBEGR. IMEHRWERT.
WITH 1 TAXES I TAXES 1
COMPRISES!
.
-•
9.99 9.20 10.51 10.14 11.32 12.67 14.61 11.41 11.72 12.66 12.84 13.76 13.81 15.05 14.97 14.24 12.94 12.41
-12.8 1.6 -0.2 -0.8 4.53 4.77 6.50 6.92 6.91 7.10 7.84 9.91 11.08 12.72 13.47 13.68 15.95 15.67 12.60 11.94 11.62 12.22 12.62 12.78 12.97 12.76 12.99 12.96 13.08
0.7 2.0 -2.2 1.7
VAT EXC. HORS TVA
,
•
•
9.99 9.20 10.51 10.14 11.32 12.67 13.05 10.19 10.46 11.30 11.46 12.28 12.33 13.32 13.24 12.39 11.25 10.80
3.85 4.06 5.52 5.89 5.88 6.03 6.66 8.43 9.42 10.82 11.36 11.54 13.45 13.21 10.62 10.07 9.98 10.49 10.83 10.96 11.13 10.95 11.15 11.14 11.22
OHNE I STEUERN I TAXES 1 EXC. 1 HORS I TAXES 1
,
I
I
9.76 1 8.99 I 10.30 1 9.81 1 11.15 I 12.48 I 12.86 1 10.04 1 10.30 I 10.77 I 11.30 1 12.10 1 12.15 1 13.32 1 13.24 1 12.39 I 11.25 I 10.80 1
3.85 I 4.06 1 5.52 I 5.89 1 5.88 I 6.03 1 6.66 1 8.43 I 9.42 1 10.82 1 11.36 1 11.54 1 13.45 1 13.21 I 10.62 1 10.07 1 9.98 1 10.49 1 10.83 1 10.96 1 11.13 1 10.95 1 11.15 I 11.14 1 11.22 1
NATURGAS NATURAL GAS GAZ NATUREL
i: JANUAR JANUARY JANVIER 2: JULI
JULY JUILLET
IRELAND (1)
IRL
y. 94 y. 0 80
y. 0 85 κ 0 90
ITALIA
ROMA
LIT
-y. 94
y.
0 et
X 0 65 X 0 90
1973-1 1974-1 1975-1
1976-1 1977-1 1978-1 1979-1 1980-1
1981-1 1982-1 1983-1 1984-1 1985-1
1986-1 1987-1 1986-1 1989-1 1990-1
1991-1 -2 1992-1 -2 1993-1 -2 1994-1 -2
-1/93-1 -1 94-1 -1 94-1 -1 94-1
1973-1 1974-1 1975-1
1976-1 1977-1 1978-1 1979-1 1960-1
1981-1 1982-1 1983-1 1984-1 1985-1
1986-1 1987-1 1988-1 1989-1 1990-1
1991-1 -2 1992-1 -2 1993-1 -2 1994-1 -2
-1/93-1 -1 94-1 -1 94-1 -1 94-1
HAUSHALTSVERBRAUCHER: 16 74 GJ/JAHR HOUSEHOLD CONSUMER: 16.74 GJ/YEAR CONSOMMATEURS DOMESTIQUES
NATIONALE WAEHRUNG
NATIONAL CURRENCY 1 MONNAIE NATIONALE 1
STEUERN | OHNE INBEGR. IMEHRWERT.
WITH I TAXES I TAXES I COMPRISES I
2.00 2.36 3.81
3.12 4.27 4.27 4.69 8.02
12.12 14.66 12.42 13.04 13.04
14.28 13.18 13.18 13.18 11.00
11.25 13.44-13.44 13.44 13.41 13.41 13.41
0.0 3.7 0.3 5.1
1631 1631 1749
1922 3451 5139 4362 6408
9978 10739 14915 16903 18241
19082 17011 16890 18727 18704
16849 16849 16849 16849 I 17659 I 17659 1 19670
1 11.4 1 8.3 1 0.8 1 1.3
VAT EXC. HORS TVA
1.90 2.21 3.57
3.12 4.27 4.27 4.69 8.02
12.12 14.68 12.42 12.42 12.42
12.98 11.98 11.98 11.98 10.00
10.00 11.95 11.95 11.95 11.92 11.92 11.92
1538 1538 1650
1813 3256 4848 4115 6045
9239 9944 13810 15651 16735
17506 15606 15495 17181 17160
16201 16201 16201 16201 16201 16201 18046
OHNE STEUERN
TAXES EXC. HORS TAXES 1
1.90 2.21 3.57
3.12 4.27 4.27 4.69 8.02
12.12 14.68 12.42 12.42 12.42
12.98 11.98 11.98 11.98 10.00
10.00 11.95 11.95 11.95 11.92 11.92 11.92
1538 1538 1650
1813 3256 4060 3327 5086
8451 9155 13022 14863 15946
16718 14817 14707 15160 15160
15630 15630 15630 15630 15630 15630 16487
KKS
STEUERN 1
16.74 GJ/AN
PPS
OHNE INBEGR. IMEHRWERT.
WITH I TAXES I TAXES I COMPRISES!
3.94 4.95 7.51
5.56 7.29 7.08 7.49 12.38
17.51 19.95 16.03 16.70 16.63
17.76 16.41 16.58 16.68 14.80
15.89 18.98 19.48 19.46 18.70 18.70 19.99
6.9 3.5 2.1 7.8
2.73 2.56 2.67
2.71 4.45 6.24 5.02 6.80
9.77 9.72 12.33 13.23 13.74
13.76 11.85 11.49 12.61 12.25
10.84 10.84 10.68 10.68 10.91 I 10.91
11.67
8.8 4.1 -1.6 I -0.8
VAT EXC. HORS TVA
3.75 4.64 7.04
5.56 7.29 7.08 7.49 12.38
17.51 19.95 16.03 15.90 15.84
16.14 14.92 15.07 15.16 13.46
14.12 16.88 17.32 17.32 16.62 16.62 17.76
2.58 2.42 2.52
2.55 4.20 5.88 4.74 6.42
9.05 9.00 11.41 12.25 12.60
12.62 10.87 10.54 11.57 11.24
10.43 10.43 10.27 10.27 10.01 10.01 10.89
SPA
OHNE STEUERN
TAXES EXC. HORS TAXES
3.75 4.63 7.04
5.56 7.29 7.08 7.49 12.38
17.51 19.95 16.03 15.90 15.84
16.14 14.92 15.07 15.16 13.46
14.12 16.88 17.32 17.32 16.62 16.62 17.76
2.58 2.42 2.52
2.55 4.20 4.93 3.83 5.40
8.28 8.29 10.76 11.63 12.01
12.05 10.32 10.00 10.21 9.93
10.06 10.06 9.90 9.90 9.66 9.66 9.95
STEUERN I
PREISE PRO GJ (HO) PRICES PER GJ (GCV) PRIX PAR GJ (PCS)
ECUS
OHNE INBEGR. IMEHRWERT.
WITH 1 TAXES 1 TAXES I COMPRISES!
4.27 4.67 7.07
5.43 6.52 6.74 6.92 11.91
17.52 21.21 17.98 17.89 18.26
19.96 17.07 16.96 16.92 14.30
14.65 17.50 17.54 17.54 18.08 16.63 17.23
-4.7 2.7 -0.6 4.8
2.52 2.25 2.13
2.35 3.50 4.81 3.84 5.52
8.14 8.20 11.29 12.33 13.34
12.85 11.63 11.12 12.25 12.33
10.94 11.01 10.96 10.89 9.77 ! 9.80
10.38
6.3 4.6 -2.7 1 -4.2
VAT EXC. HORS TVA
4.05 4.37 6.63
5.43 6.52 6.74 6.92 11.91
17.52 21.21 17.98 17.04 17.39
18.14 15.52 15.41 15.38 13.00
13.02 15.56 15.60 15.60 16.07 14.78 15.32
2.38 2.12 2.01
2.22 3.31 4.54 3.62 5.21
7.54 7.60 10.45 11.41 12.24
11.79 10.67 10.20 11.24 11.31
10.52 10.59 10.54 10.47 8.96 8.99 9.53
OHNE I STEUERN I
TAXES 1 EXC. 1 HORS 1 TAXES 1
4.05 1 4.37 1 6.63 !
5.43 1 6.52 1 6.74 I 6.92 1 11.91 1
17.52 ! 21.21 1 17.98 1 17.04 1 17.39 1
18.14 I 15.52 1 15.41 1 15.38 1 13.00 1
13.02 1 15.56 1 15.60 1 15.60 1 16.07 1 14.78 1 15.32 1
2.38 1 2.12 1 2.01 1
2.22 1 3.31 1 3.80 1 2.93 1 4.38 1
6.89 1 6.99 ! 9.86 1 10.84 1 11.66 1
11.26 1 10.13 1 9.68 1 9.92 1 9.99 I
10.15 1 10.22 1 10.17 1 10.10 ! 8.64 1 8.67 1 8.70 1
NATURGAS NATURAL GAS GAZ NATUREL
i: JANUAR JANUARY JANVIER 2: JULI
JULY JUILLET
LUXEMBOURG
LUXEMB. VILLE
LFR
y.
y. 0
y. 0
y. 0
NEDERLAND
ROTTERDAM
HFL
y.
y. 0
y. 0
y. 0 94 80 85 90
94 80 85 90
19731 19741 19751
19761 19771 19781 19791 19801
19811 19621 19831 19841 19851.
19861 19871 19881 19891 19901
19911 2 19921 2 19931 2 19941 2
1/931 1 941 1 941 1 941
19731 19741 19751
19761 19771 19781 19791 19801
19811 19821 19831 19841 19851
19861 19871 19881 19891 19901
19911 2 19921 2 19931 2 19941 2
1/931 1 941 1 941 1 941
HAUSHALTSVERBRAUCHER: 16.74 GJ/JAHR HOUSEHOLD CONSUMER: 16 74 GJ/YEAR CONSOMMATEURS DOMESTIQUES: 16.74 GJ/AN
NATIONALE WAEHRUNG NATIONAL CURRENCY MONNAIE NATIONALE
STEUERN 1 OHNE INBEGR. IMEHRWERT.
WITH I
TAXES I TAXES ! COMPRISES!
213.43 225.85 251.43
294.00 306.00 331.70 351.40 354.90
408.80 510.00 518.20 527.00 586.20
564.10 409.49 389.51 371.06 468.76
492.82 544.82 482.76 471.36 422.99 422.99 424.00
0.2 1.3 3.5 2.5
7.97 8.26 9.94
10.60 10.60 10.79 12.24 13.12
16.78 19.13 20.67 21.86 22.88
23.55 17.20 16.79 16.29 18.21
22.02 23.06 22.29 22.38 20.66 20.70 21.40
1 3.6
3.6 0.7 4.1
VAT EXC. HORS TVA
212.71 215.10 239.46
280.00 291.00 315.90 334.70 338.00
389.40 485.70 493.50 497.20 553.00
532.20 386.31 367.46 350.06 442.26
464.94 513.98 455.44 444.68 399.04 399.04 400.00
7.66 7.94 9.55
10.18 10.18 10.37 10.37 11.12
14.22 16.21 17.51 18.37 19.23
19.79 14.33 13.99 13.75 15.37
18.58 19.46 18.81 18.89 17.59 17.62 18.21
OHNE STEUERN
TAXES EXC. HORS TAXES
212.71 215.10 239.48
280.00 291.00 315.90 334.70 338.00
389.40 485.70 493.50 497.20 553.00
532.20 386.31 367.46 350.06 442.26
464.94 513.98 455.44 444.68 399.04 399.04 400.00
7.66 7.94 9.55
10.18 10.18 10.36 10.36 11.11
14.21 16.20 17.50 18.36 19.22
19.78 14.32 13.98 13.73 15.35
18.39 19.18 18.56 17.71 17.00 17.02 17.62
KKS
STEUERN INBEGR.
WITH TAXES TAXES COMPRISES
4.26 4.60 5.17
5.98 6.39 7.07 7.74 7.98
9.39 11.59 11.39 11.49 13.11
12.81 9.24 8.92 8.61 10.98
11.75 12.99 11.48 11.21 10.13 10.13 10.15
0.2 1.7 2.8 1.9
2.07 2.21 2.73
2.92 2.97 3.08 3.69 4.14
5.52 6.42 7.18 7.86 8.47
8.99 6.75 6.80 6.84 7.82
9.49 9.94 9.65 9.69 9.02 9.04 9.55
5.9 6.2 1.3
1 5.1
PPS
OHNE MEHRWERT.
VAT EXC. •HORS TVA
4.25 4.38 4.93
5.70 6.08 6.73 7.37 7.60
8.94 11.03 10.85 10.84 12.37
12.09 8.71 8.41 8.12 10.35
11.08 12.25 10.83 10.57 9.56 9.56 9.58
1.99 2.13 2.62
2.80 2.85 2.96 3.12 3.51
4.68 5.44 6.08 6.61 7.12
7.55 5.62 5.66 5.78 6.60
8.01 6.39 8.14 8.18 7.68 7.69 8.13
SPA
OHNE STEUERN
TAXES EXC. HORS TAXES
4.25 4.38 4.93
5.70 6.08 6.73 7.37 7.60
8.94 11.03 10.85 10.84 12.37
12.09 8.71 8.41 6.12 10.35
11.08 12.25 10.83 10.57 9.56 9.56 9.58
1.99 2.13 2.62
2.80 2.85 2.96 3.12 3.50
4.67 5.44 6.08 6.60 7.12
7.55 5.62 5.66 5.77 6.59
7.93 8.27 8.03 7.67 7.42 7.43 7.87
STEUERN !
PREISE PRO GJ (HO) PRICES PER GJ (GCV) PRIX PAR GJ (PCS)
ECUS
OHNE INBEGR. IMEHRWERT.
WITH I
TAXES I TAXES 1 COMPRISES!
4.38 4.69 5.57
6.42 7.44 8.24 8.88 8.78
9.85 12.26 11.50 11.44 13.17
12.67 9.55 9.02 8.50 11.00
11.67 12.88 11.49 11.20 10.49 10.50 10.51
0.1 1.3 2.5 1.1
2.24 2.50 3.18
3.41 3.76 3.88 4.52 4.78
5.98 7.14 8.17 8.61 9.11
9.60 7.39 7.23 6.92 7.94
9.53 9.96 9.70 9.7S 9.38 94% 9.84
4.9 5.3 0.9 5.5
VAT EXC. HORS TVA
4.37 4.47 5.31
6.12 7.07 7.85 8.46 8.36
9.38 11.67 10.96 10.79 12.42
11.96 9.01 8.51 8.02 10.37
11.01 12.15 10.84 10.57 9.90 9.90 9.91
2.16 2.40 3.05
3.27 3.63 3.73 3.63 4.35
5.07 6.05 6.92 7.24 7.6.3
8.06 6.15 6.(3 5. β* 6.7®
ε.©4
β41 8.19β. ει
um
@.©3 S.3S
OHNE Ι
STEUERN Ι TAXES Ι
EXC. |
HORS Ι
TAXES Ι
4.37 Ι 4.47 Ι 5.31 Ι
6.12 Ι 7.07 | 7.85 | 8.46 Ι 8.36 Ι
9.38 Ι 11.67 Ι 10.96 ! 10.79 1 12.42 Ι
11.96 Ι 9.01 Ι 8.51 ! 8.02 Ι 10.37 Ι
11.01 Ι 12.15 Ι 10.84 | 10.57 Ι 9.90 Ι 9.90 Ι 9.91 Ι
2.16 Ι 2.40 ι 3.05 Ι
|
3.27 Ι
3.63 II
3.72 Ι 3.82 1
4.Φ4 II
5. i? || 6. as 11 6.92 E 7.23 li 7.65 !
1
B-m li
615 il
6. næ II 5®% 1
6.69 !l
II 7 . 9 6 II β. E» S β. ra 11 7.69 t 7.72 ij 7.76 1
βl» II
. ί
I!
NAIUH15A5 NATURAL GAS GAZ NATUREL
l: JANUAR JANUARY JANVIER 2: JULI
JULY JUILLET
PORTUGAL
LISBOA
ESC
y. y. y.
(1)
y. 94 0 80 0 85 0 90
UNITED KINGD.
LONDON
UKL
y. y. y.
y. 94
0 80 0 85 0 90
1973-1 1974-1 1975-1
1976-1 1977-1 1978-1 1979-1 1980-1
1981-1 1982-1 1983-1 1984-1 1985-1
1986-1 1987-1 1988-1 1989-1 1990-1
1991-1 -2 1992-1 -2 1993-1 -2 1994-1 -2
-1/93-1 -1 94-1 -1 94-1 -1 94-1
1973-1 1974-1 1975-1
1976-1 1977-1 1978-1 1979-1 1980-1
1981-1 1982-1 1983-1 1984-1 1985-1
1986-1 1987-1 1988-1 1989-1 1990-1
1991-1 -2 1992-1 -2 1993-1 -2 1994-1 -2
-1/93-1 -1 94-1 -1 94-1 -1 94-1
HAUSHALTSVERBRAUCHER: 16 74 GJ/JAHR HOUSEHOLD CONSUMER: 16.74 GJ/YEAR CONSOMMATEURS DOMESTIQUES
NATIONALE WAEHRUNG
NATIONAL CURRENCY 1 MONNAIE NATIONALE 1
STEUERN INBEGR.
WITH TAXES TAXES COMPRISES
*
369.71
494.84 540.34 710.98 938.49 1393.50
1467.60 1308.30 1393.50 1507.30 1677.90
1848.60 2107.50 2108.00 2264.00 2264.00 2411.00 2411.00
6.5 14.3 6.3 9.5
1.58 1.72 1.96
2.17 2.36 2.65 2.65 2.85
3.77 4.49 5.54 5.70 5.70
5.87 5.73 5.42 5.73 5.85
6.44 6.60 6.60 6.43 1 6.30 1 6.30 1 6.30
1 0.0
1 5.8
1 î.i
1 1.9 OHNE MEHRWERT.
VAT EXC. HORS
TVA
.
•
369.71
494.84 540.34 710.98 938.49 1393.50
1358.90 1211.40 1290.30 1395.60 1553.60
1711.60 1951.40 1951.00 1951.00 1951.00 2296.00 2296.00
1.58 1.72 1.96
2.17 2.36 2.65 2.65 2.85
3.77 4.49 5.54 5.70 5.70
5.87 5.73 5.42 5.73 5.85
6.44 6.60 6.60 6.43 6.30 6.30 6.30
OHNE ] STEUERN I
TAXES EXC. HORS TAXES 1
]
•
369.71
494.84 540.34 710.98 938.49 1393.50
1358.90 1211.40 1290.30 1395.60 1553.60
1711.60 1951.40 1951.00 1951.00 1951.00 2296.00 2296.00
1.58 1.72 1.96
2.17 2.36 2.65 2.65 2.85
3.77 4.49 5.54 5.70 5.70
5.87 5.73 5.42 5.73 5.85
6.44 6.60 6.60 6.43 6.30 6.30 6.30
KKS
STEUERN 1
16.74 GJ/AN
PPS
OHNE INBEGR. IMEHRWERT.
WITH 1 TAXES 1 TAXES 1 COMPRISES!
.
•
"
10.27
12.85 12.60 13.97 15.64 19.96
18.03 14.82 14.84 . 15.15 15.03
15.83 18.04 16.86 18.11 16.38 17.45 15.98
-2.5 3.2 -2.4 1.5
3.69 4.14 4.21
4.42 4.57 4.95 4.74 4.73
6.16 7.38 9.13 9.48 9.39
9.67 9.20 8.55 8.87 8.90
9.54 9.78 9.91 9.65 9.17 9.17. 9.04
1 -1.4 1 4.7
-0.4 1 0.4
VAT EXC. HORS
TVA
.
•
*
10.27
12.85 12.60 13.97 15.64 19.96
16.69 13.72 13.74 14.03 13.92
14.65 16.71 15.61 15.61 14.12 16.61 15.22
3.89 4.14 4.21
4.42 4.57 4.95 4.74 4.73
6.16 7.38 9.13 9.48 9.39
9.67 9.20 8.55 8.87 8.90
9.54 9.78 9.91 9.65 9.17 9.17 9.04
SPA
OHNE STEUERN
TAXES EXC. HORS TAXES
•
•
10.27
12.85 12.60 13.97 15.64 19.96
16.69 13.72 13.74 14.03 13.92
14.65 16.71 15.61 15.61 14.12 16.61 15.22
3.89 4.14 4.21
4.42 4.57 4.95 4.74 4.73
6.16 7.38 9.13 9.48 9.39
9.67 9.20 8.55 8.87 8.90
9.54 9.78 9.91 9.65 9.17 9.17 9.04
#
STEUERN INBEGR.
WITH TAXES TAXES COMPRISES
.
-"
5.97
7.16 7.62 7.92 8.59 11.53
10.44 8.26 8.25 8.82 9.36
10.13 11.88 11.93 13.09 12.85 12.66 12.29
-4.3 5.3 0.7 7.0
3.37 3.40 3.64
3.78 3.61 4.18 3.91 4.47
7.05 7.94 9.08 9.99 9.16
9.38 7.76 7.81 8.94 8.03
9.18 9.47 9.24 9.00 7.97 8.29 1 8.44
6.0
1 4.6
-0.9 1 1.2
PREISE PRO GJ (HO) PRICES PER GJ (GCV) PRIX PAR GJ (PCS)
ECUS
OHNE MEHRWERT.
VAT EXC. HORS
TVA
.
•
'
5.97
7.16 7.62 7.92 8.59 11.53
9.67 7.64 7.64 8.17 8.66
9.38 11.00 11.05 11.28 11.07 12.06 11.70
3.37 3.40 3.64
3.78 3.61 4.18 3.91 4.47
7.05 7.94 9.08 9.99 9.16
9.38 7.76 7.81 8.94 8.03
9.18 9.47 9.24 9.00 7.97 8.29 8.44
OHNE ! STEUERN !
TAXES 1
EXC. 1
HORS 1
TAXES 1
|
•
* '
5.97 1
7.16 1 7.62 1 7.92 1 8.59 1 11.53 1
9.67 1 7.64 1 7.64 1 8.17 1 8.66 1
9.38 1 11.00 1 11.05 1 11.28 ! 11.07 1 12.06 1 11.70 1
3.37 1 3.40 1 3.64 1
3.78 1 3.61 1 4.18 1 3.91 1 4.47 1
7.05 1 7.94 1 9.08 1 9.99 1 9.16 1
9.36 1 7.76 1 7.61 1 8.94 1 8.03 1
9.18 1 9.47 1 9.24 1 9.00 ! 7.97 1 8.29 1 8.44 1
NATURGAS NATURAL GAS GAZ NATUREL
i: JANUAR JANUARY JANVIER
Ζ· JULI JULY JUILLET
BELGIQUE
BRUXELLES
BFR
y. 94 X 0 80 X 0 85 X 0 90
DANMARK (1)
KOEBENHAVN
DKR
y. 94 X 0 80 X 0 85 X 0 90
19731 19741 19751
19761 19771 19781 19791 19801
19811 19821 19831 19841 19851
19861 19871 19881 19891 19901
19911 2 19921 2 19931 2 19941 2
1/931 1 941 1 941 1 941
19731 19741 19751
19761 19771 19781 19791 19801
19811 19821 19831 19841 19851
19861 19871 19881 19891 19901
19911 2 19921 2 19931 2 19941 2
1/931 1 941 1 941 1 941
pAUSHALTSVERBRAUCHER: 125 HOUSEHOLD CONSUMER: 125. CONSOMMATEURS DOMESTIQUES:
NATIONALE WAEHRUNG NATIONAL CURRENCY
MONNAIE NATIONALE !
STEUERN 1 OHNE
INBEGR. IMEHRWERT.
WITH I
TAXES I TAXES I COMPRISES I
102.8 111.4 130.3
141.0 157.0 161.0 163.0 188.0
251.5 345.7 386.7 421.3 450.7
431.0 298.6 292.5 278.6 309.5
330.2 327.0 318.7 313.6 309.6 308.7 331.1
6.9 4.1 3.4 1.7
15.34 16.61 31.26
32.07 41.35 45.15 54.83 86.86
106.05 114.72 134.27 130.15 118.47
118.93 95.34 106.49 118.00 149.03
238.16 218.13
1 240.58
237.26 [ 159.20
164.34 I 147.84
I
1 7.1
3.9
1 25
\ 0 . 2
VAT EXC. HORS TVA
97.0 105.2 122.9
133.0 148.0 152.0 153.8 177.4
216.8 295.5 330.5 360.1 385.3
368.4 255.2 250.0 238.1 264.6
282.2 279.5 272.4 262.4 259.1 258.4 274.8
13.34 14.44 27.17
29.35 35.96 38.25 45.60 72.23
86.92 94.02 110.06 106.68 97.11
97.48 78.15 87.29 96.72 122.16
195.21 178.79 192.46 189.81 127.36 131.47 118.27
OHNE STEUERN
TAXES EXC. HORS TAXES
97.0 105.2 122.9
133.0 148.0 152.0 153.8 177.4
216.8 295.5 330.5 360.1 385.3
368.4 255.2 250.0 238.1 264.6
282.2 279.5 272.4 262.4 259.1 258.4 261.1
13.34 14.44 27.17
29.35 35.96 38.25 45.60 60.29
77.36 84.47 100.50 106.68 97.11
97.48 73.15 87.29 96.72 122.16
195.21 178.79 192.46 189.81 127.36 131.47 118.27 •
KKS
STEUERN 1
.6 GJ/JAHR 6 GJ/YEAR
125.6 GJ/AN
PPS
OHNE INBEGR. ¡MEHRWERT.
WITH ¡
TAXES I TAXES I COMPRISES!
1.86 2.02 2.39
2.63 2.95 3.11 3.30 4.06
5.71 7.93 8.84 9.67 10.21
9.71 6.73 6.75 6.46 7.29
7.94 7.86 7.80 7.67 7.38 7.36 8.12
10.1 5.1 2.5 2.7
1.55 1.67 3.16
3.26 4.16 4.44 5.49 8.91
10.85 11.51 13.15 12.75 11.65
11.55 9.05 10.19 11.39 14.67
24.43 22.37 24.33 23.99 16.48 17.01 16.05
r*
2.6 4.3 3.6 2.3
VAT EXC. HORS TVA
1.76 1.91 2.25
2.48 2.78 2.94 3.12 3.84
4.92 6.78 7.55 8.26 6.73
8.30 5.75 5.77 5.52 6.23
6.78 6.72 6.67 6.42 6.17 6.16 6.74
1.35 1.45 2.75
2.98 3.61 3.76 4.56 7.41
8.90 9.43 10.78 10.45 9.55
9.46 7.42 6.35 9.34 12.02
20.02 18.34 19.46 19.19 13.18 13.61 12.84 •
SPA
OHNE STEUERN
TAXES EXC. HORS TAXES
1.76 1.91 2.25
2.48 2.78 2.94 3.12 3.84
4.92 6.78 7.55 8.26 6.73
8.30 5.75 5.77 5.52 6.23
6.78 6.72 6.67 6.42 6.17 6.16 6.40
1.35 1.45 2.75
2.98 3.61 3.76 4.56 6.18
7.92 8.47 9.84 10.45 9.55
9.46 7.42 8.35 9.34 12.02
20.02 18.34 19.46 19.19 13.18 13.61 12.84
STEUERN 1
PREISE PRO GJ (HO) PRICES PER GJ (GCV) PRIX PAR GJ (PCS)
ECUS
OHNE INBEGR. (MEHRWERT.
WITH I
TAXES I TAXES ¡ COMPRISES!
2.11 2.31 2.89
3.08 3.82 4.00 4.12 4.65
6.06 8.31 8.58 9.15 10.12
9.68 6.97 6.77 6.38 7.26
7.82 7.73 7.59 7.45 7.68 7.66 8.20
6.8 4.1 2.3 3.1
2.02 2.22 4.38
4.47 6.26 6.38 7.87 11.18
13.36 14.36 16.60 15.92 14.91
14.90 12.18 13.43 14.62 18.90
30.19 27.46 30.39 30.18 21.07 21.75 19.60 •
7.0 4.1 3.1 0.9
VAT EXC. HORS TVA
1.99 2.18 2.72
2.91 3.60 3.78 3.89 4.39
5.23 7.10 7.34 7.82 8.65
8.28 5.95 5.79 5.45 6.21
6.69 6.61 6.49 6.24 6.43 6.41 6.81
1.76 1.93 3.80
4.09 5.45 5.41 6.55 9.29
10.95 11.77 13.61 13.05 12.22
12.21 9.98 11.01 11.99 15.49
24.75 22.51 24.31 24.14 16.86 17.40 15.68
OHNE 1
STEUERN 1 TAXES i
EXC. 1
HORS I
TAXES I
1.99 1 2.18 ! 2.72 1
2.91 1 3.60 1 3.78 1 3.89 ¡ 4.39 I
5.23 1 7.10 1 7.34 1 7.82 1 8.65 1
8.26 1 5.95 1 5.79 ! 5.45 1 6.21 1
6.69 1 6.61 1 6.49 1 6.24 1 6.43 1 6.41 1 6.47 1
1.76 1 1.93 1 3.80 1
4.09 1 5.45 1 5.41 1 6.55 ¡ 7.76 1
9.74 I 10.57 J 12.43 I 13.05 I 12.22 1
12.21 1 9.98 I 11.01 ¡ 11.99 I 15.49 1
24.75 I 22.51 1 24.31 1 24.14 i 16.86 I 17.40 I 15.68 1
NATURGAS NATURAL GAS GAZ NATUREL
HAUSHALTSVERBRAUCHER: 125.6 GJ/JAHR HOUSEHOLD CONSUMER: 125.6 GJ/YEAR CONSOMMATEURS DOMESTIQUES: 125.6 GJ/AN
PREISE PRO GJ (HO PRICES PER GJ (GCV PRIX PAR GJ (PCS
NATIONALE WAEHRUNG NATIONAL CURRENCY
MONNAIE NATIONALE KKS PPS SPA ECUS
l: JANUAR JANUARY JANVIER 2: JULI
JULY JUILLET
STEUERN I OHNE INBEGR. IMEHRWERT.
WITH I VAT TAXES I EXC. TAXES I HORS COMPRISES! TVA
OHNE STEUERN
TAXES EXC. HORS TAXES
STEUERN I OHNE INBEGR. IMEHRWERT.
WITH I VAT TAXES I EXC. TAXES I HORS COMPRISES| TVA
OHNE STEUERN
TAXES EXC. HORS TAXES
STEUERN I OHNE INBEGR. IMEHRWERT.
WITH I VAT TAXES ! EXC. TAXES I HORS COMPRISES! TVA
OHNE STEUERN
TAXES EXC. HORS TAXES
DEUTSCHLAND
DUESSELDORF
DM
1973-1 1974-1 1975-1
1976-1 1977-1 1978-1 1979-1 1980-1
1981-1 1982-1 1983-1 1984-1 1985-1
1986-1 1987-1 1988-1 1989-1 1990-1
1991-1 -2 1992-1 -2 1993-1 -2 1994-1 -2
7.43 8.18 9.23
12.62
12.62
12.73
12.73
12.65
17.14
21.97
20.24
21.52
21.52
13.33
13.33
13.38
15.12
15.64
17.89
17.89
17.90
17.40
16.84
16.75
6.69
7.37
8.32
11.37
11.37
11.37
11.37
11.37
15.17
19.44
17.75
18.88
18.88
11.69
11.69
11.74
13.27
13.72
15.69
15.69
15.70
15.13
14.65
14.57
6.69
7.37
8.32
11.37
11.37
11.37
11.37
11.37
15.17
19.44
17.75
18.88
18.88
11.69
11.69
11.02
12.55
13.00
14.69
14.69
14.70
14.13
13.65
13.57
1.83 2.11 2.56
3.68 3.85 4.00 4.23 4.51
6.32 8.42
8.16 8.93
8.93 5.55 5.70 5.87 6.72
7.05 8.06 8.02 8.03 7.63 7.39 7.44
1.64 1.90 2.30
3.31 3.47 3.58 3.78 3.99
5.60 7.45
7.16 7.83
7.83 4.87 5.00 5.15 5.90
6.18 7.07 7.04 7.04 6.64 6.43 6.48
1.64 1.90 2.30
3.31 3.47 3.58 3.78 3.99
5.60 7.45
7.83 4.87 5.00 4.83 5.58
5.86 6.62 6.59 6.59 6.20 5.99 6.03
2.10 2.59 3.07
4.16 4.71 4.91 5.07 5.16
6.64 8.99
8.96 9.68
9.88 6.46 6.45 6.42 7.43
7.63 8.71 8.77 8.76 8.89 8.63 8.67
1.90 2.33 2.76
3.75 4.24 4.38 4.53 4.57
88 95
7.86 8.49
8.67 5.66 5.66 5.63 6.52
6.70 7.64 7.69 7.69 7.73 7.51 7.54
1.90 2.33 2.76
3.75 4.24 4.38 4.53 4.57
5.88 7.95
7.86 8.49
8.67 5.66 5.66 5.29 6.17
6.35 7.15 7.20 7.20 7.22 7.00 7.03
X 94-1/93-1
·/. 0
80-1 94-1
X 0 85-1 94-1 X 0 90-1 94-1
-3.7 1.9 -2.7 2.6
-2.5 3.6 -2.0 2.6
-2.4 3.8 -1.2 3.9
ELLAS (1)
DR
1973-1 1974-1 1975-1
1976-1 1977-1 1978-1 1979-1 1980-1
1981-1 1982-1 1983-1 1984-1 1985-1
1986-1 1987-1 1988-1 1989-1 1990-1
1991-1 -2 1992-1 -2
Χ 94-1/93-1
Χ 0 60-1 94-1 Χ 0 85-1 94-1
Κ 0 90-1 94-1