Statistics
in focus
INDUSTRY, TRADE
AND SERVICES
THEME 4 - 7 / 1 9 9 9
Contents
1.7 million persons employed. 3.9
persons
employed
per road
haulage enterprise in the EU —
26% self-employed
2
1.3 million employees in the EU
road haulage sector
3
140 billion ECU turnover in the
EU road haulage sector
4
66 billion ECU wealth created.
Labour productivity and value
added
per
employed
much
higher.
Personnel
costs 15%
lower
5
440 thousand EU road haulage
enterprises
6
* * *
*
*
*
*
*
*
* * *
eure
»stat
Jf
Manuscript completed on: 15.02.1999 Catalogue number: CA-NP-99-007-EN-C Price in Luxembourg per single copy (excl. VAT): EUR 6Transport Business
Statistics
440 thousand road haulage enterprises in the EU
employ 1.7 million persons and
contribute a 'value added' of 66 billion ECU
Road freight transport plays a dominant role in freight transport in Europe.
'Freight transport by road' is a profitable part of the transport sector. It comprises
road freight transport and road haulage. Other transport sectors are railways,
water, air, and 'supporting and auxiliary activities'
When comparing the road haulage sector with the transport sector as a whole,
we can draw the following conclusions:
•
Road freight transport enterprises have fewer persons employed per
enterprise.
•
The share of self-employed is 26%, compared to 10% for the transport
sector.
•
The turnover per person employed is much lower.
•
The labour productivity (the value added at factor cost / personnel costs) is
much higher.
I
Persons employed /enterprise I
Value added (atfactor cost) /Personnel costs I
Ratio employees/employed I
Personnel costs /employee (10 000 ECU) I
Γ
Λ
Value added / person employed (10 000 ECU)
Turnover/person employed (10 000 ECU) I
□ Freight transport by road
■ Transport sector
2
4
6
8 10 12 14
Figure I : Main road haulage indicators compared to the transport sector as a whole
1.7 million persons employed in the EU. 3.9 persons employed per road haulage
enterprise in the EU — 39% lower than in the transport sector. 26% self-employed
In 1995 the European Single Market
numbered more than 142 million
persons occupied, 94 million of them
in market and non-market services.
Market services alone gave work to
almost 65 million people in the EU in
1995. Transport services employed
6.5
million
persons. The
road
haulage enterprises
in the
EU
employed 1.7 million persons *.
The average number of employed
per enterprise for the EU road
haulage sector is 3.9 persons, 39%
lower than the average in the
transport sector.
We find that the large Spanish
enterprise population is made up of
comparatively small companies. The
average
number
of
persons
employed per haulage enterprise in
Spain is equal to 1.8 persons, the
lowest number among all Member
States.
This may be compared with the
French and German
averages,
which are 7.4 and 7.7 persons per
enterprise respectively. France and
Germany are the two Member
States with the highest number of
persons employed in this sector.
The EU average is 3.9 persons. At
the top of the ranking there are two
Member States with more than 10
persons
per enterprise on average, the
Netherlands and Luxembourg. The
'central' location in the internal
market may explain this.
EU-15 EUR-11 Β DK D EL E F IRL I L NL A
Ρ FIN
S
UK
Year
1995 1993 1996
1993 1994 1996 1995 1995 1993 1995
1995 1994
Number of persons employed (thousands)
Average number of employed per enterprise
Ratio employees/ employed
Freight transport by road
1 700 1 400 50 35 268
241 262 9 269 4 106 35
28
3.9 3.9
3.6 7.7
1.8 7.4 4.0 2.4 10.8 13.2 7.3
2.5
0.74 0.67 0.87 0.64 0.88
0.47 0.90 0.72 0.50 0.91 0.83 0.91
0.77
Average number of employed per enterprise
in 1995
Transport sector
6.4 6.7 6.7 4.2 8.8 2.1 3.7 8.8
[image:2.595.38.580.49.778.2]6.6 15.7 13.2 12.1 7.1 3.8
Table 1: Average number of employed per enterprise and the share of the
number of employees in the total number of persons employed
We conclude that road haulage
companies, at EU level, are 39%
smaller
in number of persons
employed, than in the transport
sector as a whole.
This can be explained by the high
number of self-employed (26% in
the EU) within this sector.
The share of self-employed persons
is lowest
in
Luxembourg
and
Austria. On the other hand for Spain
and Italy, the shares are high.
14
12
10
8
6
4
2
0
(employed / enterprise) O NL
O L
DK
o
o
EUR-11IRL o O' EU-15
FIN
D* * Φ A F
(employees / employed)
0.45 0.55 0.65 0.75 0.85 0.95
For Spain, employees account for
only 47% of the total number of
persons employed. In other words,
there is a large degree (53%) of
self-employed in this sector. In Italy the
share is 50%. In both counties the
average number of employed per
enterprise is very low. There is
however one country, Finland, with
a low average of persons employed
per enterprise, but with a lower
share of self-employed (23%).
In the Netherlands the share of
self-employed is 33% smaller than the
EU average, but the number of
persons employed per enterprise is
nearly four times bigger. This could
be explained by a large number of
part-timers.
Figure 2: Relationship between average number of persons employed per enterprise
and the share of the number of employees in the total number of persons employed
* These 1.7 million persons employed in the road haulage sector only relate to hire and reward transport. Own account, which employs approximately 1 million persons, is not included.
[image:2.595.69.558.60.396.2]In the EU there are 1.3 million employees in the road haulage sector,
74% of them within the euro-zone.
Within the EU there are 1.3 million
employees in the road haulage
sector. This represents 28% of the
workforce in the transport sector or
1.0% of the whole workforce. In
addition to these 1.3 million
employees, there are 400 thousand
self-employed in this sector.
Two Member States, France and
Germany, are noteworthy in number
of employees reporting 235
thousand each. These two counties
together with Italy, which is the third
with 133 thousand, account for
nearly half the workforce within this
sector.
EU-15
EUR-11
Β
DK
D
EL
E
F
IRL
I
L
NL
A
Ρ
FIN
S
UK
Year
1995
1993
1996
1993
1994
1996
1995
1995
1995
1995
1995
1994
Number of
employees
(thousands)
Freight
transport
by road
1
300
940
44
23
235
114
235
7
133
4
88
32
22
42
%of
Transport
sector
28%
28%
38%
45%
28%
30%
22%
35%
36%
20%
32%
31%
% of All
economic
sectors
1.0%
1.0%
1.4%
1.0%
0.7%
1.3%
1.2%
0.7%
0.9%
2.5%
1.5%
1.0%
[image:3.595.26.549.45.774.2]1.3%
1.2%
Table 2: Number of employees for the road hauage sector.
About 28% of the employees in the
transport sector work with road
haulage. The country where this
sector has the largest importance is
Denmark with 45% of the transport
employees. Next is Belgium with
38% followed by the Netherlands
with 36%.
In Austria, only 20% of the transport
employees work in this sector. This
could be explained by a relatively
high number of employees in
passenger transport.
Figure 4: Number of employees for the
road haulage sector
-
share of the
whole transport sector
About 1.0% of the total workforce
are employees in the road haulage
sector. Here the largest importance
among individual Member States
occurs in Luxembourg, with 2.5%
road haulage employees among the
total workforce. In Germany and
Ireland, only 0.7% of all the
employees work in the road-hauling
sector.
Figure 3: Number of employees for. the road haulage sector
m
eurostat
140 billion ECU of turnover in the road haulage sector in the EU, 79% of it within the
euro-zone. Turnover per person employed 82 thousand ECU, 34% lower than in the
transport sector as a whole.
EU-15 EUR-11 Β DK D EL E F IRL I L NL A Ρ FIN S UK
Year
1995 1993 1996
1994 1996 1995 1995 1995 1995
1995 1995 1996
Turnover (million ECU)
Share of tranport sector
Turnover per person employed (1000 ECU)
Freight transport by road
140 000 110 000 6 346 2 856 21 439
21 022 647 21 913 421 7 458 3 141
2 537 5 499 20 612
30% 29% 28% 26%
27%
33% 35% 32% 19%
27% 24% 37%
82 81 126 81 80
80 68 82 107 70 90
90
Turnover per person employed (1000
ECU)
Transpor! in 1995
t sector
125 125 179 164
62
91
[image:4.595.30.553.76.829.2]82 110 87 96 60 116
Table 3: Turnover in the 'Freight transport by road' sector
IRL NL D F DK EUR-11 I EU-15 FIN A L B
JWKlilrfWHilllinWBlliWÍilUri
Ui MW IHi MMIWWMIWl
HBWtBi'HJìl'll1! ι »gg*«!·
mm
■ M M
■η
50
100
150IRL FIN DK
b
ρ
ρ
Β NL UK
Insu·«
mmmmmmmmmmm
M R
M I I « ■■■
o
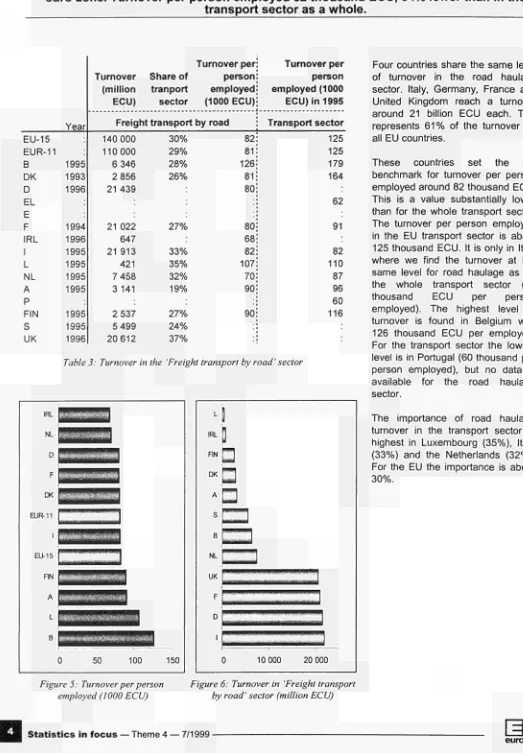
10 000 20 000Figure 5: Turnover per person
employed (1000 ECU)
Figure 6: Turnover in 'Freight transport
by road' sector (million ECU)
Four countries share the same level
of turnover in the road haulage
sector. Italy, Germany, France and
United Kingdom reach a turnover
around 21 billion ECU each. This
represents 6 1 % of the turnover for
all EU countries.
These
countries
set
the
EU
benchmark for turnover per person
employed around 82 thousand ECU.
This is a value substantially lower
than for the whole transport sector.
The turnover per person employed
in the EU transport sector is about
125 thousand ECU. It is only in Italy
where we find the turnover at the
same level for road haulage as for
the whole transport sector (82
thousand
ECU
per
person
employed). The highest level of
turnover is found in Belgium with
126 thousand ECU per employed.
For the transport sector the lowest
level is in Portugal (60 thousand per
person employed), but no data is
available for the road haulage
sector.
The importance of road haulage
turnover in the transport sector is
highest in Luxembourg (35%), Italy
(33%) and the Netherlands (32%).
For the EU the importance is about
30%.
Wealth created by EU road haulage enterprises: 66 billion ECU.
Labour productivity and value added per employed much higher than in the transport
sector. Personnel costs 15% lower than in the transport sector as a whole.
■
EU-15 EUR-11 Β DK D EL E F IRL I L NL A Ρ FIN S UK
Year
1995 1993
1993 1994 1996 1995 1995 1995 1995
1995 1995 1996
Value added at factor cost [million ECU]
66 000 49 000 2 438 1691
6 600 8 445 234 7 135 153 4 084 1 566
1 275 2 087 8 901
Personnel costs [million ECU]
(Value added at factor cost) / (Personnel
Value added at factor cost per person employed
Personnel costs per employee costs) (1000 ECU) (1000 ECU)
Freight transport by road
34 000 25 000 1 622 721
2 487 5918
3 200 105 2 842 913
601 1 291 5 193
1.94 1.98 1.50 2.34
2.65 1.43
2.23 1.46 1.44 1.72
2.12 1.62 1.71
39 35 49 48
27 32 25 27 39 38 45
45
27 26 37 32
22 25
24 29 32 29
28 31
Personnel costs per employee (1000 ECU) in 1995
Transport
sector
31 31 42 36
33
30 36 32 32 16 31 30
Table 4: Value added at factor cost and personnel costs for road-hauling sector
Note: For Denmark, France and UK the Value added is measured at basic prises.
[image:5.595.34.548.54.842.2]0 10 20 30 40 50
a Freight transport by road
H Transport sector
Figure 7: Personnel costs per
employee (1000 ECU)
Figure 8: Labour productivity:
(Value added at factor cost) /
(Personnel costs)
The wealth, measured by the value
added at factor cost, created by EU
road haulage enterprises amounts
to 66 billion ECU. The highest
values, where data available, occur
in the United Kingdom and France
with 8.9 and 8.4 billion ECU
respectively.
Where
data
is
available,
the
personnel costs are the highest in
France (5.9 billion ECU) and the
United Kingdom (5.2 billion ECU).
One
way
to
measure
labour
productivity is to divide the value
added by the personnel costs. In
Spain,
this
kind
of
labour
productivity is the highest with a
factor of 2.65, next is Denmark with
2.34 followed by Italy with 2.23. The
labour productivity factor for the EU
road haulage sector is 1.94, which is
much higher than in the EU
transport sector, where the factor is
merely
1.31. Among
the
EU
countries, that are able to provide
data, France has the 'lowest' labour
productivity of 1.44. This value is still
higher than the labour productivity
for the whole EU transport sector.
Another
way
of
measuring
productivity is to measure value
added per person employed. At the
EU level road haulage sector has a
higher productivity than the whole
transport
sector
(39
thousand
compared to 35 thousand per
employed).
The personnel costs per employee
is at the EU level 15% lower for the
road haulage sector than in the
transport sector. This could be
explained by higher skill levels,
more
restricted
markets
or
monopoly
suppliers
in
other
transport sectors, especially in the
air and water transport sectors.
sa
eurostat
[image:5.595.30.553.60.455.2] [image:5.595.32.555.431.822.2]There are approximately 440 thousand road haulage enterprises
active in the EU, 82% of them within the euro-zone.
There are approximately 440 thousand road haulage
enterprises active in the EU, 82% of them within the
euro-zone.
The Member State with the highest number of
enterprises in the road haulage sector is Spain with 133
thousand followed by Italy with 110 thousand. The
other three major countries, UK, France and Germany
report that the numbers of enterprises in this sector are
below 40 thousand each.
EU-15
EUR-11
Β
DK
D
EL
E
F
IRL
I
L
NL
A
Ρ
FIN
S
UK
Year
1993
1996
1993
1994
1996
1995
1995
1995
1996
1995
1994
1996
Number of Share of
enterprises transport
(units)
440 000
360 000
9
772
34 843
132 870
35 374
2
375
109
874
366
8
042
4
785
11 099
17 329
39 053
sector
59%
72%
52%
40%
40%
53%
[image:6.595.302.579.70.305.2]59%
Figure 9: Number of enterprises
When analysing the structure we estimate that an
average 63%* of the EU transport enterprises are in the
road haulage business. In other words, there are more
road haulage enterprises than in the 'Water transport',
'Air transport' and 'Supporting and auxiliary transport'
sectors altogether.
[image:6.595.29.308.229.613.2]Where data is available, the Member State with the
highest share is Italy, with 72% road haulage
enterprises in the transport sector. Other countries with
a share bigger than the EU average are Ireland,
Sweden, Spain, United Kingdom and Denmark. The
low share in Austria could be explained by the large
number of passenger transport enterprises. In the
Netherlands there are particularly many water transport
enterprises that can explain the relatively low share.
Table 5: Number of enterprises for road haulage sector
*
The figure 63% is calculated for those countries where data for
both road hauling and transport enterprises are available for the
same year (taking into account IRL, I, L, NL, A, FIN and UK firms,
40% of all EU transport enterprises).
> E S S E N T I A L I N F O R M A T I O N - M E T H O D O L O G I A L NOTES
• ■ • • • • • • • ■ • • • • • • « • • ■ • • • ■ ■ • • • • • • • • • • ■ • • • • • • • ■ ■ • • a · · · Freight transport by road Self-employed person Value added at basic prices
This is a sector in the NACE Rev. 1 - the statistical classification of economic activities. It is at 4—digit level. The hierarchy to get down to this level is as follows: Section I 'Transport', Division 60 'Land transport; transport via pipelines', 60.2 'Other land transport' and finally 60.24 'Freight transport by road'. This class includes: freight transport operation by road, logging haulage, stock haulage, refrigerated haulage, heavy haulage, bulk haulage, including haulage in tanker trucks, haulage of automobiles, furniture removal, renting of trucks with drive, freight transport by man or animal-drawn vehicles. This class excludes operation of terminal facilities for handling freight.
Number of enterprises
A count of the non-dormant number of enterprises registered to the population concerned in the business statistics register. It should be noted that the recommendations on business registers only requires enterprises to be included in the business register for statistical purposes if they employ at least 0.5 persons measured in full-time equivalents per year. This variable refers to all enterprises producing either a market or non-market output. There can be no discrimination on the basis of size. The small enterprises, even those without paid employees, must be taken into account. Since it has a full accounting system, the enterprise is the unit best able to supply all the necessary data for establishing value added and gross operating surplus.
Number of employees
This heading is defined as a count of the number of employees. Employees are defined as all persons who, by agreement, work for another resident institutional unit and receive remuneration.
Self-employed persons are defined as persons who are the sole owners, or joint owners, of the unincorporated enterprise in which they work. Self-employed persons are classified here if they are not also paid employment which constitutes their principal activity: in that latter case they are classified under employees.
Number of persons employed
This covers all persons - both employed and self-employed - engaged in some productive activity that falls within the production boundary of the system.
Turnover
Turnover comprises the totals invoiced by the observation unit during the reference period, and this corresponds to market sales of goods or services supplied to third parties. These sales may be included in accounts under the headings "Net turnover" or "Other operating income". The elements accounted for as "Other operating income" which should be considered here as turnover include income from concessions, patents, trademarks and similar values. Turnover includes all duties and taxes on goods and services invoiced by the unit with the exception of VAT invoiced by the unit vis-à-vis its customer and other taxes directly linked to turnover. It also includes all other charges (transport, packaging, etc.) passed on to the customer, even if these charges are listed separately in the invoice.
Value added at basic prices is calculated as follows: Turnover - Purchases of goods and services +/- Change in stocks of goods and services + Capitalised production + Operating subsidies linked to products.
Value added at factor cost
Value added at factor cost is calculated as follows: Value added at basic prices + Operating subsidies linked to production -Duties and taxes linked to production (other than VAT and other taxes directly linked to turnover) linked to production.
Personnel costs
Personnel costs are defined as the total remuneration, in cash or in kind, payable by an employer to an employee (regular and temporary employees as well as home workers) in return for work done by the latter during the reference period. Personnel costs also include taxes and employees' social security contributions retained by the unit as well as the employer's compulsory and voluntary social contributions.
Personnel costs can be calculated as follows: Wages and salaries + Social security costs
Estimations
All EU-15 and EUR-11 figures are estimated, by using weighted structures of available data.
Further information:
V Data bases
Title
New Cronos Domain: DAISIETo obtain information or to order publications, data bases and special sets of data, please contact the Data Shop network:
B E L G I Q U E / B E L G I Ë D A N M A R K D E U T S C H L A N D E S P A N A F R A N C E I T A L I A - R o m a Eurostat Data Shop
BruxclleslBrussel Chaussee d'Etterbeek 13 Etterbeeksesteenweg 13 B-1049 BRUXELLES /BRUSSEL Tel. (32-2) 299 66 66 Fax (32-2) 295 01 25 E-Mail:
datashop.bnjssels@eurostatcec.be
DANMARKS STATISTIK Bibliotek og Information Eurostat Data Shop Sejrøgade 11 DK-2100 KØBENHAVN 0 Tel. (45-39) 17 30 30 Fax (45-39) 17 30 03 E-Mail: bib@dsLdk
STATISTISCHES BUNDESAMT Eurostat Data Shop Berlin Otto-Braun-Straße 70-72 O-10178 BERLIN Tel. (49-30) 23 24 64 27/28 Fax (49-30) 23 24 64 30 E-Mal:
stba- berlin, datashop@t-onllne.de
INE Eurostat Data Shop Paseo de la Castellana, 183 Oficina 009
Entrada por Estèbanez Calderón E-28046 MADRID Tel. (34-91) 583 91 67 Fax (34-91 ) 579 71 20 E-Mail: datashop.eurostat@ine.es
INSEE Info Service Eurostat Data Shop 195, rue de Bercy Tour Gamma A F-75582 PARIS CEDEX 12 Tel. (33-1) 5317 88 44 Fax (33-1) 5317 88 22 E-Mail: datashop@insee.fr I T A L I A - M i l a n o L U X E M B O U R G N E D E R L A N D N O R G E P O R T U G A L ISTAT
Centro dl Informazione Statistica -Sede di Milano, Eurostat Data Shop Piazza della Repubblica, 22 1-20124 MILANO Tel. (39-02) 65 95 133/134 Fax (39-02) 65 30 75
Eurostat Data Shop Luxembourg BP 453
L-2014 LUXEMBOURG 4, rue A Weicker L-2721 LUXEMBOURG
Tel. (352) 43 35 22 51
Fax (352) 43 35 22 221 E-Mail: dslux@eurostatdatashop.lu
STATISTICS NETHERLANDS Eurostat Data Shop-Voorburg po box 4000
2270 JM VOORBURG Nederland Tel. (31-70)337 49 00 Fax (31-70) 337 59 84 E-Mail: datashop@cbs.nl
Statistics Norway Library and Information Centre Eurostat Data Shop Kongens gate 6 P. b. 8131, dep. N-0033 OSLO Tel. (47-22) 86 46 43 Fax (47-22) 86 45 04 E-Mail: biblioteket@ssb.no
Eurostat Data Shop Usboa INE/Serviço de Difusão Av. Antonio José de Almeida. 2 P-1000-043 LISBOA Tel. (351-1)842 6100 Fax (351-1) 842 63 64 E-Mail: data.shop@ine.pt
ISTAT
Centra di Informazione Statistica Sede di Roma, Eurostat Data Shop Via Cesare Balbo. 11a 1-00184 ROMA Tel. (39-06) 46 73 31 05/02 Fax (39-06) 46 73 31 07/01 E-Mail: dlpdHT@lstalit
S C H W E I Z / S U I S S E / S V I Z Z E R A Statistisches Amt des Kantoni Zurich, Eurostat Data Shop Bleicherweg 5
CH-8090 Zürich Tel. (41-1)2251212 Fax (41-1) 225 12 99 E-Mail: datashop@zh.ch Internetadresse: http://www.zh.ch/statjstjk S U O M I / F I N L A N D S V E R I G E U N I T E D K I N G D O M U N I T E D K I N G D O M U N I T E D S T A T E S O F A M E R I C A
Eurostat Data Shop, Tilastoklrjasto Postiosoite: PL 2B
FIN-00022 Tilastokeskus Käyntiosoite: Työpajakatu 13 B, 2 krs Helsinki
Tel. (358-9) 17 34 22 21 Fax (358-9) 17 34 22 79
Sposti dalashoptilaslokesku5@ölaslokeskus.fi IntemelaoVessa:
http //wwwulastokeskus riAkAWdalasbop. hl/rt
STATISTICS SWEDEN Information service Eurostat Data Shop Karlavägen 100 Box 24 300 S-104 51 STOCKHOLM Tel. (46-8) 783 48 01 Fax (46-8) 783 48 99 E-Mail: infoservice@scb.se
Eurostat Data Shop Enquiries & advice and publications
Office for National Statistics Customers & Electronic Services Unit 1 Drummond Gate - B1/05 UK-LONDON SW1V2QQ
Tel. (44-171)533 56 76
Fax (44-171) 533 56 88 E-Mail: gloria.ryan@ons.gov.uk
Eurostat Data Shop Electronic Data Extractions, Enquiries & advice · R.CADE Unit 1L Mountjoy Research Centre University of Durham UK-DURHAM OH 13SW Tel: (44-191) 374 7350 Fax: (44-191)3844971 E-Mail: r-cade@dur.ac.uk URL: http://www-rcade.dur.ac.uk
HAVER ANALYTICS Eurostat Data Shop 60 East 42nd Street Suite 3310
USA-NEW YORK, NY 10165 Tel. (1-212) 986 93 00 Fax (1-212) 986 58 57 E-Mail: eurodata@haver.com Media Support Eurostat (for professional journalists only).
Bech Building Office A3/48 ■ L-2920 Luxembourg · Tel. (352) 4301 34567 · Fax (352) 4301 32649 ■ e-mail: media.support@eurostatcec.be
Order form
For information on methodology
August Götzfried, Eurostat/D2, L-2920 Luxembourg tel. (352) 4301 34432, e-mail: august.goetzfried@eurostat.cec.be ORIGINAL: English
Please visit our web site at http://europa.eu.int/eurostat.html for further information!
A list of worldwide sales outlets is available at the Office for Official Publications of the European Communities.
2 rue Mercier - L-2985 Luxembourg BELGIQUE/BELGIË - DANMARK - DEUTSCHLAND - GREECE/ELLADA - ESPAÑA - FRANCE - IRELAND - ITALIA - LUXEMBOURG - NEDERLAND - ÖSTERREICH Tel. (352) 2929 42118 Fax (352) 2929 42709 PORTUGAL - SUOMI/FINLAND - SVERIGE - UNITED KINGDOM - ISLAND - NORGE - SCHWEIZ/SUISSE/SVIZZERA - BALGARIJA - C E S K A REPUBLIKA - CYPRUS Internet Address http://eur-op.eu.lnt/frfgeneral/s-ad.htm EESTI - HRVATSKA - MAGYARORSZAG - MALTA - POLSKA - ROMANIA - RUSSIA - SLOVAKIA - SLOVENIA - TÛRKIYE - AUSTRALIA - CANADA - EGYPT - INDIA _e;mail_info.in(o_@opoce.cec.be_ JSRAß. -JAPAN -_ MALAYSIA - PHILIPPINES : SOUTH KOREA - THAILAND-UNITED STATES OF AMERICA
Q Please send me a free copy of'Eurostat Mini-Guide' ]ca"talõgS containing a selection of Eurostat products and services) Language required: □ DE □ EN D FR
I would like to subscribe to Statistics in focus (from 1.1.1999 to 31.12.1999): α 'w o u l d l i k e a f r e e subscription to 'Statistical References', the information
(for the Data Shop and sales office addresses see above) ¡etter o n E u r o s t a t Pr o dil (£a n d *β™ ™ r n
Language required: D DE □ EN Π FR
Π Formulat All 9 themes (approximately 90 issues) r-| ^r Π Mrs Π Ms
□ Paper: 360 EUR (Please use block capitals)
D PDF: 264 EUR Name: First name:
Π Paper + PDF: 432 EUR Company: Department:
Language required: O DE □ EN Π FR Function:
Address*
Π Formula 2: One or more of the following seven themes: „ , ' I
Post code: Town:
□ Theme 1 'General statistics' Country:
Π Paper: 42 EUR Π PDF: 30 EUR Π Combined: 54 EUR jet: Fax: _
□ Theme 2 'Economy and finance' E-mail: _ _
Π Theme 3 'Population and social conditions'
□ Theme 4 'Industry, trade and services Ρ3*™"*o n r e"iPt o f i n v o i c e· Preferably by:
□ Theme 5'Agriculture and fisheries' „ °a n k t ran s f e r
η TU c .t- . ι i j . LJ Visa □ Eurocard
□ Theme 6 External trade _ ...
□ Theme 8 'Environment and energy £?rd N o : ■ — ExPires o n : '
Π Paper: 84 EUR □ PDF: 60 EUR □ Combined: 114 EUR ,PJease c°n f i r m TIÌt£QJTTf> \k l ™m*?\ e „