CHANGES IN EARLY LEARNING
AND CHILDCARE USE AND
OUTCOMES AT AGE 5:
COMPARING TWO GROWING UP
IN SCOTLAND COHORTS
Authors: Line Knudsen, Eilidh Currie and Paul Bradshaw, ScotCen Social Research
Date: November 2017
ACKNOWLEDGEMENTS
First and foremost, the authors would like to thank all the families who have given up their time to take part in the study and have supported it continuously sweep by sweep.
The Growing Up in Scotland study is very much a collaborative venture. We owe a huge debt of gratitude to our colleagues in NatCen’s operations and computing departments and to our team of interviewers and supervisors for conducting the interviews with such dedication and professionalism.
We would also like to thank everyone involved in the preparation of this report - particularly Wendy van der Neut, Sharon Glen, Liz Levy and Ganka Mueller at the Scottish Government who provided feedback on early drafts. Thanks also to Stephen Hinchliffe for methodological advice.
CONTENTS
EXECUTIVE SUMMARY 8
1
INTRODUCTION 13
1.1. Background and report overview 13
1.2. About GUS 14
1.3. ELC in Scotland: the policy context 14
1.3.1. ELC within the wider Scottish policy context 16
1.3.2. Maintaining and improving standards in ELC provision 17
1.4. Research questions 18
2
METHODS 20
2.1. Sample and data overview 20
2.2. Survey data on ELC 21
2.3. Linked admin data from the Care Inspectorate 23
2.3.1. Matching the admin data to the survey data 25
2.4. Child outcomes considered in the report 26
2.4.1. Adjustment to primary school 26
2.4.2. Social, emotional and behavioural development 29
2.4.3. Cognitive ability 30
2.5. Analytic approach and interpreting the findings 32
2.5.1. Multivariable analysis 33
3
EARLY LEARNING AND CHILDCARE 35
3.1. Introduction 35
3.2. Key findings 35
3.3. ELC attendance 36
3.3.1. ELC attendance across the two cohorts 37
3.3.2. Duration of attendance at ELC and childcare from other providers 39 3.3.3. Duration of attendance at main ELC provider: comparing families
3.3.4. Variations in duration of ELC attendance by socio-economic and area
characteristics 43
3.4. The ELC setting 46
3.4.1. Provider type 47
3.4.2. Provider quality 47
3.4.3. Variations in ELC provider characteristics by socio-economic and area
characteristics 50
4
CHILD OUTCOMES AT AGE 5 55
4.1. Introduction 55
4.2. Key findings 55
4.3. Adjustment to primary school 56
4.3.1. Adjustment to primary school among 5 year old children in 2015 56 4.3.2. Comparing adjustment to primary school across the cohorts 58 4.3.3. Variations by socio-economic and area characteristics 59 4.4. Social, emotional and behavioural development at age 5 61
4.4.1. Social, emotional and behavioural development among 5 year old
children in 2015 62
4.4.2. Comparing social, emotional and behavioural development across the
cohorts 63
4.4.3. Variations by socio-economic and area characteristics 65
4.5. Cognitive development at age 5 in 2015 and 2009/10 67
4.5.1. Variations in cognitive ability scores by socio-economic and area
characteristics 69
5
ELC USE AND OUTCOMES AT AGE 5 71
5.1. Introduction 71
5.2. Key findings 72
6
DISCUSSION AND CONCLUSIONS 80
6.1. Introduction 80
6.2. Changes in ELC use 80
6.3. Changes in children’s outcomes upon entry to primary school 82 6.4. Is there a relationship between the number of hours children attend ELC and outcomes at age 5? And is there any evidence that the increase in ELC
entitlement improved outcomes for children at the start of primary school? 83 6.5. Is there a relationship between the quality of the ELC setting and child
outcomes at age 5? 84
7
REFERENCES 87
8
APPENDICES 90
8.1. APPENDIX A: DETAILS OF KEY VARIABLES 90
8.2. APPENDIX B: INTERPRETING THE COHORT COMPARISON TABLES 94
EXECUTIVE SUMMARY
Overview
Growing Up in Scotland (GUS) is a large-scale longitudinal research project aimed at tracking the lives of several cohorts of children living in Scotland from the early years, through childhood and beyond.
This report draws on data from Birth Cohort 1 (BC1) and Birth Cohort 2 (BC2) combined with administrative data from the Care Inspectorate to provide an understanding of characteristics of early learning and childcare (ELC) use and provision in Scotland. In particular, it assesses how this changed between 2008/09 and 2014 – including whether the increased entitlement to funded ELC (from 475 to 600 hours per year) which came into force in August 2014 appeared to have any immediate effects on ELC use among eligible 3-4 year olds. It also looks at how ELC use and provision differed for children living in different types of areas and with different social background characteristics.
Furthermore, using hitherto unreported data collected in 2015 when children in BC2 were aged 5, the report explores whether there had been any changes in outcomes among 5 year olds since 2009/10 when children in BC1 were the same age.
Finally, the report explores associations between, on the one hand, the average weekly number of hours children spent at their main ELC provider and characteristics of the ELC setting, and, on the other hand, children’s cognitive and social
development at age 5, as well as their adjustment to primary school.
KEY TERMS:
ELC/Early Learning and Childcare: refers to what was previously known as
‘pre-school education’. Includes any wrap-around care the child receives from their main ELC/pre-school provider, but not any care received by other providers.
ELC provider: the provider from which the child receives their funded ELC (pre-school) entitlement. If the child receives their funded entitlement from more than one provider, it refers to their main provider.
Childcare: any care the child receives from providers other than their main ELC/pre-school provider.
Changes in ELC use
On average, 4 year olds in 2014 spent just over two hours per week longer at their main ELC provider than 4 year olds in 2008/09.1 An increase was
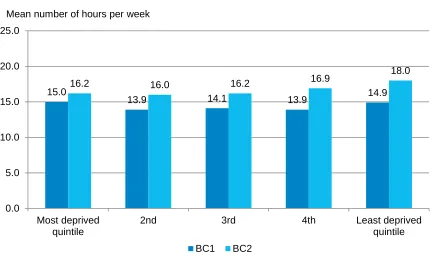
observed for all the different groups of children considered in the analysis, however, it was particularly notable among those living in more affluent households, in less deprived areas, and whose parents had higher levels of education.
Looking specifically at ELC use among 4 year olds in the six months before and six months after the increase in funded ELC entitlement introduced in August 2014, the analysis showed an increase (of just over one and a half hours per week) in average parent-reported ELC use in the six months immediately following the increase in entitlement.2
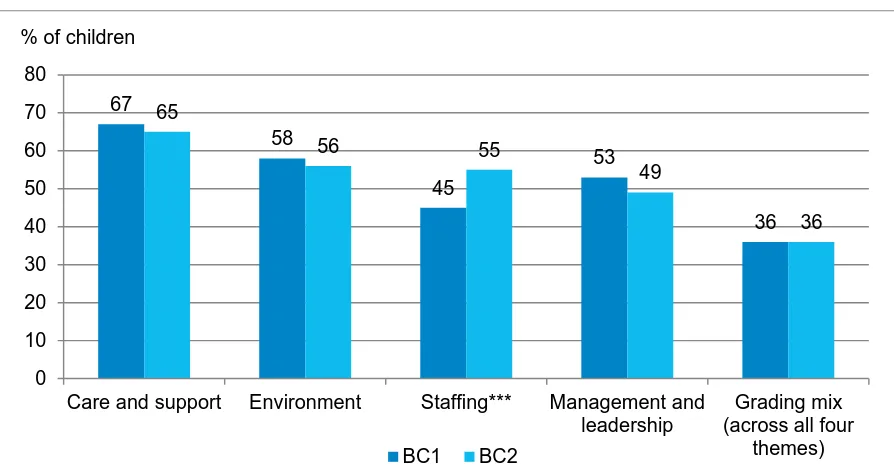
Encouragingly, the overall proportion of children attending an ELC setting with a high staffing quality grade (as assessed by the Care Inspectorate) increased between 2008/09 and 2014 – from 45% to 55%. However, although an
increase was evident across all deprivation groups, it was larger among those living in the least deprived areas and, on average, children living in more deprived areas were less likely to attend an ELC provider with a high staffing quality grade than their peers in less deprived areas.
Nonetheless, when all aspects of quality were considered, in 2014 (just like in 2008/09) children living in disadvantaged circumstances were just as likely as their more advantaged peers to attend an all-round high quality ELC provider.3
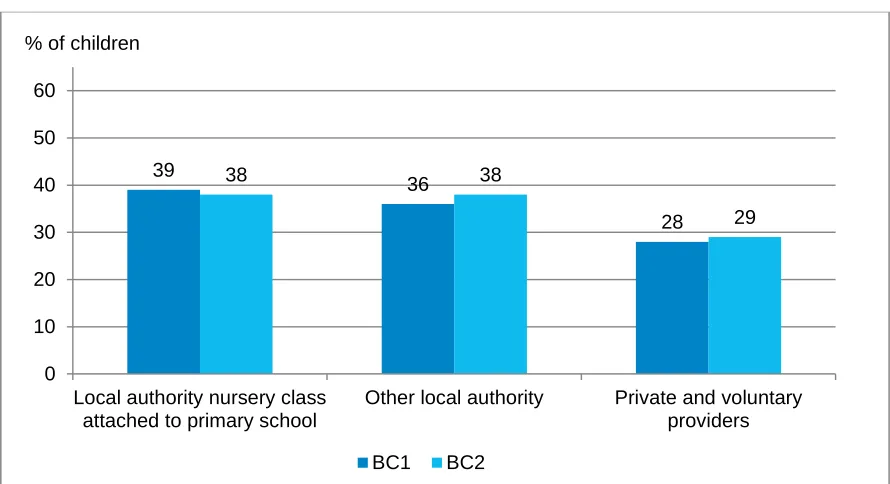
In both 2008/09 and 2014 the most common type of ELC provider attended by 4 year old children was a local authority-run nursery class attached to a
primary school. In both cohorts, children in higher income households were more likely than those in lower income households to attend a private or voluntary ELC provider. This difference was more pronounced in 2014.
1
Note that, because of slight differences in how data on duration of ELC were collected, comparisons should be treated with caution.
2
As above, because of slight differences in how data on duration of ELC were collected, comparisons should be treated with caution.
Changes in children’s outcomes upon entry to primary school
The vast majority of children were reported by their parent or carer to have adjusted well to primary school. Compared with children the same age in 2009/10, 5 year olds in 2015 were a little more likely to complain about school and to be reluctant to go to school, and a little less likely to look forward to going to school. Nonetheless, overall levels of adjustment to primary school were very similar.
Parent-reported levels of hyperactivity and pro-social behaviour among 5 year olds improved between 2009/10 and 2015. For example, the proportion of 5 year old children exhibiting higher than average levels of hyperactivity fell from 21% to 18% over this period. Meanwhile, the proportion displaying below average levels of pro-social behaviour fell from 17% to 14%.
At an overall level there was no change in average problem solving ability among 5 year olds between 2009/10 and 2015. In contrast, the analysis showed a slight decrease in average vocabulary ability for children this age.
Looking at children according to socio-economic and area characteristics, in both cohorts, those living in less advantaged circumstances were more likely than their more advantaged peers to have below average levels of adjustment to primary school (as reported by their parent or carer). They were also more likely to have poorer social and behavioural development and to score lower on measures of cognitive ability.
Between 2009/10 and 2015, on the measure of pro-social behaviour, there were signs of a slight widening of the gap between children whose parents had no formal qualifications and children whose parents had a degree. This was driven primarily by an increase in average pro-social behaviour scores among children whose parents were educated to degree level.
In contrast, on the measure of vocabulary ability there were signs of a slight narrowing of the gap between children in the poorest and the wealthiest families. This was a result of a slight increase in average scores among children in the poorest households alongside a slight decrease in average scores among those in the most affluent households.
Is there a relationship between how long children spend in ELC and outcomes at age 5?
However, among children in lower and middle income families (outside the most affluent 40% of households), those who attended their main ELC provider for more than 30 hours per week were at a slightly higher risk than those who attended ELC for 12.5 hours or less of exhibiting above average levels of hyperactivity at age 5. This association was also evident after controlling for the level of hyperactivity reported when the child was aged 3, and for other social background characteristics such as the parents’ level of education and the level of area deprivation.
Is there a relationship between the quality of the ELC setting and child outcomes at age 5?
The analysis found some associations between quality of ELC provision (as measured by the Care Inspectorate) and children’s social and behavioural outcomes, although the differences in average outcomes were small. These associations remained statistically significant when taking into account
differences in children’s social background and earlier outcomes measured at age 3.
Specifically, among children attending ELC, on average, attending a provider with high staffing grades appeared to be associated with a very small
decrease in the likelihood of exhibiting above average levels of peer problems at age 5.
Furthermore, children who attended an ELC setting that achieved at least ‘very good’ grades across all four of the Care Inspectorate’s quality themes were less likely to have raised levels of peer problems at age 5, and were less likely to display below average levels of pro-social behaviour, than children who attended a setting that did not achieve these grades.
Earlier analysis using GUS data collected from children born in 2004/05 found a statistically significant but weak association between attending an ELC provider with a high level of care and support and better vocabulary at age 5. However, the analysis carried out for this report showed no statistically significant associations between the quality of the ELC setting and any aspects of children’s cognitive development.
Implications for policy
consequences of current and future strategies for ‘closing the gap’ between more and less advantaged children, if they want to ensure that no groups of children are doing worse as a result.
The Scottish Government have committed to increasing the entitlement to funded ELC to an average of 30 hours per week. This report found no
evidence to suggest that this is likely to have any notable detrimental effects on children’s outcomes by the time they enter school. However, neither did it find any evidence to suggest that an increase in ELC duration would be beneficial to children.
Notably, these findings are based on the current status of ELC provision, where most children experience relatively high levels of quality in the ELC they receive. As demands on providers to offer a higher number of hours increase, there is a risk that the quality of provision may fall.
Given the association between quality of provision and elements of children’s social and behavioural outcomes, a drop in the quality of provision alongside an increase in the number of hours children spend in ELC may well have more detrimental effects than those shown in this report. This stresses the
importance of ensuring that the level of quality of ELC provision does not suffer as demands on providers increase.
Furthermore, it seems crucial that equality of access to high quality ELC
1
INTRODUCTION
1.1. Background and report overview
For a number of years, early learning and childcare (ELC) (or ‘pre-school education’ as it is also referred to) has been high on the agenda for policy makers in Scotland and, indeed, across the UK. Recent political commitments to increase the entitlement to free ELC (Scottish Government, 2016a) have further fueled debates about how provision ought to be organised as well as which children (if any) might particularly benefit from attending ELC.
A recent review of the literature (Scobie and Scott, 2017) reveals the range of associations found between various aspects of ELC use and child outcomes in previous research. For example, the Effective Provision of Pre-school Education (EPPE) study, which was specifically designed to explore effects of ELC provision on children’s development, found that attending a high quality ELC provider had
beneficial effects on children’s cognitive and social development (e.g. Sylva et al., 2004). In a Scottish context, analysis of data from the Growing Up in Scotland study (GUS) has also suggested a link between attending a high quality ELC provider and cognitive outcomes (Bradshaw et al., 2014).
This report uses data from GUS combined with administrative data provided by the Care Inspectorate to provide an understanding of the characteristics of ELC use and provision in Scotland. In particular it assesses how this changed between 2008/09 and 2014 – including whether the increased entitlement to funded ELC (from 475 to 600 hours per year) which came into force in August 2014 had any immediate effects on ELC use among eligible 3-4 year olds. It also looks at how ELC use and provision differ for children who live in different types of areas and who have different social background characteristics. Furthermore, using hitherto unreported data collected in 2014 and 2015, the report explores whether there was any improvement (or
and characteristics of the ELC setting and, on the other hand, children’s cognitive and social development at age 5, as well as their adjustment to primary school.4
1.2. About GUS
GUS is a large-scale longitudinal research project aimed at tracking the lives of several cohorts of Scottish children from the early years, through childhood and beyond. The main aim of the study is to provide information to support policy-making in Scotland, but it is also intended to be a broader resource that can be drawn on by academics, voluntary sector organisations, practitioners, parents and other interested parties.
To date, GUS has collected information about three nationally representative cohorts of children: a child cohort and two birth cohorts. Altogether, information has been collected on around 14,000 children. This report draws on data collected from the two birth cohorts. The first birth cohort (Birth Cohort 1 or ‘BC1’) comprise 5,217 children born between June 2004 and May 2005 and living in Scotland when aged 10 months. For this cohort, starting in 2005/06, data were collected annually from when the
children were aged 10 months until they were just under 6 years old, and then biennially at age 8 and when the children were in Primary 6 (age 10). At the time of writing (2017), the ninth sweep of data collection with this cohort is underway, while the children are aged around 12 and in their first year of secondary school. The second birth cohort (Birth Cohort 2 or ‘BC2’) comprise 6,127 children who were born between March 2010 and February 2011 and living in Scotland when aged 10
months. For this cohort, starting in 2011, data were collected when the children were aged 10 months, just under 3 years, just under 4 years, and just under 5 years. The report draws on data collected when the cohort children were aged just under 4 and just under 5 years of age. For BC1, this means drawing on data collected
between 2008 and 2010. For BC2, this means drawing on data collected in 2014 and 2015. More detailed information about the data is provided in section 2.1.
1.3. ELC in Scotland: the policy context
The annual entitlement to pre-school education for 3 and 4 year olds in Scotland is set out in the Standards in Scotland’s Schools Etc Act 2000. This Act placed a duty on local authorities to secure a pre-school education place for all 3 and 4 year-olds whose parents want a place from the term following their child’s third birthday. The
4
statutory entitlement was introduced in April 2002, initially as 412.5 hours per year. This was then increased to 475 hours in 2007.
In 2014, under The Children and Young People (Scotland) Act 2014 (hereafter CYP Act 2014), the entitlement to pre-school education was expanded to cover both early learning and childcare. ELC is defined in the Act as a “service, consisting of
education and care, of a kind which is suitable in the ordinary case for children who are under school age, regard being had to the importance of interactions and other experiences which support learning and development in a caring and nurturing setting” (Section 46). This new term was introduced in order to overcome the
traditional divide between (part time) education and (full time) childcare, the latter of which was seen as less important to learning. The term seeks to reflect EU and OECD recommended models of integrated education and care (Scottish
Government, 2016a).
Under the CYP Act 2014 the entitlement to free ELC was increased to 600 hours per year from August 2014, amounting to approximately 16 hours per week during term time. The hours can be delivered in blocks of between two and a half and eight hours a day spread across the week (Scottish Government, 2016b). The free provision is delivered by a range of providers, including local authority nurseries and family centres, nursery classes attached to local authority primary schools, partnerships offered by private or non-profit nurseries and some childminders. However, a recent financial review of ELC provision in Scotland found that three-quarters of children registered for the entitlement receive the provision in a local authority setting (Scottish Government, 2016c).
Depending on their date of birth, children receive varying amounts of funded ELC before starting school. At the time of writing, children who turn 3 between March and the end of August receive two full years (six terms) of funded ELC; children who turn 3 between September and the end of December receive just under two years (five terms), but parents can request an additional year (three terms) of ELC if the child’s school entry is deferred; and children who turn 3 in January or February receive just over a year (four terms), but are entitled to an additional year (three terms) if the child’s school entry is deferred.5
In 2014 the entitlement to ELC was also extended to 2 year olds who are looked after under a kinship care order or with a parent appointed guardian, as well as 2 year olds with a parent in receipt of qualifying benefits. This reflects the importance placed on
5
ELC as a means to closing the attainment gap between the most and least advantaged children. Qualifying benefits include Income Support, Jobseekers Allowance, Employment and Support Allowance, Incapacity or Severe Disablement Allowance and State Pension Credit. In 2015, the range of qualifying benefits was extended to include Child Tax Credits (with some limitations6), Universal Credit, and financial support provided under Part VI of the Immigration and Asylum Act 1999.
As well as offering an increased number of hours of ELC and extending the
entitlement to some 2 year olds, the CYP Act 2014 contained a provision to increase the flexibility of the funded entitlement. This involved introducing a requirement for local authorities to consult with representative populations of parents every two-three years on which patterns of ELC would best meet their needs, and to reconfigure their services over time towards meeting those needs. This means that local authorities are now required to ensure that ELC is offered in a way that gives parents choice and flexibility in order to help those with work, training or study commitments. Local
authorities must demonstrate how they are offering places and improving flexibility based on their consultations with local communities. The Scottish Government committed £969.2 million over 6 years (from 2014/15) to local authorities to support implementation of the ELC elements of the CYP Act 2014 (Scottish Government, 2016a). Since then, the Scottish Government has pledged to increase the provision of funded ELC further to 1140 hours per year by 2020 for children who are 3 or 4 years old, as well for 2 year olds whose parents are on qualifying benefits and eligible for the 600 hours free entitlement through the CYP Act 2014 (Scottish
Government, 2016a). In 2016, around 9% of the population of 2 year olds and close to 100% of 3 and 4 year olds were registered for funded ELC (Scottish Government, 2016d).
1.3.1. ELC within the wider Scottish policy context
A central aim of the CYP Act 2014 was to increase the amount and flexibility of ELC available to Scottish parents. The Scottish Government sees this as a significant step towards wider ambitions for Scotland to be the best place for children to grow up. In A Blueprint for 2020: The Expansion of Early Learning and Childcare in Scotland, the Scottish Government acknowledges that ELC and schools do not exist in isolation, and that children’s outcomes are strongly influenced by factors outside the sphere of
6
education – such as household income, parenting approaches, peer contact and health and development (Bradshaw and Tipping, 2010). Nonetheless, the provision of universally accessible and high quality ELC is highlighted as a means of giving children the best start in life, and of closing attainment and inequality gaps (Scottish Government, 2016a).
Furthermore, the increase in the amount and flexibility of ELC is a feature of the Scottish Government’s emphasis on, and aim to shift the balance of public services towards, early intervention and prevention (Scottish Government, 2007a; Scottish Government, 2008). Rather than being seen as a separate stage, the pre-school years are viewed as part of a wider learning process. In policy terms, this view has been exemplified in the development of the 3-5 curriculum in the late 1990s as well as in the inclusion of the pre-school years within Curriculum for Excellence Early Level (Kidner, 2011). As an example of this, the ‘early level’ of the Curriculum for Excellence spans both ELC and Primary 1 and is designed to make the transition to primary school as seamless as possible. Teachers (as well as ELC practitioners) are encouraged to meet the needs of children through active, hands-on and play-based learning. This means that children are able to benefit from less formal, alternative learning environments – for example, outdoor settings and/or other forms of activity – which may bear more similarities to ELC settings or play-based learning (e.g.
Scottish Government, 2007b).
1.3.2. Maintaining and improving standards in ELC provision
In order to maintain and improve standards in ELC provision, providers are inspected by the Care Inspectorate, a single regulatory body which inspects care services for both children and adults in Scotland. As well as carrying out routine inspections, the Care Inspectorate has a duty to investigate complaints and can, where appropriate, take enforcement action.
ELC providers are inspected according to the National Care Standards (Scottish Government, 2005). The standards reflect the rights of children and young people as set out in the United Nations Convention on the Rights of the Child. They recognise the rights of ELC users (i.e. children) to dignity, privacy, choice, and safety, to be treated equally and to be given opportunity to realise their potential in an environment that recognises the benefits of diversity. In inspecting ELC services against these standards, the Care Inspectorate seeks to ensure that providers are “doing
guidance contained in Pre-birth to Three: Positive Outcomes for Scotland’s Children and Families (Learning and Teaching Scotland, 2010).
Inspections by the Care Inspectorate are unannounced and cover all services which provide day care of children, including – but not restricted to – those which offer pre-school education. ELC services receive a minimum frequency of inspections based on previous performance and risk assessments. When inspected they are graded against four quality themes: care and support; environment; staffing; and
management and leadership. Further detail on these themes is provided in section 2.3.
ELC providers are also inspected by Education Scotland – sometimes in tandem with inspections by the Care Inspectorate. These inspections take a different focus and are more concerned with elements of the educational provision in the ELC setting, including the development of skills and understanding in literacy, numeracy, health and well-being. A key difference between Education Scotland and Care Inspectorate inspections is that the latter inspects all services which provide daycare of children to assess care and welfare issues (as outlined above). In contrast, Education Scotland inspections are focused on early years centres and nursery classes which are delivering the funded early learning and childcare, as part of a wider programme to evaluate “the quality of learning and teaching in Scottish schools and education services” (Education Scotland, 2014). In addition, inspections by the Care
Inspectorate alone are more frequent and unannounced, whereas those undertaken by Education Scotland, or Education Scotland and the Care Inspectorate together are less frequent and announced two to three weeks in advance.
1.4. Research questions
This report seeks to answer a number of research questions.
First, chapter 3 addresses three questions concerned with ELC use and characteristics:
How did ELC use and characteristics of ELC provision in 2014/15 compare with 2008/09?
Did the increase in entitlement to funded ELC introduced in August 2014 lead to any immediate changes in the average number of hours children attended ELC?
Second, two questions about children’s outcomes upon entry to primary school are considered in chapter 4:
What was the level of children’s adjustment to primary school and their social and cognitive development at the start of primary school in 2015?
Has there been any improvement in these outcomes for children at the start of primary school between 2009/10 and 2015?
Third, chapter 5 seeks to answer two specific questions about associations between ELC use and child outcomes:
Is there a relationship between the average number of hours children attend ELC and outcomes at age 5?
Is there a relationship between the quality of the ELC setting and child outcomes at age 5?
Finally, with a focus on changes observed between the two cohorts, chapter 6 discusses some of the key findings reported in the previous chapters and also addresses the following question:
2
METHODS
2.1. Sample and data overview
This report uses data collected from the two GUS birth cohorts (BC1 and BC2). The majority of the analysis draws on data collected at the time the children were just under 5 years old.7 In some instances (such as details about ELC use), data collected when the child was aged 4 were also used. For BC1, this means the analysis draws primarily on data collected in 2009/10, with some data collected in 2008/09. For BC2, the analysis draws primarily on data collected in 2015, with some data collected in 2014.
The cohorts are both comprised of nationally representative samples of children living in Scotland at age 10 months (their age at the first sweep of data collection) and who were born over a specific time period: all children in BC1 were born between June 2004 and May 2005; all children in BC2 were born between March 2010 and February 2011. For simplicity, comparisons in the report refer to BC1 and BC2. However, the results for each cohort should be understood to represent all children of the respective age living in Scotland at the time point in question and any statistically significant differences noted in the report should be taken to reflect actual differences in the circumstances and experiences of children of the relevant age and their families. They have not occurred because of differences in the research design for the two cohorts.
For example, the results presented for children in BC2 at the time they were aged 5 are representative of all children of this age living in Scotland in 2015 (when the GUS data were collected) who had also been living in Scotland when they were 10 months old.
The majority of GUS data have been collected through face-to-face interviews with children and parents in their homes. In addition, on three occasions (twice with
families in BC1 and once with families in BC2) data were collected through the use of
short online questionnaires which could also be completed over the phone. This report draws on data collected both as part of in-home interviewer visits and data collected through the use of online/telephone questionnaires (see Table 2-1).
Table 2-1 Data overview
Child’s age 4 years 5 years
Cohort BC1 BC2 BC1 BC2
Year of data collection
2008/09 2014 2009/10 2015
Data collection mode
In-home visit Online/telephone survey with child’s main carer
In-home visit In-home visit
Number of interviews achieved*
3994 3237 3833 4434
*The focus of the analysis is on the outcomes of children at the age of 5. Therefore, only children whose families took part in the age 5 interview were included in the analysis.
In addition to the GUS survey data, the analysis also draws on administrative data from the Care Inspectorate which was ‘linked’ to the GUS data. Further information is provided below.
2.2. Survey data on ELC
Around the time the child was aged 4, parents in both cohorts were asked whether the child was attending a ‘pre-school’ or early education place. If so, further
information was collected, including information about the number of hours the child would usually spend in this setting on a weekly basis and details of the provider.8
8
As outlined in section 1.3, since the introduction of the CYP Act 2014 the term ‘Early Learning and Childcare’ (ELC) has largely replaced that of ‘pre-school education’ among policy makers and practitioners in Scotland. Accordingly, in this report ‘ELC’
is used to refer to what was previously referred to as pre-school education. The
focus of the report is on ELC provided by the child’s main ELC provider (including both funded and unfunded hours). Thus, figures outlining details of a child’s ELC attendance refer to any time he or she spent at their main ELC provider (i.e. their main pre-school provider), but does not include any time spent with a different provider.9 Any childcare the child may have received from other providers is treated separately and is referred to as ‘childcare’, rather than ELC.10
Further to this, note that only ELC use after the child’s third birthday is included in the GUS data.
Data on ELC were collected slightly differently in the two cohorts. In BC1, ELC data were collected through interviewer-administered questionnaires, the majority as part of the age 4 interview though some parents were asked as part of the age 5
interview. In this report BC1 age 4 data were used as far as possible to ensure the highest possible level of comparability with BC2 data (see below). Age 5 ELC data were used in cases where age 4 information was incomplete or non-existent. In total, ELC data were collected for 3731 children in BC1 – for 3459 of these, ELC data were obtained at the time the child was aged 4; for the remaining 272 the data were
obtained when they were aged 5.
For some children in BC2 ELC data were collected through an online or telephone questionnaire when the child was aged 4. For others it was collected through an interviewer-led questionnaire when the child was aged 5. At age 4, information was collected about the child’s current ELC attendance and provider. The ELC data collected from BC2 families as part of the age 5 interview were collected about
9
In both cohorts, parents were asked to indicate the type of pre-school provider from the following list: Nursery class attached to a local authority primary school, Nursery class attached to an
independent/private school, Local authority nursery school or nursery centre. Private day nursery or nursery school, Community/voluntary nursery, Community/voluntary playgroup, Local authority playgroup, Private playgroup, Family Centre.
current ELC use or, if the child was not currently using any ELC, about ELC use since the child’s 3rd
birthday. In total, ELC data were collected for 4314 children in BC211 – for 2908 of these, ELC data were obtained at the time the child was aged 412; for 1406 the data were obtained when they were aged 5.13
The data on ELC attendance and ELC provider type used in the analysis are described in more detail in sections 3.3 and 3.4.
2.3. Linked admin data from the Care Inspectorate
The report draws on linked admin data from the Care Inspectorate. As noted in section 1.3.2, the Care Inspectorate regulates care services for children and adults in Scotland. This includes a wide range of services for children and young people, including fostering, adoption and residential care along with child-minding and day care services. This latter category includes settings which provide ELC.
During inspections, the Care Inspectorate assesses the quality of the provider against four quality themes: care and support, environment, staffing, and management and leadership. Until 2016,14 these quality themes each had
accompanying quality statements – these are shown in Table 2-2. For each quality theme, services were awarded a grade between 1 and 6 (Care Inspectorate, 2016) indicating the following: 6 – excellent; 5 – very good; 4 – good; 3 – adequate; 2 – weak; 1 – unsatisfactory.
11
The exact number of cases for which details were obtained vary according to the measure used. The figures given in the text refer to the number of cases for which information about the child’s ELC provider were obtained. Information about the average number of hours the child attended ELC per week was obtained for 4306 cases.
12
Of these 2908, for 1538 children ELC data were collected before the increase in entitlement, and for 1370 children ELC data were collected after the increase in entitlement.
13
Of the 1406 cases where ELC data on provider type were collected at the time the child was aged 5, in 662 cases the information was collected retrospectively – that is, the child was no longer
attending ELC at the time of the age 5 interview. 14
Table 2-2 Care Inspectorate quality themes and statements
Quality theme
Accompanying quality statements
Quality of care and support
Ensures that parents and families participate in assessing and improving the quality of care and support provided by the service.
Enables service users to make individual choices and ensures that every service user can be supported to achieve their potential.
Ensures that service users’ health and wellbeing needs are met.
Uses a range of communication methods to ensure we meet the needs of service users.
Quality of environment
Ensures service users and carers participate in assessing and improving the quality of the environment within the service.
Ensures the environment is safe and service users are protected.
The environment allows service users to have as positive a quality of life as possible.
The accommodation and resources are suitable for the needs of the service users.
Quality of staffing
Ensures that service users and carers participate in assessing and improving the quality of staffing in the service.
Staff have been recruited and inducted in a safe and robust manner to protect service users and staff.
Has a professional, trained and motivated workforce which
operates to National Care Standards legislation and best practice.
Ensures that everyone working in the service has an ethos of respect towards service users and each other.
Quality of management and
leadership
Ensures service users and carers participate in assessing and improving quality of the management and leadership of the service.
Involves the workforce in determining the direction and future objectives of the service.
To encourage good quality care, promotes leadership values throughout the workforce.
2.3.1. Matching the admin data to the survey data
The administrative data on ELC settings used in this report are produced using data from inspection reports. Data on the grades awarded following inspection are held electronically and published on the Care Inspectorate website.
Children in BC1 were born between 1 June 2004 and 31 July 2005. As such, the first children eligible to attend their statutory ELC place in this cohort would have done so from the autumn term of 2007. Most of these children would have continued to attend until June 2009 before starting school in autumn 2009. However, across the cohort as a whole, children would have started ELC sometime between August 2007 and August 2008 and would have potentially attended up to June 2010. Some children may have moved between providers or received their ELC entitlement from two different providers. However, it is not possible to identify which children did so from Care Inspectorate data. In addition, some settings closed or merged or moved and new settings were established and registered.
To reflect the full period of attendance for all children in the cohort, Care Inspectorate data were requested covering the entire period from 2007 to 2010. Where data on a single provider were available for multiple years, for example, quality ratings from multiple inspections, an average figure was calculated.
ELC details provided by parents as part of the GUS interview were successfully matched to Care Inspectorate information for 3658 children following the age 4 interview (99%). This corresponded to 1296 ELC centres meaning that, on average, each centre was attended by two to three children in BC1.15 Grades on quality themes from Care Inspectorate inspections were available for between 2878 and 3013 BC1 children.16 For the small number of BC1 cases where Care Inspectorate quality data had not been successfully matched based on the information provided at the age 4 interview, another attempt was made using ELC provider details obtained at the age 5 interview. This resulted in the addition of Care Inspectorate quality information for between 38 and 47 cases, depending on the quality measure. Children in BC2 were born between 1 March 2010 and 28 February 2011, with the first children becoming eligible to attend their statutory ELC place from the autumn term of 2013. The majority of these children would have continued to attend until June 2015 before starting school in autumn 2015. Across the cohort as a whole,
15 This is largely due to the ‘clustering’ of the sample. For further details see Bradshaw and Corbett, 2013.
16
children would have started ELC sometime between August 2013 and August 2014, and would have potentially attended until June 2016. Care Inspectorate data were therefore requested covering the entire period from 2013 to 2016.
4426 children in BC2 attended ELC at some point after turning 3 years old. As in BC1, parents were asked for details about the child’s main ELC provider. Rather than manually linking survey records to Care Inspectorate data in the office (as was done for BC1), interviewers were able to use an electronic lookup table to select the ELC provider from a pre-defined list provided by the Care Inspectorate. The list included all ELC services that were operating at the point immediately before fieldwork commenced and incorporated a unique Care Inspectorate identifier. This meant the Care Inspectorate identifier for the provider was already appended to the survey data, allowing subsequent matching of other data from the Care Inspectorate.
Survey data were successfully matched to Care Inspectorate quality information for 3941 BC2 children who took part in the age 5 interview (91% of those who attended ELC). This corresponded to 1401 ELC centres meaning that, on average, each centre was attended by two to three children in BC2.
2.4. Child outcomes considered in the report
This report considers three different types of child outcomes, all measured at the time the cohort children were aged just under 5:
Adjustment to primary school: Information was collected from the child’s parent or carer in cases where the child had started primary school at time of interview
Social, emotional and behavioural development: Information was collected from the child’s parent or carer using the Strengths and Difficulties
Questionnaire (SDQ), for all children
Cognitive development: Objective assessments were carried out with all children where consent was obtained.
Details about each type of outcome measure are provided below.
2.4.1. Adjustment to primary school
part of the age 5 interview17 where the child had already started Primary 1. This applied to 1227 children in BC1 and 2750 children in BC2.
Two composite measures of the child’s adjustment to primary school were developed based on responses to six questions (shown in Table 2-3). Each measure is
described in turn below.
Table 2-3 Questions on adjustment to primary school
Question Response categories Most positive response
How often has your child complained about
school?
More than once a week
Once a week or less
Not at all
Not at all
How often has your child said good things about school?
More than once a week
Once a week or less
Not at all
More than once a week
How often does your child look forward to going to school?
More than once a week
Once a week or less
Not at all
More than once a week
How often has your child been upset or reluctant to go to school?
More than once a week
Once a week or less
Not at all
Not at all
Is your child finding it hard to sit still and listen?
Agree strongly
Agree
Neither agree nor disagree
Disagree
Disagree strongly
Disagree/disagree strongly*
Overall, has your child adjusted well to school?
Agree strongly
Agree
Neither agree nor disagree
Disagree
Disagree strongly
Agree/Agree strongly*
*Categories were combined as shown.
Table 2-4 Adjustment to primary school: composite measure (3 categories)
Level of adjustment Definition
Excellent Most positive response given for all six items
Good/average Most positive response given for at least one, but not for all six items
Poor Most positive response not given for any of the six items The second composite measure identifies scores which were ‘below average’ versus those which were ‘average and above’. This measure was derived by adding up standardised scores for the six individual items to create a total score.18 Those with a score below the mean were classified as ‘below average’ while the remainder were classified as ‘average or above’.
Table 2-5 Adjustment to primary school: composite measure (2 categories)
Level of adjustment Definition
Average or above The child’s total score summed across all six items was at or above the average (mean) for all children in the cohort whose parent/carer answered the questions
Below average The child’s total score summed across all six items was below the average (mean) for all children in the cohort whose
parent/carer answered the questions
2.4.2. Social, emotional and behavioural development
On GUS, measures of social, emotional and behavioural development are routinely obtained through the use of items from the Strengths and Difficulties Questionnaire
18
(SDQ) (Goodman, 1997). A parent report version of the SDQ was included in the self-completion section of the age 5 interview in both BC1 and BC2.19
The SDQ is a commonly used behavioural screening questionnaire designed for use with children aged between 3 and 16. It consists of 25 questions about a child’s behaviour, to which the respondent can answer ‘not true’, ‘somewhat true’ or ‘certainly true’. Responses can be combined to form five different measures of the child’s development, namely emotional symptoms (e.g. excessive worrying), conduct problems (e.g. often fighting with other children), hyperactivity/inattention (for
example, constantly fidgeting), peer relationship problems (e.g. not having close friends), and pro-social behaviour (e.g. being kind to others). Furthermore, the first four measures can be combined into a ‘total difficulties’ scale. Higher scores imply greater evidence of difficulties on each of the scales, with the exception of the pro-social behaviour scale where the reverse is true.
In this report, both mean scores and banded versions of the scales have been used. Mean scores are useful for comparing overall levels of social development across groups of children or over time, while the banded versions provide more nuanced and more easily interpretable measures. Previously, SDQ scores were most
commonly divided into ‘normal’, ‘borderline’ and ‘abnormal’ scores. These bandings were reviewed in 2016 and it is now recommended that SDQ scores on each of the scales are divided into the following categories: ‘close to average’, ‘slightly raised’, ‘high’ and ‘very high’, with ‘very high’ indicating multiple problems identified. The exception is the pro-social scale, which is divided into ‘close to average’, ‘slightly lowered’, ‘low’ and ‘very low’, with ‘very low’ indicating very little pro-social behaviour. Across the different scales, the further above (or below) average the score is, the greater the potential cause for concern.
Additionally, the definitions of the scores which constitute each of the categories have been re-standardised to reflect a more recent, British sample.20 Scores for BC1 and BC2 were derived using the same cut-off points to allow comparison.
2.4.3. Cognitive ability
At age 5, the cognitive ability of children in BC1 and BC2 was assessed using the British Ability Scales (BAS). The BAS is a cognitive assessment battery designed for
19
In BC2 these questions were also asked in the age 3 interview. 20
children aged between 2 years and 6 months and 17 years and 11 months. Though numerous tests of ability and intelligence exist, the BAS are particularly suitable for administration in a social survey like GUS. Two subtests of the BAS were used – the naming vocabulary and picture similarities subtests – which were each administered individually.
The naming vocabulary assessment measures a child’s language development. The test requires the child to name a series of pictures of everyday items in order to assess their expressive language ability. Conversely, the picture similarities test measures a child’s problem-solving skills (or non-verbal reasoning ability). In this assessment children are shown a row of four pictures on a page and asked to identify a further congruent picture. The child is therefore required to recognise a relationship based upon a common concept or element. The child must perceive various possibly relevant features of the pictures and engage in hypothesis testing to select the correct elements of commonality. The relationships become increasingly complex as the exercise progresses.
There are 36 items in the naming vocabulary assessment and 33 items in the pictures similarities assessment. However, to reduce burden and avoid children being upset by the experience of repeatedly failing items within the scale, the number of items administered to each child is dependent on their performance. For example, one of the criteria for terminating the naming vocabulary assessment is if five
successive items are answered incorrectly. Children in both cohorts were asked to complete these assessments when they were just under 5 years old. As such, the GUS BAS assessment scores offer a snapshot of children’s ability in expressive vocabulary and problem solving around the time they start primary school.21 On completion, the child’s raw score (the count of the number of items they
answered correctly) is converted into an ability score. The ability score reflects the range and the difficulty of the specific items a child is asked. Lookup tables for the transformation from raw scores to ability scores are provided in the BAS testing materials. The ability scores are then adjusted for the child’s age at the time of assessment using scores from a ‘norming’ sample which are also supplied with the assessment materials. Adjusting the scores in this way avoids older children
obtaining higher scores due to their more advanced stage of cognitive development and greater educational experience, rather than their ability.
21
While the same BAS assessments – naming vocabulary and picture similarities – were used for both cohorts at the same age, the edition of BAS was different. For BC1, the 2nd edition assessment was used (BAS-II), whereas for BC2 the third edition was used (BAS-3). While the assessments are almost identical across BAS-II and BAS-3 in terms of administration protocols, a number of minor changes were made which would introduce caveats when making a straightforward comparison of ability scores. To allow this, the assessment authors provided a calibration formula which permitted comparison of the standardised ability scores (t-scores). Note that because of this adjustment, it is not possible to express differences in average cognitive ability scores in terms of developmental age in months (as has been done in a previous GUS report, cf. Bradshaw, 2011) for comparison between cohorts.
2.5. Analytic approach and interpreting the findings
Much of this report is concerned with exploring changes between the two cohorts both at an overall level and for different groups of children according to a number of socio-economic characteristics and location (annual equivalised household income; highest level of parental education in the household; area deprivation (SIMD); and urban/rural location). Definitions of these measures are provided in Appendix A. For each outcome considered in the report (e.g. cognitive ability), the relationship
between the outcome and measures of socio-economic status or location was examined separately for each cohort. This allowed us to identify any noteworthy differences in outcomes – within each cohort – between children in different circumstances. By then comparing the results for BC1 and BC2 it was possible to assess if there had been any change in the nature of the relationship between the outcome variable and the socio-economic or location variable across the cohorts. For example, whether there had been a narrowing or widening of the gap between
children in different socio-economic sub-groups. Further details about this analysis and how to interpret tables are provided in Appendix B.
Throughout the report, unless otherwise stated, only differences which were statistically significant at the 95% level or above are commented on in the text.
2.5.1. Multivariable analysis
A key point of interest in this report is to examine whether there is an association between ELC use and characteristics and child outcomes. When examining such associations it is important to consider the influence of underlying factors and the inter-relationships between such factors and other things we are interested in. For example, the number of hours children spend in ELC is likely to be related to whether their parent or carer is in paid work, as well as their income level. Simple analysis may identify an association between weekly ELC attendance and children’s social development – for example, that children who attend ELC for between 12.5 and 16 hours per week have higher levels of social difficulties than children who attend ELC for less than 12.5 hours per week. However, this association may be occurring simply because of an underlying association between ELC attendance and household
income. Thus, rather than ELC attendance being associated with children’s social development in its own right, the relationship found in the analysis may be due to the influence of other factors. To ‘control’ for the influence of other factors (e.g.
household income) multivariable regression analysis was used. This form of analysis allows the examination of the relationships between an outcome variable (e.g. social development) and multiple explanatory variables (e.g. weekly ELC attendance, household income) whilst controlling for the inter-relationships between each of the explanatory variables. This means it is possible to identify whether there is an association between any single explanatory variable and the outcome variable also when other relevant variables have been controlled for. For example, to look at whether there is a relationship between duration of time spent in ELC and children’s social development that does not simply occur because ELC attendance and
household income are related. Note, though, that the identification of associations between one or more explanatory variables and an outcome variable does not necessarily imply that the explanatory variable(s) causes the outcome.
For certain analyses – for example, to consider whether an association between ELC quality and social development was different for children in higher and lower income households – ‘interactions’ were included in the multivariable models. Where an interaction is statistically significant this indicates that the relationship between the explanatory variable (e.g. ELC quality grade) and the outcome variable (e.g. social development) is different according to the value of another explanatory variable (e.g. household income). This may suggest, for example, that whilst ELC quality is
The multivariable analysis used both linear and (binary) logistic regression models. Full results of the models are included in the Technical Annex along with notes on how to interpret them.
Note that the statistical analysis and approach used in this report represents one of many available techniques capable of exploring this data. Other analytical
3
EARLY LEARNING AND
CHILDCARE
3.1. Introduction
As noted in the introductory chapter, ELC provision in Scotland has undergone a number of changes in recent years and continues to be high on the political agenda. This chapter considers the characteristics of ELC use among 4 year olds in 2014/15, comparing this with use six years previously.
In line with key policy debates, the chapter first examines the average number of hours children in each of the two GUS birth cohorts attended their main ELC provider at the time they were aged around 4 years old.22 Specifically, the chapter also
explores whether there were any signs of any change in ELC attendance following the increase in entitlement (from 475 hours to 600 hours per year) which was available from August 2014. It also considers how attendance differs according to children’s social background and where they live. Moving on to consider the ELC setting, the chapter then looks at the type of ELC providers attended by 4 year old children in each of the cohorts. Following this, using data from the Care Inspectorate, consideration is given to the quality of the ELC providers attended by the cohort children. Finally, the chapter examines how characteristics of the ELC setting – provider type and quality – differ according to measures of children’s social background and by location.
3.2. Key findings
Among children who attended ELC (97% of children in BC1; 98% children in BC2), on average, 4 year olds in 2014 spent just over two hours per week longer in ELC compared with 4 year olds in 2008/09,23 namely 16.6 hours on average per week compared with 14.4 hours per week.
In both 2008/09 and 2014, children in more advantaged circumstances tended to spend longer hours in ELC than their less advantaged peers. For example,
22
Details about how these data were collected are provided in Appendix A. 23
in 2014, on average, children living in households in the lowest income quintile spent just over 15 hours per week at their main ELC provider, while those in the highest income quintile spent an average of 20 hours per week. These differences increased between the cohorts. Children living in urban areas also attended ELC for longer hours than those in rural areas and towns. 24
The analysis showed an increase in average parent-reported ELC use for 4 year old children following the increase in entitlement introduced in August 2014. On average, parents who were interviewed in the six months before the increase in entitlement reported that their child spent 15.3 hours per week in ELC compared with 17.0 hours per week reported by parents who were interviewed in the six months after the increase.25
The most common type of ELC provider attended by children in each of the two cohorts was a local authority-run nursery class attached to a primary school. In both cohorts, children in higher income households were more likely than those in lower income households to attend a private or voluntary ELC provider. This difference was more pronounced in BC2 than in BC1.
In both cohorts, children living in disadvantaged circumstances were just as likely as their more advantaged peers to attend an ELC provider which achieved high grades across all four quality themes assessed by the Care Inspectorate.
However, children in more deprived areas were less likely than those in less deprived areas to attend an ELC provider with a high staffing quality grade (as assessed by the Care Inspectorate). Between 2008/09 and 2014 the
proportion of children attending a setting with a high staffing quality grade increased across all deprivation groups. However, it appears to have increased more in areas with the lowest levels of deprivation.
3.3. ELC attendance
As noted in section 1.3, an extension of the entitlement to funded ELC provision for 3 and 4 year olds and eligible 2 year olds came into force in August 2014 – from 475 hours per year to 600 hours per year, spread across a period of 38 weeks.
Information about ELC (pre-school) attendance was collected from families in BC1 in
24 This report uses the following urban/rural classification: ‘urban’ (large and other urban areas); ‘towns’ (accessible and rural small towns); and ‘rural’ (accessible and remote rural areas). Further details are provided in Appendix A.
25
2008/09 when the children were around 4 years old. Corresponding information was collected from families in BC2 in 2014 and 2015. This means that for children in BC1 information about ELC attendance was collected while the entitlement was 475 hours per year. Conversely, for many children in BC2 information on ELC attendance was collected after the increase in entitlement; that is, when the entitlement was 600 hours per year. That said, for some children in BC2 ELC attendance information was collected before the policy change; that is, while the entitlement was still 475 hours per year. Specifically, this applies to BC2 children for whom ELC information was collected before August 2014. On the one hand, this means that comparisons of ELC attendance across the cohorts do not lend themselves easily to assessments of the effect of the increase in entitlement. On the other hand, it means that it is possible to compare – using data from BC2 – average ELC attendance among 4 year olds where the interview took place in the six months before the increase in entitlement, with ELC attendance among 4 year olds where the interview took place in the six months after the increase in entitlement. Comparisons of this nature will be of
particular relevance to policy makers and others interested in examining the potential effects of increasing ELC entitlement.
It is important to note that the way information about average ELC duration was collected varied slightly within and between the cohorts and the original measures of ELC attendance were not directly comparable across cohorts and age points.
Therefore, the results must be interpreted with caution. In both cohorts, and at all age points, parents were asked to give an estimate of the amount of time the child would typically spend at their main ELC provider. However, while in BC1 parents were asked to provide a weekly estimate, in BC2 parents were asked to give an estimate for each day of the week, with estimates provided either to the nearest half hour, the nearest ten minutes, or the nearest minute. To enable comparison, these measures were combined into a single composite measure of the amount of time a child spent at their main ELC provider in an average week to the nearest half hour. Further details about the ELC attendance data are provided in Appendix A.
Also, as noted in section 2.2, the measure of ELC used in this report refers specifically to time a child spent at the setting where they received ‘pre-school education’, that is, time spent at their main ELC provider (including both funded and unfunded hours). As such, references to ELC do not include any childcare a child received from other providers (e.g. childminders providing wrap-around childcare). Where applicable, this is referred to as ‘childcare’ rather than ELC.
3.3.1. ELC attendance across the two cohorts
have attended ELC than children in BC1: 97% of children in BC1 had attended ELC since their 3rd birthday compared with 98% in BC2.
Furthermore, among all children who attended ELC, children in BC2 attended their main ELC provider for a higher number of hours per week than children in BC1. On average, children in BC1 attended ELC for 14.4 hours per week, whereas children in BC2 attended ELC for an average of 16.6 hours per week. At the time where ELC data were collected, just under two thirds of children in BC2 were entitled to 600 hours of funded ELC per year,26 while the remaining third of children in BC2 and all children in BC1 were entitled to 475 hours per year.
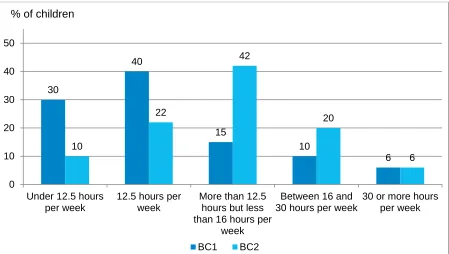
The general increase in the number of hours children spent at their main ELC provider is further demonstrated in Figure 3-1. The graph shows that the proportion of children who attended ELC for less than 12.5 hours per week decreased from 30% in BC1 to 10% in BC2, and the proportion of children who attended ELC for 12.5 hours per week decreased from 40% to 22%. Meanwhile, the proportion of children who attended ELC for more than 12.5 but less than 16 hours per week increased from 15% to 42%, and the proportion of children who attended for between 16 and 30 hours per week increased from 10% to 20%. The proportion of children who attended ELC for 30 or more hours per week stayed the same.
26
Figure 3-1 Average weekly duration of attendance at main ELC provider, by cohort
Base: All cases where child attended ELC and information about average weekly number of hours was provided. Base sizes (unweighted/weighted): BC1 = 3731/3720, BC2 = 4306/4304.
3.3.2. Duration of attendance at ELC and childcare from other providers
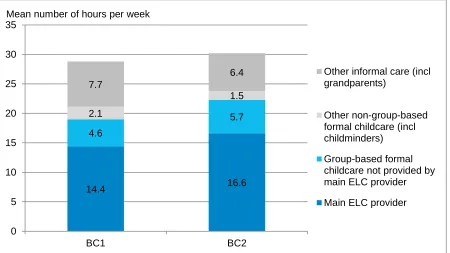
It is useful to consider how ELC use was combined with childcare from other providers (‘childcare’). Figure 3-2 shows a breakdown of weekly average childcare and ELC use for children in BC1 and BC2.27 It shows that, in both cohorts, care
27 ‘Group-based formal childcare not provided by main ELC provider’ is defined as time spent with any of the following types of providers: Private creche or nursery; Nursery class attached to primary school; Local Authority playgroup or pre-school; Local Authority creche or nursery; Private playgroup or pre-school; Community/Voluntary playgroup or pre-school; Workplace creche or nursery; Family Centre; Playscheme / summer / holiday club; Breakfast club;
‘Other non-group-based formal childcare’ is defined as care provided by any of the following: Childminder; Daily nanny at child’s home; Live-in nanny; Babysitter at child’s home; Child-carer (provided via childcare agency).
‘Other informal care’ is defined as care provided by any of the following: Child’s grandparents, Another relative, The child’s older brother or sister, A friend or neighbour.
A small number of cases with missing information about provider type were excluded from this analysis.
30
40
15
10
6 10
22
42
20
6
0 10 20 30 40 50
Under 12.5 hours per week
12.5 hours per week
More than 12.5 hours but less than 16 hours per
week
Between 16 and 30 hours per week
30 or more hours per week
BC1 BC2
provided by their main ELC provider made up a substantial proportion of the total amount of childcare and ELC a child received – half of all childcare for children in BC1 (50%) and just over half of all childcare in BC2 (55%). It also shows a number of differences between the cohorts. For example, there was a small increase in the average number of hours children attended a group-based childcare provider other than their main ELC provider (from 4.6 hours in BC1 to 5.7 hours in BC2), and a small drop in the average number of hours spent in informal care (from 7.7 to 6.4 hours per week). Overall, between 2008/09 and 2014, there was an increase not only in the time 4 year old children spent at their main ELC provider, but also in the time spent in other group-based care and in the overall time they spent in non-parental care.
Figure 3-2 Average weekly duration of attendance at ELC/childcare, by provider type and by cohort
Base: All cases where child attended ELC and information about average weekly number of hours of ELC and other childcare provision was provided. Base sizes (unweighted/weighted): BC1 =
3731/3720, BC2 = 4291/4291. All differences between the cohorts shown in the chart were statistically significant at p<.001.
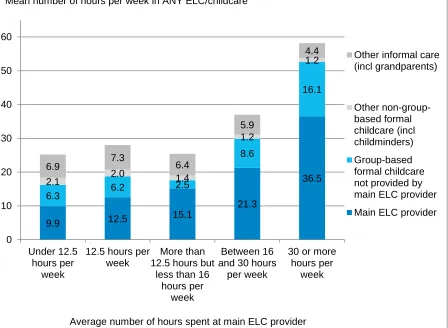
Figure 3-3 shows a further breakdown of weekly average use of childcare and ELC for children in BC2, by the average number of hours they spent at their main ELC provider. It shows some differences in use of other childcare providers according to time spent at the main ELC provider. Most prominently, it indicates that children who spent relatively long hours at their main ELC provider (30 hours or more per week) also tended to spend relatively long hours in another group-based setting (16.1 hours
14.4 16.6
4.6
5.7 2.1
1.5 7.7
6.4
0 5 10 15 20 25 30 35
BC1 BC2
Other informal care (incl grandparents)
Other non-group-based formal childcare (incl childminders)
Group-based formal childcare not provided by main ELC provider
per week on average). While these averages cover a range of children in different circumstances, the figures suggest that, on average, this relatively small group of children (around 6% of all 4 year olds in 2014) spent as much as 58 hours per week being cared for by someone other than their parent(s) or carer(s).28
28 As noted in section 2.2, the child’s main carer was asked about any regular childcare arrangements currently in place, or in place since the family was last interviewed. ‘Childcare’ was defined as “…care carried out by anyone other than yourself [or your partner]. We are interested in all types of childcare (…) including both formal and informal childcare but NOT any pre-school or early