AAEE2012CONFERENCE Melbourne, Australia www.aaee.com.au/conferences/2012/
Student Perceptions of Teammates’ Performance:
Influence of Team Formation Method
Andrew P. Wandel; and Keith Willeya.
University of Southern Queensland, Toowoomba, Australia; University of Technology, Sydney, Sydney, Australiaa Corresponding Author Email: [email protected]
BACKGROUND
This study investigates the group dynamics within the third problem-solving course in a series of four studied by on-campus and distance-education students. The cohorts were organised into teams of on-campus and distance-education students. The distance-education students were further organised into teams comprised of members from the same city or region (where possible). The motivation for this practice was to provide the opportunity for some social interaction for students who otherwise can feel isolated. Research has indicated that collocated teams tend to behave in a more socially-oriented fashion, while distributed teams tend to behave in a more task-oriented fashion. This paper is
interested in how the team formations affect peer assessments to obtain individual marks.
PURPOSE
The hypothesis is that distance-education students placed in collocated teams will tend to behave more like the on-campus students when completing and reviewing their peer assessments.
DESIGN/METHOD
Where possible, distance-education students were grouped together in the same city or otherwise in the same region; the remaining students were randomly allocated to teams. A survey was conducted at the end of semester to ascertain their experiences of the peer assessment; trends from the survey are compared across two years to provide evidence to support the hypothesis.
RESULTS
We found that to some extent the social aspects of being in a collocated team resulted in these distance-education students to treat the peer assessment in a similar manner to the on-campus students, that is they had a heightened level of interest in the outcomes and how that impacted their team. A major contributor to the collocated distance-education students’ behaviour change was the introduction in the latest offering of an initial practice (formative) peer assessment that encouraged them to critically assess at an early stage whether their team was working effectively. A low response rate for the on-campus students to this formative peer assessment delayed this influence, evident once they had completed the first summative peer assessment (after the first assignment), but it was not observed at all in the distributed distance-education students.
CONCLUSIONS
The results suggest that collocating teams improves social-orientation and collaboration by facilitating the opportunity for students to meet face-to-face. This is in contrast to random allocation of these teams that other investigations suggested were prone to be more task-oriented. This orientation directly affects how the students undertake the peer assessment task: while all students see it as an opportunity to allocate marks fairly, the collocated teams were more likely to use the review of the results as an opportunity to change their behaviour.
KEYWORDS
Introduction
The ability to work in teams is a fundamental attribute of engineers (Dowling, Carew, & Hadgraft, 2010), so universities have introduced Problem-Based Learning (PBL) courses and programmes (Du & Kolmos, 2009; Gibbings, Lidstone, & Bruce, 2010; Said, Adikan,
Mekhilef, & Rahim, 2005). However, because degrees are offered to an individual, some mechanism for assigning the team mark to each student is required; peer assessment is commonly used for this purpose (Cinar & Bilgin, 2011; Hersam, Luna, & Light, 2004; Johns-Boast & Flint, 2009; Willey & Gardner, 2010).
In a course offered in web-only mode with a class of 22 students split equally between on-campus and distance-education, Menchaca, Resta, and Awalt (2002) found that the students’ confidence in performing peer assessments increased with the number of assessments performed. They noted that gender, culture and enrolment mode all had an influence on the self- and peer-assessment, but required more study for validation. Pombo, Loureiro and Moreira (2010) studied on-campus teams who performed most of their work online (the first and last sessions were held face-to-face). They found that the students understood the assessment criteria better because of the self and peer-assessment.
It is likely that students will engage with teamwork differently depending on their life
experience. Dowling (2010) reported statistics from a survey of students enrolled at several Australian higher-education institutions. He found that most distance-education students are mature-age, have families and full-time jobs (using their study to further their careers); so they are likely to have already worked as part of a team on a project in the course of their careers. The majority of on-campus students enrol at university directly from high school, so many work part-time in a field unrelated to their study (because they have minimal
professional experience) and they are likely to have not formed a family unit. It can be expected that the mature-age student will be more pragmatic with their expectations from the teamwork. They recognise that they are isolated, so construct different relationships, being more task-oriented than the on-campus students, who can be more social because they can meet every day of the week (Yang & Jin, 2008). As a consequence, the interaction between the students is significantly different. Distance-education students are likely to hold weekly meetings outside business hours using synchronous internet communication (either textual: chat rooms; or oral: e.g. Skype), while on-campus students are likely to meet more often, during business hours and all together (Wandel, 2011). This difference in exposure increases the likelihood that on-campus students are inclined to be more careful in their dealings with each other due to the more immediate repercussions from treating a teammate unfavourably, therefore their attitudes towards peer assessment will differ.
What is yet to be studied is the behaviour of these mature-age distance-education students when they have the opportunity to work in collocated teams. It is hypothesised that these students will change their behaviour to interact more like the on-campus students and this will influence how they approach the task of assessing their peers. They are likely to take the opportunity to arrange regular face-to-face meetings and use the telephone to discuss their problems, rather than relying on a chat room or the forum, which are not as efficient in resolving issues. Those teams that are not collocated will remain more task-oriented and will consider the peer assessment more as another task to be completed, while the collocated teams will consider the social aspects of the team more and thereby use the peer
assessment as another aspect of their relationship with their teammates.
The Current Study
the same city or region) or “far” (formed into teams in the same state or randomly assigned). Examples of near external student teams were:
the northern suburbs of Brisbane (within approximately 10 km of each other) the Sunshine Coast (stretching approximately 30 km)
Canberra and south-coast NSW (approximately 200 km apart) Townsville and Cairns (approximately 300 km apart)
The motivation for this was an expression of isolation made by students to the authors and a desire to have a collegial feel through the ability to interact face-to-face. Clearly some near external teams are able to meet face-to-face more frequently, but the distances by which students are separated are not uncommon for travel in those regions and well-organised teams can make excellent use of fortnightly or monthly face-to-face meetings.
The teams completed two assignments, due the end of weeks 8 (immediately before the mid-semester break) and 12. After submission of both team assignments, students used
SPARKPLUS (Willey & Freeman, 2006) to complete self and peer assessment to rate contributions to the team project using a range of criteria such as programming and report writing. The results of these assessments were used to moderate the team mark into
individual grades. As suggested by Wandel and Willey (2011), a number of improvements to the process for the peer assessment were implemented for the 2011 offering:
1. A practice peer assessment was conducted in week 4. This used the same criteria as those used in assignment 1 so the students could familiarise themselves with the SPARKPLUS system in general and the impact of the results in particular. It also gave an opportunity for slow-starting teams and individuals to engage with the assignment.
2. The overall ratings each team member received were released to the team. This makes the process more transparent and gives the students greater satisfaction because if they thought that one of their teammates deserved a higher or lower mark then they can see that this has eventuated.
3. Students’ contributions to specific tasks necessary for successful completion of the projects were formatively assessed, with a holistic appraisal of the individual’s contribution to the technical work comprising 50% of the peer assessment. (Generic group skills such as leadership and task completion were summatively assessed.) The reason is that some teams may have an expert in a particular aspect of the project, who works exclusively on that aspect and so does not contribute to the other project tasks. Thisleads to underrating of this contributingteam member (as their contribution may have been covered by a single rating criterion). Similarly, an individual who works to a lesser extent on most project tasks may receive a skewed assessment (as their overall rating may have received contributions from ratings against the majority of criteria). Students would then have to artificially manipulate the ratings to try to equalise everyone; making a value judgement of the overall contribution avoids this problem.
Results
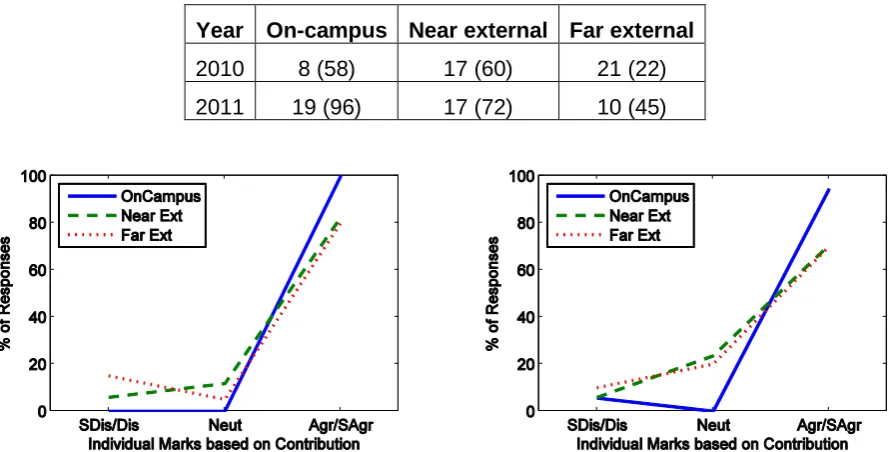
To triangulate these findings, a survey instrument was used to capture student opinions immediately after submitting the second team assignment and peer assessment. The instrument consisted of a series of Likert-scale questions and free response answers, with response rates recorded in Table 1.
much more confident in the fairness of the mark distribution (Figure 2), while the far external students had a similar mixed opinion of the process in both years. Quotes in this paper are from the 2011 survey comments.
Respondent 12 (Far external, no response): In real conditions of work a non performing member of a team usually gets culled out after a period of non performance. The team effort is reflected by the results of the team work, not an individual. Current blame mentality tries to pin failure on a person not a team and the real consequence of failure surely is improvement.
Under University conditions the test is that the individual is working for a personal gain but can thi (sic) be correct if the work is to be a team effort.
[image:4.595.75.520.323.549.2]Respondent 24 (Far external, Agree): It is hard to sometimes know how much a student has contributed. i.e. someone who is active on the forum would appear to be contributing lots, whereas someone researching or doing data collection would not.
Table 1: Total number of survey responses received for each cohort. The numbers in brackets are the total number of students in the course for that cohort still enrolled at the end of
semester.
Year On-campus Near external Far external
2010 8 (58) 17 (60) 21 (22)
[image:4.595.80.520.594.742.2]2011 19 (96) 17 (72) 10 (45)
Figure 1: Survey results for “I think that people should receive individual marks based on the value of their contribution”. Left: 2010; right: 2011.
Table 2: Responses to certain questions only posed to the 2011 cohort. The numbers are the number of respondents, with the corresponding percentage of that cohort in brackets.
No. Question Cohort SAgr/Agr Neutral SDis/Dis
1 I think that the Practice Peer Assessment increased my understanding of the process
On-Campus 12 (67%) 6 (33%) 0 (0%)
Near External 11 (65%) 5 (29%) 1 (6%)
Far External 3 (30%) 3 (30%) 4 (40%)
2 I think that assessing engineering skills holistically made it easier to
give a fair assessment
On-Campus 12 (67%) 5 (28%) 1 (6%)
Near External 10 (59%) 6 (35%) 1 (6%)
Far External 5 (50%) 3 (30%) 2 (20%)
3 I think that the Practice Peer Assessment helped my team
work together better
On-Campus 5 (28%) 6 (33%) 7 (39%)
Near External 8 (47%) 5 (29%) 4 (24%)
Far External 1 (10%) 4 (40%) 5 (50%)
4 I liked seeing what score everyone in the team received
On-Campus 15 (88%) 1 (6%) 1 (6%)
Near External 9 (53%) 7 (41%) 1 (6%)
Far External 5 (56%) 1 (11%) 3 (33%)
Some other comments indicated a lack of understanding of the process, so further training of the students is warranted. Nonetheless, the changes made to the procedure have had a positive impact. Two-thirds of on-campus and near external students had their
understanding of the peer assessment process improved due to the practice peer
assessment (Table 2 Question 1); only the far external cohort had significant disagreement on this point (40%), but the relatively lower number of respondents yields a positive outcome overall. So the students could use the formative assessment to better understand how the process works when it came to completing the summative assessments. They also found that they were not constrained into one model for how a team might work. They therefore could complete the assessment without having to artificially adjust ratings for specific tasks in order to provide a balanced assessment (between half and two-thirds of students agreed that this was a preferable method of assessing: Table 2 Question 2).
Figure 3: Survey results for “Our team met face-to-face approximately”. Responses are: A, Never; B, Once per month; C, Once per week; and D, More than once per week. Left, 2010;
right, 2011.
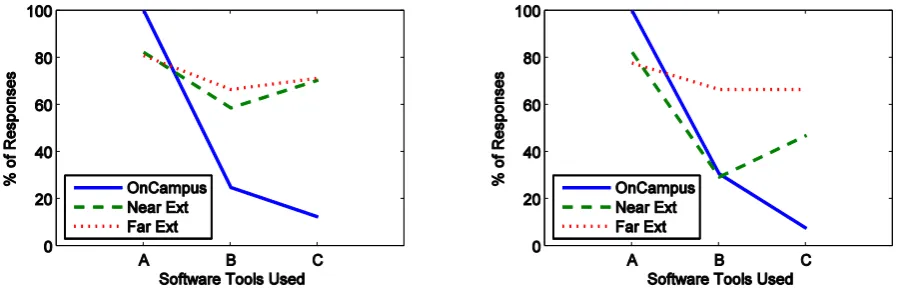
Figure 4: Survey results for “I used the following software tools to communicate with my group”. Note that respondents could select more than one option. Options were: A, Forum;
B, Chat room; and C, Online talking (e.g. Skype). Left, 2010; right, 2011.
Respondent 17 (Near external, A): I appreciated having teams selected based on geographical location as, even though in this instance face to face contact wasn’t used for the entire group to get together, we had the option. It has also enabled me to network with other young engineers in my region which I’m sure will prove valuable in the future.
Respondent 19 (Near external, B): (I liked that the teams were formed with a…) Common geographical area – the comfort to know that if you need to meet one-on-one the option is available.
The frequency with which students met face-to-face correlates directly with a reduced reliance on the internet to communicate synchronously (Figure 4 options B and C). In 2010, about half of near external students did not meet face to face, which dropped to one-in-six in 2011. This meant that half as many students used a chat room, while two-thirds as many used internet talking. The distance-education students are more likely to talk online than use textual synchronous communication, while the reverse is the case for the on-campus
students. This could be because on-campus students are likely to be using a computer lab or common area (where it is not good etiquette to be talking), while external students are probably at home (alone in the room).
[image:6.595.72.521.281.426.2]may be due to these students being more task-oriented (and making good progress) from the outset, so did not require the extra incentive of the mark distribution to contribute well to the project.
Figure 5: Survey results for “After the first peer assessment, I tried to make my contribution more equal”. Left: 2010; right: 2011.
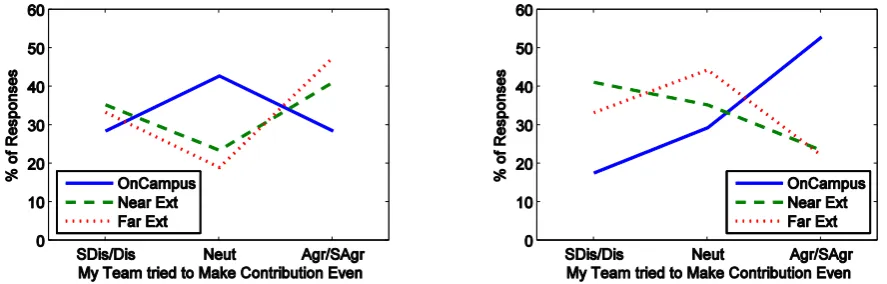
Figure 6: Survey results for “Because of the first peer assessment, my team tried to assign tasks more evenly”. Left: 2010; right: 2011.
The teams of near externals in 2011 were least inclined to try to redistribute the work (Figure 6), which is probably due to the improvements they had enacted after the practice peer assessment: half of the near external students thought that their team worked together better at this stage (Table 2 Question 3). This contrasts with the on-campus students, where slightly more thought that the practice peer assessment had no influence on how their team worked, while virtually none of the far external students thought that there was an influence. It seems that the near external students were the slowest to commence their projects, but the impact of the practice assessment supplied the necessary motivation to commit to the task, making a correction after the assignment unnecessary. The survey responses associated with the following quotes were for Figure 5, Figure 6 and Table 2 Question 3:
Respondent 17 (Near external, Strongly Agree, Disagree, Agree): I think it encourages people to contribute fully.
Respondent 19 (Far external, Agree, Neutral, Neutral): I’m not convinced it improves team performance because I believe our team was committed from the start.
Respondent 23 (On-campus, Disagree, Agree, Disagree): It shook people into realising that the other members actually know that they don’t contribute
[image:7.595.76.520.307.449.2]have been motivated by the lecturer announcing that the practice assessment was not compulsory. The low submission rate meant that many teams had only one or two members who completed assessments, which is not very beneficial for drawing conclusions on those teams’ structure and performance. As a consequence, it was difficult to attempt to effect any improvements at that stage.
The responses to the question "I like seeing what score everyone in the team received” (listed in Table 2 Question 4) suggest that the social aspect of the collocated teams produces a much greater propensity to want to share the outcomes because of the greater potential to influence the behaviour of the other members in the team. The task-oriented far external students are more likely to want to “get on with business” and so are less concerned with this aspect (one-third actively disliking it). The confidence that maturity and experience brings to the external students (Wandel & Willey, 2011) means that an overwhelming majority of on-campus students (88%) wanted to know what everyone else scored, while a significant proportion of the near external students were ambivalent (41%).
Future Work
It has been observed that the drop rate (the number of students who withdraw partway through semester) in this course for those assigned to a near external team is negligible (one or two students for 15–20 teams) compared to the far external allocations (approximately one student for every two teams). The few students from the near external teams who drop tend to announce this to their teams, including an apology for leaving the team one member short as a consequence of them having to drop. By contrast, many of the far external students merely drop the course without any communication and it is up to the lecturer to keep track of who has dropped and notify the teams. The authors propose two hypotheses for this
difference: the first is that the more motivated students have actively sought to be part of a near external team, therefore they will naturally remain enrolled in all of their courses (the splitting of the cohort has segregated the students most likely to drop the course within the far external teams). The second is that they are encouraged by the knowledge that they will be in a collocated team—with its corresponding social interaction—and therefore do not want to miss out on this opportunity which rarely occurs for the distance-education student (the splitting of the cohort has changed the behaviour of some of the students in the near external teams). If the second hypothesis is true, then this has implications for course and degree retention and completion rates for distance-education students.
In the 2012 offering of the course, teams were allocated after the first census date (end of week 4), since the majority of students drop by this date. Future studies will investigate the impact this has on student behaviour and performance.
Conclusions
References
Cinar, Y., & Bilgin, A. (2011). Peer Assessment for Undergraduate Teamwork Projects in Petroleum Engineering. International Journal of Engineering Education, 27(2), 310–322.
Dowling, D. (2010). The career aspirations and other characteristics of Australian para-professional
engineering students. Paper presented at the Proceedings of the 21st Annual Conference for the
Australasian Association for Engineering Education, Sydney.
Dowling, D., Carew, A., & Hadgraft, R. (2010). Engineering your future: an Australasian Guide. Brisbane: John Wiley & Sons.
Du, X., & Kolmos, A. (2009). Increasing the diversity of engineering education – a gender analysis in a PBL context. European Journal of Engineering Education, 34(5), 425 - 437.
Gibbings, P., Lidstone, J., & Bruce, C. (2010). How do student attributes influence the way students experience problem-based learning in virtual space? Australasian Journal of Engineering
Education, 16(1), 69–80.
Hersam, M. C., Luna, M., & Light, G. (2004). Implementation of Interdisciplinary Group Learning and Peer Assessment in a Nanotechnology Engineering Course. [Article]. Journal of Engineering
Education, 93(1), 49-57.
Johns-Boast, L., & Flint, S. (2009). Providing students with 'real-world' experience through university
group projects. Paper presented at the Proceedings of the 20th Annual Conference for the
Australasian Association for Engineering Education, Adelaide.
Menchaca, M., Resta, P., & Awalt, C. (2002). Self and Peer Assessment in an Online Collaborative
Learning Environment. Paper presented at the Proceedings of World Conference on E-Learning in
Corporate, Government, Healthcare, and Higher Education 2002, Montreal, Canada.
Pombo, L., Loureiro, M. J., & Moreira, A. (2010). Assessing collaborative work in a higher education blended learning context: strategies and students’ perceptions. Educational Media International, 47(3), 217 - 229.
Said, S. M., Adikan, F. R. M., Mekhilef, S., & Rahim, N. A. (2005). Implementation of the problem-based learning approach in the Department of Electrical Engineering, University of Malaya.
European Journal of Engineering Education, 30(1), 129-136.
Wandel, A. P. (2011). Team Formation by Region to Improve Outcomes for Distance-Education
Students in a PBL Course. Paper presented at the FIE 2011, Rapid City, SD.
Wandel, A. P., & Willey, K. (2011). Peer review of teamwork for encouraging equal commitment to the
group effort. Paper presented at the Proceedings of the 22nd Annual Conference for the
Australasian Association for Engineering Education, Perth.
Willey, K., & Freeman, M. (2006). Improving Teamwork and Engagement: the Case for Self and Peer Assessment. Australasian Journal of Engineering Education, 12, 2006-2002.
Willey, K., & Gardner, A. (2010). Investigating the capacity of self and peer assessment activities to engage students and promote learning. European Journal of Engineering Education, 35(4), 429-443.
Yang, M. C., & Jin, Y. (2008). An Examination of Team Effectiveness in Distributed and Co-located Engineering Teams. International Journal of Engineering Education, 24(2), 400–408.
Acknowledgement
The first author is grateful to the Engineering Education Research Group (EERG) at USQ for financial support in attending the conference.