Alternative Methods for the Reduction of Evaporation: Practical
Exercises for the Science Classroom
Peter Schouten1,2#, Sam Putland1, Charles J. Lemckert1, Alfio V. Parisi3 and Nathan Downs1,2.
1School of Engineering, Griffith University, Gold Coast, Australia.
2 Centre for Rural and Remote Area Health, University of Southern Queensland, Toowoomba, Australia.
3
Australian Centre for Sustainable Catchments, University of Southern Queensland, Toowoomba, Australia.
#
to whom correspondence should be addressed email [email protected]
Keywords: Evaporation, monolayers, destratification, covers, plumes, practical.
Short title: Evaporation studies for the science classroom.
ABSTRACT
INTRODUCTION
Evaporation is the process of a substance changing from a liquid to a vapour phase at the liquid surface at a temperature below its boiling point [1]. The rate of evaporation occurring across the surface of any given water body is affected by various factors, which include: relative humidity (atmospheric water vapour loading), wind velocity and fetch, solar radiation input, air temperature, water surface area, surrounding land uses and also the apparent influence of wide scale climatological events influenced by changes in the global climate [2]. Existing evaporation mitigation techniques are continually being designed, developed and implemented to better protect water from evaporation processes in order to ensure that one of our most valuable natural resources is saved for the benefit of future generations. Three such evaporation mitigation techniques that have recently been re-evaluated and tested for real-world deployment are bubble plume systems, chemical film monolayers and floating hard covers.
Bubble Plumes: The dynamics of bubble plumes and the implications of their use have been investigated in both controlled and natural environments [3]. Stratification is the thermal and physical formation of layers in a water column. Stratification tends to occur in the warmer months of the year, and results in a warmer surface layer that leads to higher evaporation rates [4]. Destratification (by bubble plume systems) can be used as a method for enhancing water quality by reversing the effects of thermal stratification in lakes and reservoirs and as such may be utilised to reduce evaporation. Specifically, destratification breaks up the stable layers by mechanical mixing, resulting in increased water quality, and reduced surface water temperatures, ultimately leading to lower evaporative rates [5].
Floating Hard Covers: Floating covers provide a highly effective means of evaporation mitigation [6]. Floating covers are usually modular in structure allowing them to merge together across a water surface to provide near complete coverage. Evaporation is suppressed by the physical barrier between the water surface and the atmosphere. Specifically, studies have shown that evaporative reductions ranging from 70 to 75% can be delivered by floating modular covers over an extended time period [7].
Aquatain (www.aquatain.com.au) products and also octadecanol (stearyl alcohol) suspension.
FIGURE 1
Following on from the experiment series detailed by Schouten et al [9], the following manuscript details a laboratory project designed for senior high school Physics, general science classes and first year university environmental Physics courses, which has been developed to introduce students to the concepts of evaporation, evaporation modelling, atmospheric monitoring and water loss mitigation. Specifically, these ideas are delivered by performing a series of simple and inexpensive experiments simulating the large-scale deployment of both chemical films/monolayers and floating hard covers on a small water tank under user defined atmospheric and hydrodynamic conditions, including varying surface wind speeds and underwater bubble plumes set to changing flow rates. Following experimentation, the results can be compared to a widely used evaporation model and an evaluation of which evaporation mitigation mechanism will provide the best overall performance in a real-world water reserve can be detailed.
METHOD AND IMPLEMENTATION Equipment
Access to a temperature and humidity controlled room or enclosure is required in order to keep the surrounding atmosphere consistent between each experiment, which will allow for results from each trial to be readily compared. Specifically, any sufficiently sized room with an air conditioning system coupled with a dehumidifier will be ideal. Alternatively a laboratory fume cabinet could be used as a small scale controlled atmosphere environment.
A small water tank filled with clean tap water will be needed to test the evaporation mitigation mechanisms. For this, any tank with dimensions greater then 300 mm x 200 mm x 200 mm will be required. A deeper tank may be necessary if the effect of stratification/destratification is to be studied in greater detail, as the effect of water column mixing may not be as apparent at smaller depths. In order to induce mixing within the water inside the tank, a simple water aeration/bubble plume system may be used. If a water aeration/bubble plume system is not available, a simple water pump device can be used as an alternative to recirculate the water instead. These systems are readily available from aquarium stores and are inexpensive. If the flow rate delivered by the water aeration/bubble plume system is not given by the manufacturer, an experiment to calculate it is defined in the ‘Measurement of Flow Rate from the Water Aeration System’ section.
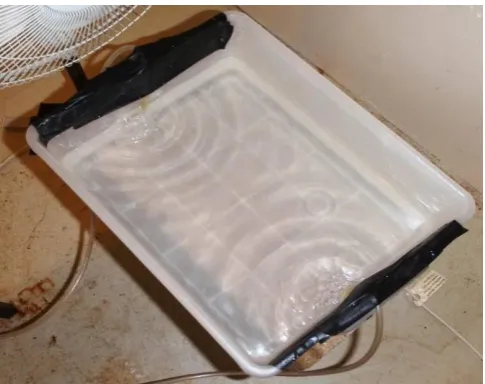
anemometer is not readily available a simple wind speed experiment can be carried out which is further detailed in the ‘Measurement of Wind Velocity’ section. Water vapour (humidity) can be measured with an inexpensive hygrometer and local ambient and water surface temperatures can be monitored using a bulb thermometer. Water surface temperature measurements can be approximated by placing the end of the thermometer approximately 1 to 2 mm beneath the waterline. Evaporation can be monitored by measuring the water level change in the tank at the start and at the end of each experiment with a digital Vernier scale. Figure 2 displays an example experimental configuration with a dual output water aeration/bubble plume system attached to a small water tank, with a fan positioned just above the water surface.
FIGURE 2
One or more evaporation suppressing monolayers/chemical films will be required to test their performance properties and also to investigate how they perform when used in conjunction with the water aeration/bubbler system. In the experiments detailed in this manuscript, the authors employed the WaterSavr and Aquatain chemical films. These films can be replaced by other suitable evaporation suppressing chemicals such as hexadecanol or octadecanol that can be purchased from Sigma Aldrich (www.sigmaaldrich.com). To simulate the deployment of floating hard covers on the water surface, ping pong balls can be used. Figure 3 shows an example of how a set of ping pong balls can be positioned across the water surface during an experiment. Notice how the ping pong balls are tightly packed (with some slack) allowing for minimal surface water to be exposed to the atmosphere, similar to how floating covers would be positioned across a real-world water reserve.
FIGURE 3
The outlets from the water aeration/bubbler system should be attached to the tank so that they extend down to the lowest depth possible. Air flow from the outlet should be directed upwards perpendicular to the tank base so that adequate mixing can take place throughout the water column. Ensure that the bubbles produced do not create too much spray at the water surface, as this can inadvertently increase water loss throughout an experiment. Also, as shown in Figure 4, the outlet bubblers may create a capillary wave pattern on top of the water surface, not dissimilar to a point source flow regime.
FIGURE 4 Modelling
desired. One such model that can be employed is provided by Smith et al [10]:
H
P
P
U
E
W A
30
.
6
32
.
1
(1)where E is the evaporation rate in kilograms per metre squared per hour, U is the wind speed propagating over the water surface in metres per second, PW is the saturation
vapour pressure at the current water temperature in units of mm Hg, PA is the
saturation vapour pressure at the air dew point temperature in units of mm Hg and H is the latent heat of water at the water temperature in the tank in units of kJ per kg.
To calculate the saturation vapour pressure values required in (1) the following formula can be used [11]:
T
T
e
P
6
.
112
17.62 / 243.12 (2)where P is pressure in units of hPa and T is the air temperature in units of degrees Celsius. To evaluate the air dew point temperature (TD) as required by equation (1),
the following approximation can be employed:
271
.
17
7
.
237
DT
(3)where is given by:
100 ln 7 . 237 271 . 17 RH T T
(4)with T being the air temperature in degrees Celsius and RH is the relative humidity.
Measurement of Evaporation
1. Apply the fastest wind speed to the water tank. Record the exact water level at the start of the experiment;
2. Measure the evaporation after a 24 to 48 hour interval. If necessary, this time interval can be reduced to 5 to 10 hours (the duration of a working day). Note that evaporative losses occurring over this short time interval will only be detectable if the localised air temperature is relatively high;
3. After the fastest wind speed experiment, measure the evaporation occurring over the same time interval for the remainder of the speed settings on the fan;
4. Perform a final trial with no wind applied to the water tank in order to obtain a baseline evaporation value;
5. Begin another series of experiments by separately deploying the monolayers/chemical films and the ping pong balls to the surface of the water in the tank;
6. Continue measuring evaporation occurring over the necessary time interval for each of the different fan wind speed settings. Also run a baseline trial with no wind applied to the water tank so an evaporation value can be obtained for the monolayers/chemical films and the ping pong balls;
with the water aeration/bubbler system set to a number of different flow rates. The authors of this manuscript ran experiments with the outlet flow rate fixed to its absolute highest and lowest settings (referred to as max. bubble and min. bubble respectively in Figure 5 and Figure 6);
8. Ensure that at the beginning and at the end of each experiment a value for air temperature, water surface temperature and relative humidity is measured and recorded.
Measurement of Wind Velocity
If an anemometer is not available for use the students can perform a simple laboratory based activity to evaluate the approximate wind velocities generated by each fan setting. The methodology for this activity is as follows:
1. Place the fan in an area where it is unobstructed by any surrounding objects; 2. Use a metre ruler and a permanent pen to mark out a distance extending from the
base of the fan to a point exactly 1 metre away from the fan; 3. Drop the fan down to its lowest possible position;
4. Switch the fan on to its maximum setting;
5. Place a very light item with a relatively small surface area such as a feather or a small square of paper as close as possible to the fan propellers;
6. Release the light item;
7. As soon as the light item is released using a stop watch or a watch timer measure the time taken for the light item to travel from the fan propellers to the end of the 1 metre point away from the fan;
8. After the propagation time of the lightweight item has been measured the wind velocity generated by the fan can be calculated by using the well known equation for velocity:
Time nt Displaceme
Velocity (5)
9. After the wind velocity has been calculated for the maximum fan setting, continue this measurement process until velocities have been evaluated for all of the remaining fan settings.
Measurement of Mass Flow Rate from the Water Aeration System
If the mass flow rate from the water aeration/bubbler system has not been provided by the manufacturer, it will need to be calculated. This can be done by completing the following steps:
1. Use an anemometer to measure the air velocity just outside the opening of the output tube;
water aeration/bubbler system and release the small square of paper. Measure the distance travelled by the paper and record its time of travel with a stop watch. From these measurements equation (5) can be used to provide an estimate of outlet velocity;
3. After measuring the outlet velocity, the following equation can be used to estimate the mass flow rate delivered by the water aeration/bubbler system:
vA
m
.
(6) where
m is the mass flow rate in units of kg/hr, is the density of air at the current room temperature given in kg/m3 and A is the cross-sectional area of the tube from which the air exits in units of m2. The density of air at a given temperature can be obtained from lookup tables found in the majority of senior school and first year Physics and Chemistry text books.
This method can be replaced by another if needed. Students could be asked to develop their own mass flow rate measurement technique. If a water pump is being used, one such alternative could be to measure the time it takes to half fill an empty polythene bag with the water exiting from the water pump. Following this the bag can be placed in a tub of water of known volume, from which a volume displacement estimate can be made. As a result the volumetric flow rate can be readily calculated and converted to mass flow rate if required.
Data Analysis
Students can complete the graphing and modelling work required for this exercise on paper or by using Microsoft Excel. The data analysis phase may be completed in the following order:
1. Average air, relative humidity and water temperature values for each experiment can be plotted on separate graphs if desired;
2. Complete a series of regression line graphs displaying the evaporation measurements obtained in the tank after the application of different wind speeds and mass flow rates for each evaporation mitigation mechanism for each separate trial (y axis = evaporation rate; x axis = wind speed). Figure 5 (A), Figure 5 (B) and Figure 5 (C) each displays a series of evaporation profiles with each evaporation measurement made corresponding to each particular wind speed. Calculate the R2 value for each regression line in order to determine the correlation between wind velocity and evaporation;
4. The students can discuss reasons why their measured evaporation data differed from or corroborated with the modelled evaporation data by obtaining the original journal articles describing the evaporation models. From this the student will be able to gain an increased understanding behind the development of each particular model and as a result will be able to better detail why they may or may not have predicted the levels of evaporation. A discussion should also be performed detailing reasons why one chemical film/monolayer performed better than the other and why the water bubbler/aeration system did or did not inhibit the evaporative process;
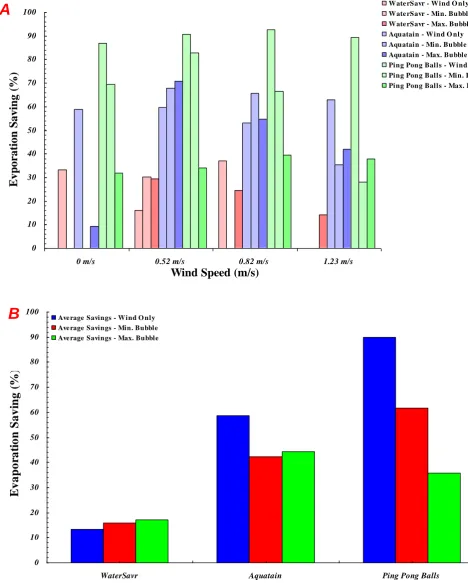
5. Plot the calculated evaporation percentage savings for each of the evaporation mitigation systems under each particular wind speed on the same graph (y axis = evaporation percentage saving; x axis = wind speed). An example of this type of graph is shown in Figure 6 (A);
6. As shown in Figure 6 (B), students can analyse the data in further detail by plotting another bar graph of the averaged evaporation percentage savings for each of the evaporation mitigation systems in relation to each of the water aeration/bubbler system settings analysed throughout the experiment series (y axis = evaporation percentage saving; x axis = type of evaporation mitigation mechanism). From this analysis the most successful evaporation mitigation mechanism will be readily deduced.
FIGURE 5 FIGURE 6 SUMMARY
From the results obtained from the experiments it is clear to see that under almost all conditions the floating hard covers (modelled by the ping pong balls) provide on average the most substantial evaporative savings in comparison to the two chemical films tested. Out of the two chemical films, Aquatain generally performed better than WaterSavr, due to its increased coverage thickness. Also, it was found that the synergistic use of the evaporation reduction mechanisms and the water aeration/bubbler system did not reduce evaporation rates, and may have had the reverse effect by gradually enhancing water loss. Students should obtain results similar to these. However, the effect of the water aeration/bubbler system on evaporation patterns may be dependent upon the flow rate produced and also the depth of the water tank. The dependency of evaporation on water depth can be further investigated in extended experiments.
and humidity must be measured on a consistent basis throughout each experiment in order to ensure that these parameters, after averaging, are as accurate as possible when they are input into the evaporation model.
Acknowledgements
The Authors of the article would like to thank the Urban Water Security Research Alliance for funding this project.
REFERENCES
[1] Britannica 2011 Evaporation (viewed 2 March 2011:
http://www.britannica.com/EBchecked/topic/1516731/evaporation).
[2] Queensland Department of Natural Resources and Mines 2002 Current knowledge and developing technology for controlling evaporation from on-farm storage Technical Report National Program for Irrigation Research and Development. [3] Lemckert C J and Imberger J 1993 Energetic bubble plumes in arbitrary
stratification J. Hydraul. Eng. 119(6) 680-703.
[4] Helfer F, Zhang H and Lemckert C 2009 Enhancing reservoir management through the use of mechanical evaporation reduction techniques Proceedings of the 2009 SSEE International Conference: Solutions for a Sustainable Planet (Melbourne: Australia) pp 22-24.
[5] Van Dijk M and van Vuuren S J 2009 Destratification induced by bubble plumes as a means to reduce evaporation from open impoundments Water SA. 35(2)
158-167.
[6] Craig I 2007 Loss of storage water through evaporation with particular reference to arid and semi-arid zone pastoralism in Australia DKCRC Working Paper 19 The WaterSmart Literature Reviews Desert Knowledge CRC.
[7] Jennison I 2003 Methods for reducing evaporation from storages used for urban water supplies GHD Department of Natural Resources and Mines Queensland Technical Report.
[8] Schouten P W, Palada C, Lemckert C J, Sunartio D and Solomon D H 2011 Analysis of chemical film monolayers under wind and wave conditions Proceedings of the 34TH IAHR World Congress 2011 (Brisbane: Australia). [9] Schouten P W, Lemckert C J, Parisi A V, Downs N, Underhill I. and Turner, G
2011 Variable wind speed and evaporation rates: A practical and modelling exercise for high school physics and multi-strand science classes Teaching
Science 57(2) 47-51.
[10] Smith C, Lof G and Jones R 1994 Measurement and analysis of evaporation from an outdoor swimming pool Sol. Energy 53(1) 3-7.
[11] World Meteorological Organization 2008 Guide to Meteorological Instruments and Methods of Observation WMO-No. 8 Technical Report.
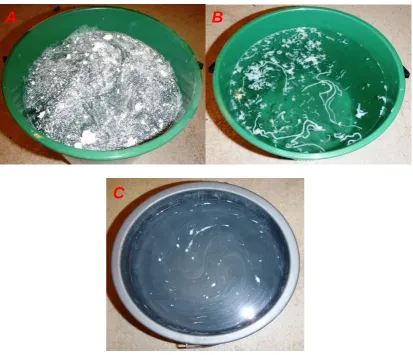
Figure 1: A) WaterSavr chemical film unevenly spread out over a water surface. B) Aquatain chemical film randomly distributed over a water surface. C) Octadecanol monolayer spread on top of a water surface.
Figure 2: An example experimental setup with the fan positioned close to the surface of the small water tank and the water aeration/bubbler system, with its two air outlets attached at opposite ends of the small tank wall.
A
B
[image:10.595.184.417.506.690.2]Figure 3: Ping pong balls in formation across the small water tank used in the experiments.
[image:11.595.177.420.72.260.2] [image:11.595.177.420.332.524.2]0.00 0.02 0.04 0.06
0 0.2 0.4 0.6 0.8 1 1.2 1.4
Wind Speed (m/s)
E
v
a
p
o
ra
ti
o
n
(
k
g
/h
o
u
r)
Wind O nly Evap. - No Supre ssion Wind O nly Evap. - Wate rSavr Wind O nly Evap. - Aquatain Wind O nly Evap. - Ping Pong Balls Mode lle d Evap.
0.00 0.02 0.04
0 0.2 0.4 0.6 0.8 1 1.2 1.4
Wind Speed (m/s)
Eva
pora
tion
(kg/
hou
r)
Min. Bubble r Evap. - No Suppre ssion Min. Bubble r Evap. - Wate rSavr Min. Bubble r Evap. - Aquatain Min. Bubble r Evap. - Ping Pong Balls
A
0.00 0.02 0.04 0.06
0 0.2 0.4 0.6 0.8 1 1.2 1.4
Wind Speed (m/s)
E
v
a
p
o
ra
ti
o
n
(
k
g
/h
o
u
r)
Max. Bubble r Evap. - No Suppre ssion Max. Bubble r Evap. - Wate rSavr Max Bubble r Evap. - Aquatain Max. Bubble r Evap. - Ping Pong Balls
Figure 5: Evaporation profiles measured for the following scenarios - A) Baseline trials with no air flow supplied underneath the water (the water bubbler turned off). B) Trials performed with air flow delivered into the water column from the water bubbler set to its lowest setting (1.27 x 10⁻² kg/hour). C) Trials performed with air flow delivered into the water column from the water bubbler set to its highest setting (1.69 x 10⁻² kg/hour). The modelled data shown in A) is from the equation for evaporation in indoor swimming pools given by [10] detailed in equation (1). It appears in this case that the model has overestimated the evaporation occurring in the tank.
[image:13.595.94.547.84.350.2]0 10 20 30 40 50 60 70 80 90 100
0 m/s 0.52 m/s 0.82 m/s 1.23 m/s
Wind Speed (m/s)
Evp orati on Sav ing (%)
Wate rSavr - Wind O nly Wate rSavr - Min. Bubble Wate rSavr - Max. Bubble Aquatain - Wind O nly Aquatain - Min. Bubble Aquatain - Max. Bubble Ping Pong Balls - Wind O nly Ping Pong Balls - Min. Bubble Ping Pong Balls - Max. Bubble
0 10 20 30 40 50 60 70 80 90 100
WaterSavr Aquatain Ping Pong Balls
E v a p o ra ti o n S a v in g ( %)
[image:14.595.89.558.78.662.2]Ave rage Savings - Wind O nly Ave rage Savings - Min. Bubble Ave rage Savings - Max. Bubble
Figure 6: A) Percentage evaporative savings measured in each particular experiment provided by each of the evaporation reduction systems. B) Evaporative savings given by each of the evaporation reduction systems averaged for each of the three hydrodynamic settings (water bubbler turned off, water bubbler set to minimum setting, water bubbler set to maximum setting).