Open Access
Research article
Adapting a Markov Monte Carlo simulation model for forecasting
the number of Coronary Artery Revascularisation Procedures in an
era of rapidly changing technology and policy
Haider R Mannan*
1,2, Matthew Knuiman
2and Michael Hobbs
2Address: 1Department of Epidemiology & Preventive Medicine, School of Public Health & Preventive Medicine, Monash University, The Alfred,
Melbourne, Victoria 3004, Australia and 2School of Population Health, University of Western Australia, Perth, WA, Australia
Email: Haider R Mannan* - [email protected]; Matthew Knuiman - [email protected]; Michael Hobbs - [email protected]
* Corresponding author
Abstract
Background: Treatments for coronary heart disease (CHD) have evolved rapidly over the last 15 years with considerable change in the number and effectiveness of both medical and surgical treatments. This period has seen the rapid development and uptake of statin drugs and coronary artery revascularization procedures (CARPs) that include Coronary Artery Bypass Graft procedures (CABGs) and Percutaneous Coronary Interventions (PCIs). It is difficult in an era of such rapid change to accurately forecast requirements for treatment services such as CARPs. In a previous paper we have described and outlined the use of a Markov Monte Carlo simulation model for analyzing and predicting the requirements for CARPs for the population of Western Australia (Mannan et al, 2007). In this paper, we expand on the use of this model for forecasting CARPs in Western Australia with a focus on the lack of adequate performance of the (standard) model for forecasting CARPs in a period during the mid 1990s when there were considerable changes to CARP technology and implementation policy and an exploration and demonstration of how the standard model may be adapted to achieve better performance.
Methods: Selected key CARP event model probabilities are modified based on information relating to changes in the effectiveness of CARPs from clinical trial evidence and an awareness of trends in policy and practice of CARPs. These modified model probabilities and the ones obtained by standard methods are used as inputs in our Markov simulation model.
Results: The projected numbers of CARPs in the population of Western Australia over 1995–99 only improve marginally when modifications to model probabilities are made to incorporate an increase in effectiveness of PCI procedures. However, the projected numbers improve substantially when, in addition, further modifications are incorporated that relate to the increased probability of a PCI procedure and the reduced probability of a CABG procedure stemming from changed CARP preference following the introduction of PCI operations involving stents.
Conclusion: There is often knowledge and sometimes quantitative evidence of the expected impacts of changes in surgical practice and procedure effectiveness and these may be used to improve forecasts of future requirements for CARPs in a population.
Published: 25 June 2008
BMC Medical Informatics and Decision Making 2008, 8:27 doi:10.1186/1472-6947-8-27
Received: 10 October 2007 Accepted: 25 June 2008
This article is available from: http://www.biomedcentral.com/1472-6947/8/27
© 2008 Mannan et al; licensee BioMed Central Ltd.
Background
Coronary heart disease (CHD) still remains the largest single cause of death and a major cause of morbidity in most developed countries [1]. Although rates of myocar-dial infarction have fallen in most developed countries, hospital admission rates for CHD have continued to rise [2,3]. The treatment of CHD has meanwhile evolved, first with the widespread uptake of effective short and long-term medical treatment [4] and then with greater use of coronary artery revascularisation procedures (CARPs) [3,4] which started with coronary artery bypass grafting (CABG) during the 1970s and evolved with percutaneous coronary interventions (PCI) with the introduction and rapid use of percutaneous transluminal coronary angi-oplasty in the early 1980s, coronary artery stents in 1995 and more recently drug eluting stents [5]. The use of stents has contributed to a decline in the risk of a repeat CARP following PCI [5] while drug-eluting stents may lead to further reductions in these risks [6,7]. Based on several randomized controlled trials, CARPs are more effective than medical treatment in reducing mortality and mor-bidity from CHD [8,9].
There is great variation in rates of CARPs within and between populations with comparable rates of CHD [10,11]. Because of this uncertainty it is important to develop probabilistic methods that model the require-ments for CARPs at the population level by capturing movement of individuals from one CHD/CARP state to another based on the epidemiology and natural history of CHD. This can be modelled by using Markov Monte Carlo simulation.
This study is facilitated by the availability of a unique Western Australian health information system which allows identification and linkage of hospital admission and deaths records pertaining to single individuals, thereby providing a complete event history for CHD patients [12]. In a previous paper we have described and outlined the use of a Markov Monte Carlo simulation model for predicting CHD incidence and requirements for CARPs for the Western Australian population [13]. In this paper, we expand on the use of this model for fore-casting CARPs in Western Australia with a focus on how the standard model may be adapted to achieve better fore-casting performance if anticipated changes are incorpo-rated. The 1995 Western Australian population cohort is used to illustrate this approach with comparison of the predicted and actual numbers of CARPs performed over the period 1995 to 1999.
Methods
Statewide datasets comprising (linked) cardiovascular hospital admissions for all persons who had a cardiovas-cular-related admission for the period 1980 to 2001
together with all deaths and population census informa-tion were used to establish CHD/CARP event history for population cohorts and estimate (population) probabili-ties of certain CHD and CARP events and deaths [13].
Under the Markov Monte Carlo simulation approach, for the cohort comprising the population of Western Aus-tralia aged 35–79 years at the beginning of 1995, model simulations are conducted to predict the number of CARPs (and other CHD events) that occur within the cohort over the next 5 years. Under our Markov model the cohort is split into initial history state groups (using their known CHD/CARP history from the linked health infor-mation system data back to 1980). The history states are (1) a history of having a PCI some time in the past; (2) a history of having a CABG some time in the past; (3) a his-tory of having a CHD admission but no CABG or PCI some time in the past; and (4) no history of CHD admis-sion, CABG or PCI in the past. In the context of forecast-ing, population transition probabilities that have been estimated for past years (eg 1992 to 1994) are extrapo-lated into future years for which forecasts are required (eg 1995 to 1999). These extrapolated probabilities are used within the model to simulate events among cohort mem-bers into the future (and taking into account the ageing of the cohort). At the end of the first cycle people could have moved to a different disease history state or moved into one of two possible death (absorbing) states, namely (5) death from CHD or (6) death from causes other than CHD. Within a cycle, our model allows for a CHD admis-sion without a CARP, up to two admisadmis-sions with CABG or PCI in addition to possible death (Figure 1). A more detailed description of the model and the estimation of population transition probabilities have been provided elsewhere [13].
The forecast number of events is based on the average of 100 replicate simulations of the entire cohort [13]. The accuracy of the total forecast number of CABGs and PCIs is evaluated using the percent over- or under- compared to the total actual number. The accuracy of forecasts across age and sex groups is evaluated by calculating a goodness-of-fit (GOF) observed-predicted chi-squared statistic. The smaller the GOF statistic the better are the model fore-casts. We used SAS version 9.0 [14] for calculating the sim-ulation inputs and TreeAge Data Pro 2005 for Markov simulation modelling [15].
No ethical approval was required for the project as the data for this project were already provided to the research-ers by the Data Linkage Unit of the WA Department of Health.
Results
Table 1 shows the number and history distribution of the WA 1995 population cohort. Overall 93.1% of men and 96.1% of women were in the 'no history of CHD' state but this varied from 99.2% in 35–39 year old men to 76.2%
Schematic diagram for the recognised events during a cycle (year)
Figure 1
Schematic diagram for the recognised events during a cycle (year). History
No CHD adm CABG CHD
adm
CABG PCI
CHD death Non-CHD death
[image:3.612.53.557.502.730.2]PCI
Table 1: Age and sex distribution of the population of Western Australia for 1995
Sex Age group Hist no CHD Hist CHD Hist CABG Hist PCI Total Population
Male 35–39 70144 461 28 52 70685
Male 40–44 66197 818 100 142 67257
Male 45–49 61080 1290 294 314 62978
Male 50–54 44866 1689 506 445 47506
Male 55–59 34500 2048 779 563 37890
Male 60–64 27557 2522 1092 585 31756
Male 65–69 23852 2930 1309 576 28667
Male 70–74 17646 3097 1184 398 22325
Male 75–79 10297 2345 667 206 13515
Female 35–39 70024 301 6 4 70335
Female 40–44 66195 472 16 19 66702
Female 45–49 58333 632 29 46 59040
Female 50–54 42960 937 60 84 44041
Female 55–59 34614 1265 130 119 36128
Female 60–64 29418 1592 204 169 31383
Female 65–69 26848 2073 388 261 29570
Female 70–74 22407 2610 431 250 25698
in 75–79 year old men and from 99.6% in 35–39 year women to 84.6% in 75–79 year old women.
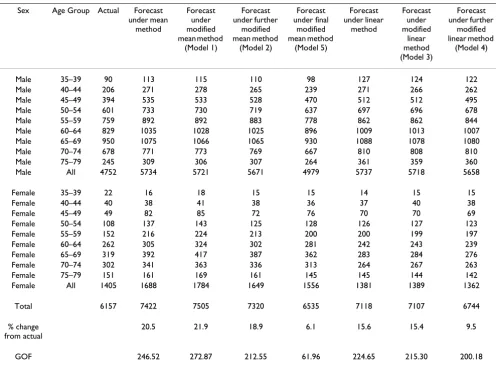
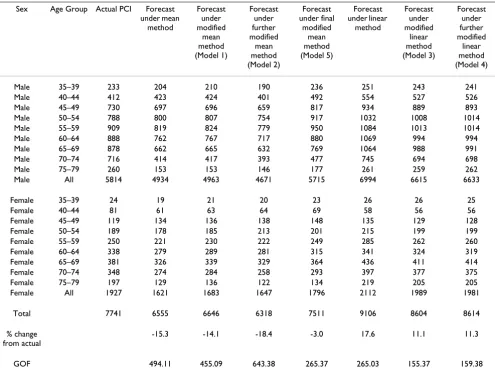
Tables 2 and 3 show the actual and forecast number of CABGs and PCIs respectively for the standard models. The results show that the mean method overestimates the total actual number of CABGs by 20.5 percent and the lin-ear method by 15.6 percent. The GOF values are reasona-bly close for the two methods. The forecast numbers of PCIs from the mean method under-estimates the actual number of PCIs by 15.3 percent and the linear method over-estimates by 17.7 percent. The GOF value is consid-erably larger for the mean method.
The poor performance of these standard methods for fore-casting the requirements of CARPs over 1995–99 may be due to the fact that the effectiveness of PCIs increased after 1994 when stents were first introduced in WA and as a result the probability of requiring another CARP within the same year was reduced. Within the model these are represented by risk of a CABG or another PCI in the same
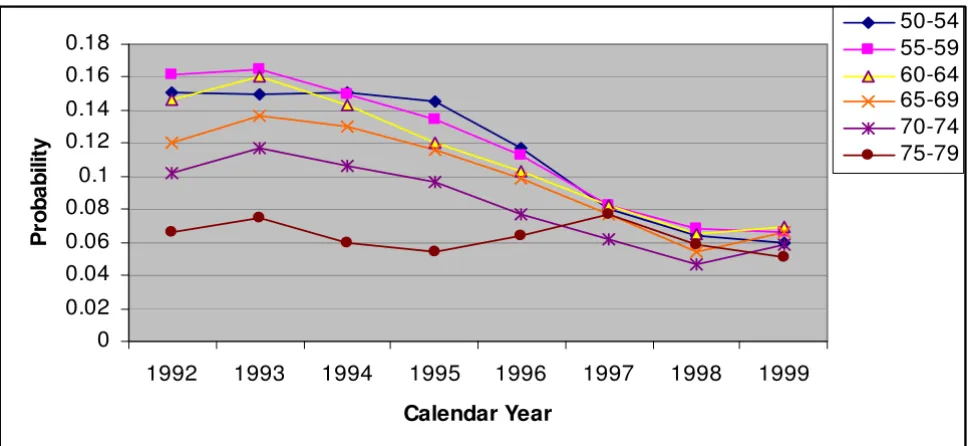
year following a PCI procedure. For both males and females, the trends in these probabilities for the largest history group 'no history of CHD' are shown in Figures 2a, 2b, 3a and 3b. It is clear that the trend over the period 1992 to 1994 did not continue into 1995–1999 and hence the standard extrapolation methods would not be accurate for these probabilities.
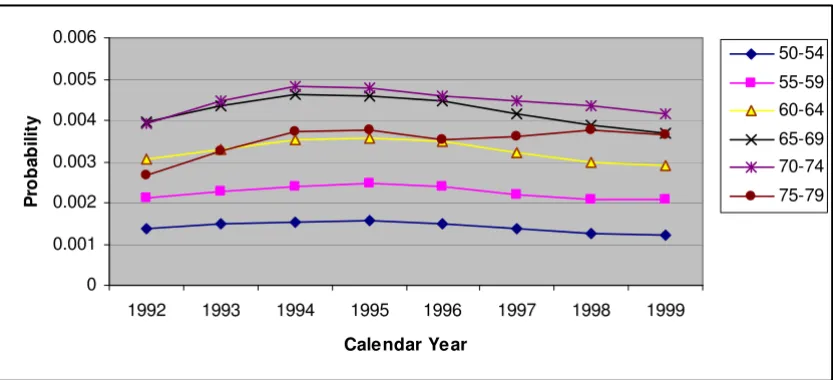
[image:4.612.56.552.364.731.2]Another explanation for the poor performance of the standard methods was that there was an increasing trend in PCI rates during the early 1990s as the number of facil-ities performing PCIs increased and this continued until about 1995 [6]. This, together with the increasing effec-tiveness of PCIs meant that many more PCIs but fewer CABGs were being performed. Within the model these are captured by risk of a CABG and risk of a PCI. For both sexes, the trends in these risks for the 'no CHD history' group are shown in Figures 4a, 4b, 5a and 5b. It is clear that the risk of a CABG and that of a PCI gradually declined and increased respectively after 1994 for most age groups 50–54 and above (the trends for younger age
Table 2: Comparison between actual numbers of CABGs and forecast numbers (1995–1999) based on the standard Mean and Linear extrapolation methods as well as selected modifications of these methods
Sex Age Group Actual Forecast under mean
method
Forecast under modified mean method
(Model 1)
Forecast under further
modified mean method
(Model 2)
Forecast under final
modified mean method
(Model 5)
Forecast under linear
method
Forecast under modified
linear method (Model 3)
Forecast under further
modified linear method
(Model 4)
Male 35–39 90 113 115 110 98 127 124 122
Male 40–44 206 271 278 265 239 271 266 262
Male 45–49 394 535 533 528 470 512 512 495
Male 50–54 601 733 730 719 637 697 696 678
Male 55–59 759 892 892 883 778 862 862 844
Male 60–64 829 1035 1028 1025 896 1009 1013 1007
Male 65–69 950 1075 1066 1065 930 1088 1078 1080
Male 70–74 678 771 773 769 667 810 808 810
Male 75–79 245 309 306 307 264 361 359 360
Male All 4752 5734 5721 5671 4979 5737 5718 5658
Female 35–39 22 16 18 15 15 14 15 15
Female 40–44 40 38 41 38 36 37 40 38
Female 45–49 49 82 85 72 76 70 70 69
Female 50–54 108 137 143 125 128 126 127 123
Female 55–59 152 216 224 213 200 200 199 197
Female 60–64 262 305 324 302 281 242 243 239
Female 65–69 319 392 417 387 362 283 284 276
Female 70–74 302 341 363 336 313 264 267 263
Female 75–79 151 161 169 161 145 145 144 142
Female All 1405 1688 1784 1649 1556 1381 1389 1362
Total 6157 7422 7505 7320 6535 7118 7107 6744
% change from actual
20.5 21.9 18.9 6.1 15.6 15.4 9.5
groups are not shown as these risks are low), for both sexes.
In order to incorporate modifications to the standard extrapolation methods relating to the increased effective-ness of PCI procedures (ie the decreased risk of requiring a second CARP within the same year) we have examined the clinical trial evidence for the improved effectiveness of PCIs with stents. The results of a meta-analysis of 29 RCTs by Brophy et al. [16] indicate that risk of a repeat PCI would have declined by 41 percent in Western Australia from 1995 due to the introduction of stents. The observed risks for the Western Australian population showed that the risk of a CABG after a PCI also declined by 41 percent and thus we also reduce this risk accordingly.
To quantify the changed trends for PCI and CABG rates we use evidence from a population based observational study in Western Australia which showed that for males risk of a PCI increased by about 25 percent and risk of a CABG
declined by about 15 percent when stents were introduced in WA in 1995 [5]. For females, there were similar shifts but the magnitude was about half that in males.
To accommodate these changed trends we have modified the standard extrapolated probabilities for these events by the amounts indicated by the evidence. Forecasts based on the following modified models have been obtained and the results are shown in Tables 2 and 3.
Model 1: the annual risk of a repeat PCI declines by 41 percent while the other risks are mean extrapolated,
Model 2: the annual risk of a repeat PCI and risk of a CABG given PCI decline by 41 percent while the other risks are mean extrapolated,
[image:5.612.57.552.109.483.2]Model 3: the annual risk of a repeat PCI declines by 41 percent while the other risks are linearly extrapolated,
Table 3: Comparison between actual numbers of PCIs and forecast numbers (1995–1999) based on the standard Mean and Linear extrapolation methods as well as selected modifications of these
Sex Age Group Actual PCI Forecast under mean
method
Forecast under modified
mean method (Model 1)
Forecast under further modified
mean method (Model 2)
Forecast under final
modified mean method (Model 5)
Forecast under linear
method
Forecast under modified
linear method (Model 3)
Forecast under further modified
linear method (Model 4)
Male 35–39 233 204 210 190 236 251 243 241
Male 40–44 412 423 424 401 492 554 527 526
Male 45–49 730 697 696 659 817 934 889 893
Male 50–54 788 800 807 754 917 1032 1008 1014
Male 55–59 909 819 824 779 950 1084 1013 1014
Male 60–64 888 762 767 717 880 1069 994 994
Male 65–69 878 662 665 632 769 1064 988 991
Male 70–74 716 414 417 393 477 745 694 698
Male 75–79 260 153 153 146 177 261 259 262
Male All 5814 4934 4963 4671 5715 6994 6615 6633
Female 35–39 24 19 21 20 23 26 26 25
Female 40–44 81 61 63 64 69 58 56 56
Female 45–49 119 134 136 138 148 135 129 128
Female 50–54 189 178 185 213 201 215 199 199
Female 55–59 250 221 230 222 249 285 262 260
Female 60–64 338 279 289 281 315 341 324 319
Female 65–69 381 326 339 329 364 436 411 414
Female 70–74 348 274 284 258 293 397 377 375
Female 75–79 197 129 136 122 134 219 205 205
Female All 1927 1621 1683 1647 1796 2112 1989 1981
Total 7741 6555 6646 6318 7511 9106 8604 8614
% change from actual
-15.3 -14.1 -18.4 -3.0 17.6 11.1 11.3
Model 4: the annual risk of a repeat PCI and risk of a CABG given PCI decline by 41 percent while the other risks are linearly extrapolated, and
Model 5: the annual risk of a repeat PCI and risk of a CABG given PCI decline by 41 percent and risk of a PCI increases by 25 percent for males or 12.5 percent for females with a corresponding decline in risk of a CABG by
a. Plot for risk of CABG within same year following a PCI, for people with no history of CHD by calendar year, for males with different age groups
Figure 2
a. Plot for risk of CABG within same year following a PCI, for people with no history of CHD by calendar year, for males with different age groups. b. Plot for risk of CABG within same year following a PCI, for people with no history of CHD by calendar year, for females with different age groups
0 0.005 0.01 0.015 0.02 0.025 0.03 0.035 0.04 0.045
1992 1993 1994 1995 1996 1997 1998 1999
Calendar Year
P
ro
b
a
b
il
it
y
50-54
55-59
60-64
65-69
70-74
75-79
0
0.01
0.02
0.03
0.04
0.05
0.06
0.07
1992
1993
1994
1995
1996
1997
1998
1999
Calendar Year
P
ro
b
a
b
ilit
y
50-54
55-59
60-64
65-69
70-74
15 percent for males or 7.5 percent for females while the other risks are mean extrapolated.
The results show that the forecast numbers of PCIs under Model 1 become closer to the respective actual numbers compared to standard mean extrapolation although the
discrepancies are still generally quite large. Also, this mod-ification does not improve the forecasts for CABGs. The forecasts for numbers of CABGs and PCIs under Models 2, 3 and 4 improve only marginally. There is over-estimation in the actual number of CABGs by 21.9, 18.9, 15.4 and 9.5 percents respectively under Models 1, 2, 3 and 4. There is
[image:7.612.63.547.94.317.2]a. Plot for risk of a repeat PCI within same year, for people with no history of CHD by calendar years, for males with different age groups
Figure 3
a. Plot for risk of a repeat PCI within same year, for people with no history of CHD by calendar years, for males with different age groups. b. Plot for risk of a repeat PCI within same year, for people with no history of CHD by calendar years, for females with different age groups
0
0.02
0.04
0.06
0.08
0.1
0.12
0.14
0.16
0.18
1992
1993
1994
1995
1996
1997
1998
1999
Calendar Year
P
ro
b
a
b
ilit
y
50-54
55-59
60-64
65-69
70-74
75-79
0 0.02 0.04 0.06 0.08 0.1 0.12 0.14 0.16 0.18 0.2
1992 1993 1994 1995 1996 1997 1998 1999
Calendar Year
P
ro
b
a
b
il
it
y
50-54
55-59
60-64
65-69
70-74
under-estimation in the actual number of PCIs by 14.1 and 18.4 percents respectively under Models 1 and 2, and over-estimation by 11.1 and 11.3 percents under Models 3 and 4.
As the forecasts under Model 3 which use linear extrapo-lations seriously overestimated the numbers of PCIs the linear method was not further considered. Model 5, which
also incorporates modifications to risk of a PCI and risk of a CABG has considerably better forecasts. There is now only 6.1 percent over-estimation of number of CABGs under Model 5 while for PCIs there is an under-estimation by only 3 percent.
[image:8.612.92.509.94.284.2]a. Plot for risk of a CABG within a year, for people with no history of CHD by calendar year, for males with different age groups
Figure 4
a. Plot for risk of a CABG within a year, for people with no history of CHD by calendar year, for males with different age groups. b. Plot for risk of a CABG within a year, for people with no history of CHD by calendar year, for females with different age groups
0 0.001 0.002 0.003 0.004 0.005 0.006
1992 1993 1994 1995 1996 1997 1998 1999
Calendar Year
P
ro
b
ab
il
it
y
50-54
55-59
60-64
65-69 70-74
75-79
0 0.0002 0.0004 0.0006 0.0008 0.001 0.0012 0.0014 0.0016 0.0018
1992 1993 1994 1995 1996 1997 1998 1999
Calendar Year
P
rob
a
b
il
it
y
50-54
55-59
60-64
65-69
70-74
Discussion
In this paper we have examined forecasts for 1995–1999 based on extrapolation of trends from 1992–94. This was done because actual event numbers were known for these years and to illustrate the need to modify the standard methods in a period like this when there were rapid changes in CARP surgical technology and practice. How-ever, the limitations of the retrospective nature of this study should be acknowledged. We believe that the
mod-ifications could have been anticipated in 1995 when knowledge of increased PCI effectiveness was becoming available and the changing preference for PCI over CABG was common knowledge among cardiologists and cardio-thoracic surgeons. However, quantifying the impacts of these expected changes in 1995 would have been more difficult than in our illustration which used evidence pub-lished after 1995.
a. Plot for risk of a PCI, for people with no history of CHD by calendar year, for males with different age groups
Figure 5
a. Plot for risk of a PCI, for people with no history of CHD by calendar year, for males with different age groups. b. Plot for risk of a PCI, for people with no history of CHD by calendar year, for females with different age groups
0 0.0005 0.001 0.0015 0.002 0.0025 0.003 0.0035 0.004 0.0045 0.005
1992 1993 1994 1995 1996 1997 1998 1999
Calendar Year
P
roba
bi
li
ty
50-54 55-59 60-64 65-69 70-74 75-79
0 0.0002 0.0004 0.0006 0.0008 0.001 0.0012 0.0014 0.0016 0.0018 0.002
1992 1993 1994 1995 1996 1997 1998 1999
Calendar Year
P
ro
b
a
b
ilit
y
50-54
55-59
60-64
65-69
70-74
Our CHD/CARP model does not directly incorporate the effects of risk factors such as blood pressure, cholesterol, obesity and smoking on event risks. Whilst cohort-based models that incorporate risk factors have been proposed (eg, Sesso et al. [17]) it is not practical to incorporate risk factors directly into our model because it has 96 different risks (for each age and sex group) and thus 96 risk factor models would be required. Further, as our model simu-lates individual pathways, such an approach would also require risk factor data on the entire population of West-ern Australia. However, our model can still indirectly incorporate changes in trends in risk factors by appropri-ate modification of model probabilities that relappropri-ate to risk of certain CHD events (eg for people currently with no history of CHD).
Using the approach of modifying selected and relevant model event probabilities, our model is flexible enough to explore the effect on the future requirements of CARPs of a variety of changing circumstances. In addition to advances in surgical procedures and changing preference for surgical procedures as we have illustrated, other sce-narios such as changes in the effectiveness of, and access to, medical treatments may be investigated. For example, randomized controlled trials have shown that there were significant reductions in requirements for CARPs among higher risk individuals who were given antiplatelet ther-apy versus controls [18]. An example of a possible change in health policy related to treating CHD patients could be the availability of low cost statins [19]. Since the cost of the Australian Pharmaceutical Benefit Scheme which sub-sidizes the cost of statin drugs has been increasing rapidly, the government may change its current policy and only provide subsidy to people at higher risk of CHD. The effect of these changes relating to medical treatments could be investigated using our CHD/CARP model through modifications to selected and relevant model probabilities.
The CHD/CARP model can also be extended and used to determine the cost of future requirements for CARPs and to explore the most cost-effective strategies for treatment of CHD. To achieve this, indicative cost estimates are needed for each of the alternative CARP treatments for each year. For more description of cost effectiveness anal-ysis one can refer to some studies which have evaluated economic impact of drug-eluting stents [20,21], and cost effectiveness of CHD prevention through CHD risk reduc-tion strategies [22].
Conclusion
It is clear from the model simulation results that forecast-ing events in an era of rapid changes is fraught with diffi-culties and standard extrapolation methods are not likely to perform well in such situations. However, there is often
knowledge and sometimes quantitative evidence of the expected impacts of changes in procedure effectiveness and practice and these may be used to modify the stand-ard forecasting methods to achieve better forecasts as we have illustrated. The simulation results implied that mod-ifications that related to the changing relative use of a PCI to a CABG were more important for correctly projecting the numbers of CARPs than modifications that related only to the increased effectiveness of PCI procedures.
Competing interests
The authors declare that they have no competing interests.
Authors' contributions
HRM did all aspects of this research work as part of his doctoral dissertation including model design, develop-ment, implementation, and analysis and also wrote the draft of this paper. MK supervised the research project giv-ing valuable inputs in the model design and concept and finally helped draft the paper. MH was involved as a co-supervisor.
Acknowledgements
The first author would like to acknowledge International Postgraduate Research Scholarship (IPRS) for providing him with support for this research project which formed his Doctoral dissertation at the University of Western Australia. The data for this project were provided by the Data Linkage Unit of the WA Department of Health. The initial part of this project was funded by a grant from the National Health and Medical Research Council of Australia (Project grant no. 139100).
References
1. World Health Organization: World health report: reducing risks, promoting healthy life. Geneva: WHO; 2002.
2. Kovar MG, Collins JH, Dolozier J, Havlik R, Pokras R: Trends in the availability and Use of Medical Care for Coronary Heart ease and Related Diseases. Trends in Coronary Heart Dis-ease Mortality. In The Influence of Medical Care Edited by: Millicent W, Higgins RVL. Oxford, Oxford University Press; 1988.
3. Gillam R, Gillum B, Francis C: Coronary revascularization and coronary angiography in the United States: trends in sora-dial differences. Journal of the American College of Cardiology 1997,
29:1557-62.
4. Martin CA, Hobbs MS, Armstrong BK, De Klerk NH: Trends in the incidence of myocardial infarction in Western Australia between 1971 and 1982. American Journal of Epidemiology 1989,
129:655-68.
5. Hobbs MST, McCaul KA, Knuiman MW, Rankin JM, Gilfillan I: Trends in coronary artery revascularization procedures in Western Australia, 1980–2001. Heart 2004, 90(9):1036-1041.
6. Morice MC, Serruys PW, Sousa JE, Fajadet J, Ban Hayashi E, Perin M, Colombo A, Schuler G, Barragan P, Guagliumi G, Molnar F, Falotico R: Randomized Study with the Sirolimus-Coated Bx Velocity Balloon-Expandable Stent in the Treatment of Patients with de Novo Native Coronary Artery Lesions. New England Journal of Medicine 2002, 346(23):1773-80.
7. Grube E, Silber S, Hauptmann KE, Mueller R, Buellesfeld L, Gerckens U, Russell ME: TAXUS I: six- and twelve-month results from a randomized, double-blind trial on a slow-release paclitaxel-eluting stent for de novo coronary lesions. Circulation 2003,
107(1):38-42.
8. Yusuf S, Zucker D, Peduzzi P, Fisher LD, Takaro T, Kennedy JW:
Collabora-Publish with BioMed Central and every scientist can read your work free of charge "BioMed Central will be the most significant development for disseminating the results of biomedical researc h in our lifetime."
Sir Paul Nurse, Cancer Research UK
Your research papers will be:
available free of charge to the entire biomedical community
peer reviewed and published immediately upon acceptance
cited in PubMed and archived on PubMed Central
yours — you keep the copyright
Submit your manuscript here:
http://www.biomedcentral.com/info/publishing_adv.asp
BioMedcentral
tion [see comments] [published erratum appears in Lancet 1994 Nov 19, 344(8934):1446]. Lancet 1994, 344(8922):563-70. 9. RITA-2: Coronary angioplasty versus medical therapy for angina: the second Randomised Intervention Treatment of Angina (RITA-2) trial. RITA-2 trial participants. Lancet 1997,
350(9076):461-8. [see comments]
10. Anderson GM, Grumbach K, Luft HS, Roos LL, Mustard C, Brook R:
Use of coronary artery bypass surgery in the United States and Canada. Influence of age and income. JAMA 1993,
269(13):1661-6.
11. Higginson LA, Naylor CD: Rates of cardiac catheterization, cor-onary angioplasty and corcor-onary artery bypass surgery in Canada. Canadian Journal of Cardiology 1997, 13(Suppl D):47D-52D.
12. Holman CD, Bass AJ, Rouse IL, Hobbs MS: Population-based link-age of health records in Western Australia: development of a health services research linked database, Australia and New Zealand. Journal of Public Health 1999, 23:453-9.
13. Mannan HR, Knuiman MW, Hobbs M: A Markov simulation model for analysing and forecasting the number of coronary artery revascularization procedures in Western Australia.
Annals of Epidemiology 2007, 17(12):964-975. 14. SAS, version 9.0. SAS institute: Cary, NC.
15. Treeage Pro: Treeage Pro User's Manual. Treeage software Inc., 1075 Main Street, Williamstown, MA 01267; 2005.
16. Brophy JM, Belisle P, Joseph L: Evidence of use of coronary stents: A hierarchical Bayesian meta-analysis. Annals of Internal Medicine 2003, 138:777-786.
17. Sesso HD, Chen RS, L'Italien GJ, Lapuerta P, Lee WC, Glynn RJ:
Blood Pressure Lowering and Life Expectancy Based on a Markov Model of Cardiovascular Events. Hypertension 2003,
42:885.
18. Antiplatelet Trialists' Collaboration: Collaborative overview of randomised trials of antiplatelet therapy–II: Maintenance of vascular graft or arterial patency by antiplatelet therapy. Antiplatelet Trialists' Collaboration [see comments]. British Medical Journal 1994, 308(6922):159-68.
19. Lipid Management Guidelines – 2001: National Heart Foundation of Australia and Cardiac Society of Australia and New Zea-land. Medical Journal of Australia 2001, 175:S57-85.
20. Shrive FM, Manns BJ, Galbraith Knudtson ML, Ghali WA: Economic evaluation of sirolimus-eluting stents. Canadian Medical Associa-tion Journal 2005, 172(3):345-351.
21. Kong DF, Eisenstein EL, Sketch MH, Zidar JP, Ryan TJ, Harrington RA, Newman MF, Smith PK, Mark DB, Califf RM: Economic impact of drug-eluting stents on hospital systems: A disease-state model. American Heart Journal 2204, 147(3):449-456.
22. Whitfield M, Gillett M, Holmes M, Ogden E: Predicting the impact of population level risk reduction in cardio-vascular disease and stroke on acute hospital admission rates over a 5 year period – a pilot study. Public Health 2006, 120(12):1140-1148.
Pre-publication history
The pre-publication history for this paper can be accessed here: