The internal reliability of some City & Guilds tests
A project report prepared by City & Guilds and its research partners for the
Office of Qualifications and Examinations Regulation
Andrew Boyle The City and Guilds of London Institute
Zeeshan Rahman The City and Guilds of London Institute
Ofqual/13/5257
January 2013
Contents
Executive summary ... 1
Introduction ... 4
Review ... 5
Method ...33
Findings ...49
Discussion ...62
Conclusions and recommendations ...71
References ...73
Tables
Table 1: Interpretation of Rasch model parameter-level mean-square fit statistics ...23
Table 2: Reliability indices used in the project, with strengths and weaknesses ...30
Table 3: Checklist for reporting reliability claims ...31
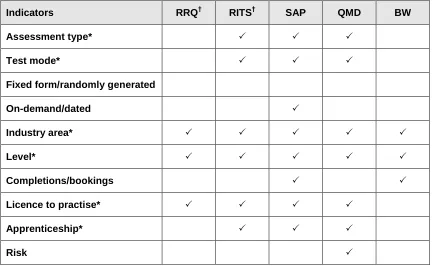
Table 4: Availability of indicators across databases ...40
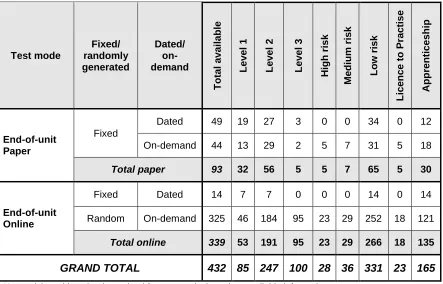
Table 5: Tests available for analysis by taxonomy indicators ...41
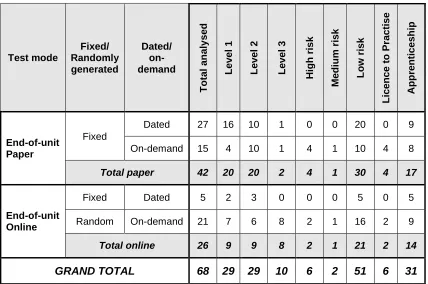
Table 6: Tests analysed by taxonomy indicators ...42
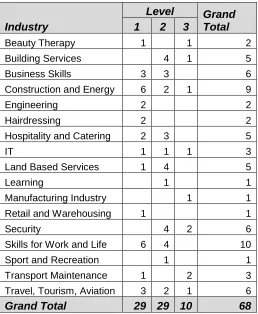
Table 7: Industry areas of analysed tests, pivoted against level ...43
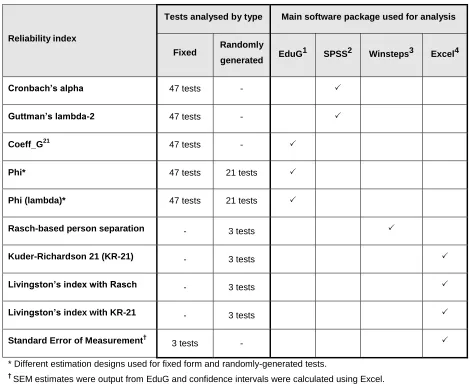
Table 8: Number of tests by reliability indices and software packages used ...46
Table 9: Number of tests analysed by type of distribution ...51
Table 10: Mean reliability indices for tests with leptokurtic and mesokurtic distributions ...57
Table 11: Selected tests to show relationship between phi and phi (lambda) ...58
Table 12: Illustration of KR-21, Rasch and Livingston’s index ...59
Table 13: List of tests and features ...84
Table 14: Summary statistics for paper fixed dated tests ...86
Table 15: Summary statistics for paper fixed on-demand tests ...87
Table 16: Summary statistics for online fixed dated tests ...88
Figures
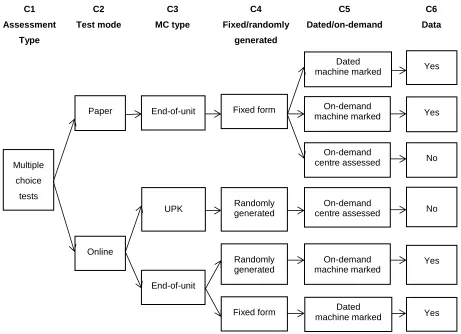
Figure 1: Relationship between selected variables in the taxonomy ...36
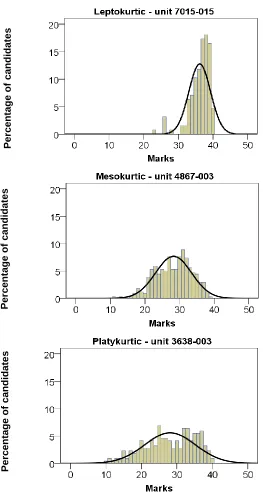
Figure 2: Histograms of a leptokurtic, mesokurtic and platykurtic score distribution ...50
Figure 3: Distribution of Cronbach’s alpha for fixed form tests ...52
Figure 4: Distribution of Guttman’s lambda-2 for fixed form tests ...53
Figure 5: Distribution of phi for all tests ...54
Figure 6: Distribution of phi (lambda) for all tests ...55
Figure 7: Mean reliability indices by test type ...56
Figure 8: Score distribution with cut score and mean score for unit 1122-001 ...60
Figure 9: Score distribution with cut score and mean score for unit 3692-303 ...60
Acknowledgments
We would like to thank Sandra and Rod Johnson at Assessment Europe for providing technical expertise and reviewing the report.
Executive summary
This document reports a research project conducted by the City and Guilds of London Institute, supported by its research partners Assessment Europe and the Institute for Employment Studies between October 2011 and March 2012 under tender number 126 let by the Office of Qualifications and Examinations Regulation (Ofqual). Ofqual’s project title was ‘the estimation of internal reliability’.
This report starts with a review section, which begins by outlining the history and current status of vocational qualifications (VQs) and noting that VQs have always been on a ‘parallel but separate track’ to academic examinations. VQs are supported by their particular conceptions of quality, which can be judged on their own merits. The conceptualisations of quality underpinning VQs pre-date recent government interventions, and can be evaluated notwithstanding those interventions. Most commentators on the qualifications scene agree that government intervention in qualifications has increased over the past 30 or so years. However, there was never a ‘golden age’ of no intervention, and the merits of VQs have to be argued substantively; it is not enough to simply blame botched interventions for perceived weaknesses.
The review goes on to describe key concepts underlying VQ assessment. The two main concepts are competence-based assessment and criterion-referenced testing (CRT). The former’s importance is that English VQs have been said to address this concept since their inception. However, the elaboration of competence-based assessment gives few direct hints about which reliability techniques would be the most appropriate for analysis. In contrast, there is a substantial psychometric literature suggesting suitable reliability indices for CRTs.
Procedures are then described for selecting a sample of tests upon which to conduct reliability analysis along with appropriate indices to express the reliability of the tests. The findings were as follows:
68 tests were analysed. These were balanced across (QCF) levels 1, 2 and 3. The sample also included qualifications of varying risk status, and qualifications that had licence to practise functions and which formed parts of apprenticeship programmes.
47 of the analysed tests were fixed form (all candidates received the same
Cronbach’s alpha coefficient and Guttman’s lambda-2 index were calculated for the 47 fixed form tests. The mean values and standard deviations of the coefficients were almost identical in the two cases: mean of 0.79 for alpha and 0.80 for lambda-2, with standard deviations of 0.11 and 0.10 respectively.
The phi dependability coefficient for absolute measurement and the phi (lambda) coefficient (a dependability coefficient adjusted to account for the presence of a cut score – lambda) were calculated for all 68 tests in the sample. Mean values were 0.72 and 0.88, respectively, with standard deviations of 0.14 and 0.12.
The reliabilities for different forms of tests were compared. Paper fixed form tests appeared to provide the highest reliability values, whereas online randomly-generated tests appeared to provide the lowest indices amongst the assessment types. However, no test was conducted to establish whether this difference was statistically significantly different.
The reliability of data sets with different types of kurtosis were compared. There did not appear to be major differences between leptokurtic (steeply peaked) data sets and mesokurtic (those data sets whose peakedness was within the range of the normal distribution).
Other reliability techniques were implemented on small numbers of tests for
exemplification. These techniques were: Livingston’s index and the Standard Error of Measurement (SEM) (along with 95% confidence intervals – CIs).
Several observations are offered in the discussion of findings, plus a number of recommendations. These are:
The report, following that of Harth & Hemker (2011), and in parallel to the City & Guilds partner project in the current round of tenders (Johnson et al, 2012), adds significantly to the emerging body of reliability research on VQs.
The analyses indicate that VQs can provide reliable outcomes. The mean values for Cronbach’s alpha in this project were very similar to those returned in reliability analysis of GCSEs and A levels.
Selecting a sample of tests for analysis was inhibited by inconsistencies between regulatory and awarding body databases. City & Guilds and Ofqual should review and update their respective databases in light of the issues raised in this report and work collaboratively to do so where this is mutually advantageous.
The classical test theory index Cronbach’s alpha is a starting point for reliability analysis. It has limitations – particularly when applied to CRTs – but its ubiquity and ease of calculation mean that all credible awarding organisations should be able to calculate and interpret it.
We did not find Guttman’s lambda-2 index to add much to alpha, and would not recommend its operational use by awarding organisations.
Phi (lambda) has similar philosophical bases to phi and thus appears to be useful. It also has the potential to ‘bundle’ absolute measurement and an adjustment to account for a cut score in a single index. This may make it a very efficient and parsimonious index for VQ purposes. However, awarding organisations may consider that this ‘bundling’ creates confusion and may prefer to keep the classification and dependability aspects of reliability estimation distinct.
Livingston’s index is a less defensible squared error loss index than phi (lambda), but it could be used (with suitable health warnings) by an awarding body that was not able to calculate phi (lambda).
The derivation of the SEM and associated CIs is a reputable technique to show the reliability of test outcomes as defined in score precision. The interpretation of the amount of score precision necessary depends upon context. High score precision in other assessed elements within a qualification might mitigate low precision within the measurement from a knowledge test.
We noted two concerns for estimating the reliability of CRT outcomes which need to be thought through. When scores were ‘bunched’ in only a section of the scoring scale reliability indices should – in principle – be low. Also, a mean score that was very close to a cut score ought to be a concern – suggesting high levels of
Introduction
Basis for this study
This research report is the final output of research undertaken in response to an invitation to tender (ITT) issued by the Office of Qualifications and Examinations Regulation (Ofqual) on 17th June 2011 (Ofqual, 2011a). In its specification of requirements, Ofqual stated the research aims and objectives as follows:
While previous research on the Reliability Programme explored mainly the use of Cronbach’s alpha as a measure of internal reliability, research funded under this specification is intended to generate estimates for a range of internal reliability indices for a selection of assessments. The research may involve the following activities:
To select a range of assessments where it can reasonably be expected that test-related unreliability represents the major source of measurement error. For example, tests and examinations that are composed of multiple choice questions (MCQs) and/or short-answer constructed responses that can be objectively marked may be investigated.
To produce estimates for a range of internal reliability indices for the selected assessments.
To analyse, interpret, compare and report on the reliability evidence generated.
To assess the practical applications of the specific estimation techniques used in the research. (Ofqual, 2011a, p. 1)
In its successful response to Ofqual’s ITT, City & Guilds claimed that their approach would afford Ofqual the following benefits:
An opportunity to rectify the previous under-representation of [vocational qualification] VQ assessments in reliability research.
An opportunity to sponsor research based on large sets of suitable tests.
An opportunity to derive meaningful and coherent descriptions of tests – rectifying inconsistencies in current awarding body and regulatory databases.
The application of a range of reliability indices to test score data, including the use of diverse indices beyond the commonly used Cronbach’s alpha.
An understanding of fundamental issues in vocational and – indeed – all forms of assessment; relationship between [Criterion Referenced Testing1] CRT and [Norm Referenced Testing] NRT, role of knowledge testing in VQs, empirical
1
basis for statements about competence-based assessment, etc. (City & Guilds, 2011a, p. 11)
As the final output from this project, this report seeks to deliver on the promise stated above.
Structure of this report
This report begins with a review of the history and current status of technical education and VQs; key concepts in the assessment of VQs; and the concept of reliability and reliability indices. The method section follows with an explanation of the approaches to taxonomy development, test selection, data collection and preparation, and analysis. The third section presents findings from the reliability analysis, the implications for which are then explored in the discussion section. The report ends with conclusions and recommendations.
Review
A brief history of technical education and VQs
Technical education and training systems in England have histories running back to the industrial revolution (Lang, 1978) and beyond (Evans, 2007). Institutions recognisable to modern-day readers had commenced the provision of examinations in technical subjects by the 1870s, for example the Society of Arts, subsequently the Royal Society of Arts (RSA) and now ‘the R’ in the OCR awarding organisation (Watts, 2008) and the City and Guilds of London Institute (Lang, 1978; City & Guilds, 1993).
Vocational education and training (VET) and associated VQs have always seemed to be on a ‘parallel but separate track’ to academic education and examinations. Advocates of VQs enumerate their advantages, both in their own right and in contrast to academic qualifications:
Despite its slow and at times haphazard development, the technical examination system in England has possessed a number of positive features. It offered real opportunities to students for entry and subsequent promotion in their chosen occupations. The examinations offered were more flexible than their school and university counterparts, matching the wide range of crafts, trades, vocations and occupational sectors involved. In addition to written examinations, assessments of practical activity were undertaken in special workshops or science
involved, with some examinations set by teachers themselves and externally moderated. (Evans, 2008, p. 13)
Almost all historians of qualifications (eg Tattersall, 2007) agree that qualifications have been subject to increased centralisation and government regulation over the past 30 or so years. In the mid-1980s, a suite of National Vocational Qualifications (NVQs) was instituted following a review of VQs in England and Wales, and the National Council for Vocational Qualifications (NCVQ) was established to police the new national system (Evans, 2008, p. 12: Bees & Swords, 1990). In recent years, the Qualifications & Credit Framework (QCF – see Ofqual, 2008a) has largely superseded the former National Qualifications Framework (NQF) as a national repository for NVQs and other VQs (Ofqual, 2011b, p. 3).
Some influential commentators have been highly critical of increased centralisation; for instance, Wolf writes of ‘the sclerotic, expensive, centralised and over-detailed approach that has been the hallmark of the last two decades’ (Wolf, 2011, p. 21), whilst Oates has challenged the thesis that the QCF can be (or indeed needs to be) a bringer of
‘coherence’ (Oates, 2007, p. 13).
The increased centralisation of recent years is more or less universally accepted as a matter of fact. Equally, the influence of critiques of such centralisation is worthy of note. However, one must also hold in mind that government has always had a role in the provision of technical examinations; the ‘Department of Science and Art’ (a precursor of modern education Ministries2) provided technical exams from the 1850s (Evans, 2008, p. 16) and a history of City & Guilds has chapter headings such as ‘government
constraints, 1919 – 1933’ (City & Guilds, 1993, p. 63) and ‘growing government interest, 1944 – 1964’ (ibid. at p. 88).
Thus, at the end of this section, two complementary thoughts are proposed:
The practice and traditions of VQs are long established and consonant with high quality provision. These traditions pre-date recent government initiatives such as NVQ and QCF.
2
Government control of VQs is widely acknowledged, and criticisms of this have influenced policy makers. However, it would be wrong to imagine that there was a pre-lapsarian era in which government intervention was not an issue and everything in the vocational garden was rosy.
The current status of VQs
Millions of people achieve VQs every year. Ofqual’s latest ‘qualifications market report’ shows total qualification achievements by type for the year 2009/10 as follows:
NVQ 979,000
Vocationally-related qualifications (VRQs) 2,607,300
QCF 771,300 (Ofqual, 2011b, pp. 60 – 63)
Very high stakes can attach to VQs; both for the qualification holders as individuals and for society more broadly. For example, City & Guilds offers a level 2 NVQ in Domestic Natural Gas Installation and Maintenance. Operatives who hold this NVQ will be eligible to apply to become a member of one of the United Kingdom’s Gas Registration Bodies without the need to undertake further independent assessments in the areas covered by the NVQ. City & Guilds NPTC Level 2 Award in the Safe Use of Pesticides (QCF) is a legal requirement by the Chemical Regulatory Directorate for anyone applying pesticides on a commercial basis. City & Guilds keeps the National Register of Sprayer Operators, which facilitates Continuing Professional Development to ensure ongoing training. VQs can use different assessment methods to academic qualifications. As noted above, VQ assessment has long involved practical tasks and teacher/tutor assessment, and features such as ‘on-demand testing’ (Wheadon et al, 2009) are commonplace. Some VQ awarding organisations have also preceded unitary awarding bodies in adopting innovative assessment approaches. For example, a senior Qualifications & Curriculum Authority officer said the following in 2004:
When Wheadon and colleagues surveyed awarding organisations in 2009 on their use of demand e-assessment, they found that City & Guilds had approximately 900 on-demand e-assessments, the largest number of any surveyed organisation (Wheadon et al, 2009, p. 41). City & Guilds’ on-demand e-assessments are generally facilitated by item banks – databases holding test questions. There are generally several questions addressing each Assessment Criterion (AC) within the unit that is being tested. Whilst every test taker receives a test of the same (sometimes very prescriptive) specification, (which typically assesses all ACs) each test will be assembled from different items selected from the bank.
The VQ system is complex. As noted above, this complexity has been criticised. But it can be countered that a certain amount of complexity is inevitable in a system that describes the competences and knowledge required for the very broad range of occupations and professions that exist in the modern economy. It is unsurprising, for instance, that a layperson might find some of the intricacies of gas fitting or commercial pesticide spraying qualifications inaccessible.
The intended benefits of the QCF have been stated as follows:
The aim of the QCF is to support the establishment, maintenance and continuing development of a qualifications system that is:
inclusive – able to recognise the achievements of all learners at any level and in any area of learning
responsive – enabling individuals and employers to establish routes to achievement that are appropriate to their needs, and recognised
organisations to develop units and qualifications in response to demand
accessible – building a system based on clear design features that are easy for all users to understand
non-bureaucratic – based on mutual trust and confidence, supported by a robust and proportionate approach to regulation and quality assurance. (Ofqual, 2008a, p. 5)
work), typically on multiple occasions stressing different environmental aspects, VRQs are assessed primarily on the basis of knowledge.
These different contexts and approaches to assessment have a negative impact for reliability investigation, by obscuring the (likely differing) psychometric assumptions that underlie different qualification types.
Other features of the QCF further inhibit reliability research. The QCF aim of providing flexible qualifications that can be built up unit-by-unit has required every unit to be freestanding and capable of being combined with other units so as to form a
qualification. This poses problems for determining what the proper value of a reliability coefficient should be; if a unit can be part of an award (worth 1 to 12 credits), a
certificate (worth 13 to 36 credits) or a diploma (worth 37 credits or more) (Ofqual, 2008a, p. 6), how can a researcher interpret whether the derived value of a unit’s reliability index is sufficient? Further, Harth & Hemker (2011, p. 13) describe the complex manner in which QCF rules of combination implement conjunctive,
compensatory and complementary approaches. It seems likely that the interaction of such varying combination routines with the (already complex) techniques for estimating the reliability of composite scores (He, 2010) was not considered by QCF designers. VQ units and qualifications are housed in databases. Some of these are owned by Ofqual, whereas others are private systems within awarding organisations. The existence of several databases and the lack of commonality between them make it difficult to build taxonomies and estimate reliability. These databases, the information they hold and the associated issues for reliability will be discussed in more detail in the ‘Taxonomies’ section of this report (below at p. 32).
Key concepts in the assessment of VQs
Competence
[An NVQ is … ] a statement of competence clearly relevant to work and intended to facilitate entry into, or progression in, employment and further learning, issued to an individual by a recognised awarding body.
The statement of competence should incorporate specified standards in:
the ability to perform in a range of work-related activities, and
the underpinning skills, knowledge and understanding required for performance in employment (Jessup, 1991, p. 15)
There is a large literature on meanings and implications of the term ‘competence’, a thorough review of which is beyond the scope of the current research. Rather, in the following section, salient points that have implications for reliability analysis are highlighted.
The term ‘competence’ is ‘compelling in its common sense and rhetorical force’ (Norris, 1991, p. 331). However, it is also a notion of considerable complexity. Jessup’s definition (cited above) makes plain that two elements are relevant to competence: performance in work, and underpinning skills, knowledge and understanding. Some who write about these two facets of competence tend to assert the benefits of one by
emphasising the dis-benefits of the other. For example, the benefits of training for work-place performance is sometimes argued by characterising de-contextualised teaching and learning (learning outside the workplace) as lacking practical applicability, and the ability to motivate disengaged learners (eg Jessup, 1991, p. 10). Conversely, some critics regard competence-based training that is highly targeted on work tasks as reductive, narrow and not assisting learners to develop skills that can be transferred beyond the current role (Norris, 1991, p. 335) nor to develop a coherent body of knowledge. Both types of arguments are somewhat stereotypical; a more sensible position is that competence-based education and training needs to be both practical, engaging and performance-related and have sufficient knowledge elements so that learners can understand the wider context and transfer what they have learned.
However, the definitions of competence operationalised in VQs in England are likely to inhibit the straightforward transfer of psychometric models used in other contexts.
Firstly, competence in English VQs is established by assessor judgement. The assessor judges the candidates as either ‘competent’ or ‘not yet competent’ (Harth & van Rijn, 2010, p. 8). In theory, such judgements are absolute; the candidate either is or is not (yet) competent, there is no place for ‘partial credit’ (ibid., and Harth, personal
communication). Further, the judgements are categorical rather than scores, and it flows from this both that they do not have distribution or spread and that there are no ‘wrong answers’. Thus, it is more principled to consider competence to be either ‘present’ or ‘absent’ and hence for a data file to contain 1 and – (or some other indicator of ‘null’ or ‘not present’) rather than 1 and 0 (corresponding to ‘right’ and ‘wrong’, respectively). For knowledge assessment in NVQs, oral or written questions may be used (including multiple-choice questions)3. Harth & Hemker (2011, p. 14) state that, in principle, any such knowledge assessments ought to have a pass mark of 100 per cent. In practice, knowledge-test pass marks are generally lower than 100 per cent, but they are still higher than they would be for many tests in academic qualifications. Also, the purpose of such knowledge tests is not to array candidates relative to each other along the whole scoring scale, but rather to ascertain whether candidates have mastered the relevant knowledge. Often scores will be restricted to a limited part of the scoring scale for a particular test (typically the higher end). These features suggest that the spread of scores in VQ knowledge tests is likely to be relatively constrained when compared to other forms of knowledge assessment, such as academic examinations. This will have implications for reliability estimation.
Competence has been used in various European VET systems; and various nuanced interpretations of the concept have been elucidated by Brockmann, Clarke & Winch (2011). However, Tight (2002, p. 132) has suggested that the term ‘competence’ as understood in English VQs has roots in US research from the 1970s. As such, competence and its assessment have close conceptual links to the notion of criterion-referenced testing (CRT) that was widely discussed in America in the 70s. CRT is the subject of the next section.
3
Criterion referencing
As well as having an American literature, CRT has been discussed in the UK, especially in the context of grading and comparability (Robinson, 2007, pp. 115 – 118). But – perhaps because of its US origins – a crucial advantage of CRT as opposed to
competence-based assessment is the extensive discussion of psychometrics that has been conducted, leading to the resolution of many issues. The major weakness of CRT as a framework within which to understand English VQs is that not all English VQs are explicitly identified or described as CRTs. The mitigation of that weakness – which applies particularly to knowledge tests in VQs – is that the assessments exhibit
properties which, as a matter of fact, resemble features of CRTs, even if their designers have declined or neglected to name them thus.
A recent and authoritative work defines criterion referencing as follows:
Criterion-referenced interpretations characterize an examinee on the basis of a test performance without reference to the performance of other individuals. In theory, the interpretation is determined by the absolute level of the examinee’s score, without reference to the performance of anyone else. (Haertel, 2006, pp. 66 – 67)
Osterlind suggests that CRTs should have the following features: a) clearly defined performance standards for measurement
b) test items constructed specifically to address the intended performance standards
c) scores that can be interpreted in terms of an individual’s achievement of the specified performance standards. (Osterlind, 1988, pp. 87 – 87)
As argued above, although tests in VQs are not often explicitly referred to as CRTs, they do exhibit all the features in the definitions above. VQ units contain Learning Outcomes (LOs) and Assessment Criteria (ACs) which are based on National Occupational
Standards (NOS). In turn, the VQ tests to assess the knowledge and/or performance for those units are based on LOs and ACs (Harth & Hemker, 2011, pp. 10 – 12).
Assessment results can be interpreted in terms of qualifications holders’ competence in respect of the NOS; this is especially the case where VQs are high-stakes and function as licences or quasi-licences to practise.
al, 1975, p. 9). It is also possible that CRT score distributions might only occupy a small part of the scoring scale for a test (typically the top end, if the pass mark is high). However, this may be a design feature of a CRT, and not necessarily a matter of
concern to the test developers, even though it might be a factor that challenges reliability estimators (cf. Johnson & Johnson, 2011).
The fact that CRT applications have to sample all areas of a given domain may be a challenge for measurement models that make strong assumptions that test items address a undimensional latent trait (Wainer et al, 1990; Sands, Waters & McBride, 1997).
Reliability
Definition of the concept and state of the art
Ofqual has defined reliability as follows:
Reliability refers to the consistency of outcomes that would be observed from an assessment process were it to be repeated. High reliability means that broadly the same outcomes would arise. A range of factors that exist in the assessment process can introduce unreliability into assessment results. Given the general parameters and controls that have been established for an assessment process – including test specification, administration conditions, approach to marking, linking design and so on – (un)reliability concerns the impact of the particular details that do happen to vary from one assessment to the next for whatever reason.
Sources of error include:
occasion-related (e.g. if assessed on another day, the student might have been less tired)
test-related (e.g. if a different test had been set, the student might not have been disadvantaged by the unfamiliar wording of one essay title or
advantaged by the topic of another)
marking-related (e.g. if a different marker had been assigned, the student might have been marked down for using unusual stylistic constructions)
grading-related (e.g. if a different team of people had been involved in the process of level setting, different thresholds might have been set). (Ofqual, 2011a, p. 4; see also, Newton, 2009, p. 183)
There is an extensive literature elucidating the concept of reliability, methods for estimating its extent, and necessary considerations in interpreting such estimations. Chapters in successive editions of the American textbook Educational Measurement
include: Stanley (1971), Feldt & Brennan (1989) and Haertel (2006). The outputs of Ofqual’s reliability programme define the state of the art in reliability conceptualisation and empirical estimation in England in 2011. Reports can be found at:
www.ofqual.gov.uk/standards/reliability.
Previous studies of VQ reliability
From over 20 reports on the Ofqual reliability micro-site, only one is based on VQs. A recent review of VQ research took the view that ‘there are significant gaps in recent reliability research in the UK’ (Johnson, 2006, p. 37).
Murphy and colleagues (1995) wrote a report for the NCVQ. They reviewed then existing reliability literature, and brought together 31 assessors to review portfolios and discuss the extent of agreement in judgements of competence. They also observed 15 assessed tasks and investigated differences of opinion between assessors of such tasks. They described (in words) the extent of agreement and causes of disagreement for the different portfolio assessments but did not derive any reliability indices (Murphy et al, 1995, pp. 19 – 20). They also suggested further work that could be carried out to investigate VQ reliability (ibid. at p. 28).
Greatorex (2005) reported analysis of simulated candidate evidence (n = 15) on two NVQ units. This analysis returned Cronbach’s alpha internal consistency values in excess of 0.9 in both NVQ units (ibid. at p. 155). Greatorex suggested that the NVQ system was capable of sustaining reliable outcomes, but also proposed that further work was necessary on the issue of inter-rater agreement (ibid. at p. 161).
Harth & Hemker (2011) conducted research in Ofqual’s reliability programme. Their detailed discussion of the context and assumptions of VQs (Harth & Hemker, 2011, pp. 10 – 16) enumerated rationales for VQ assessment and pointed out the conceptions of quality that underpin them. They went on to devise an approach to reliability estimation that was appropriate for the various described approaches to VQ assessment (ibid. at pp. 17 – 22). In particular, they proposed the use of: Cronbach’s (alpha) and
Guttman’s
2 (lambda-2) coefficients to estimate decision consistency (ibid. at pp. 19 –They summarised their findings with respect to the three qualifications that they analysed as follows:
… inter-assessor (rater) agreement is ‘high’ (Gower coefficient ranging from .90 to .99) and inter-rater (assessor/IV) reliability (Cohen’s kappa) is ‘substantial’ for the Electrotechnical pathway (kappa > .75) and ‘almost perfect’ for the
hairdressing qualifications (kappa > .95). …
The data available from the Electrotechnical Services pathway allowed us to estimate the internal consistency of decisions by estimating a coefficient similar to Cronbach’s alpha by means of considering units as items. In this case, reliability estimates had values larger than .95, considered to be very high, especially in the context presented by vocational assessment. (Harth & Hemker, 2011, p. 37)
Harth & Hemker (ibid.) make various suggestions for further work, and in general demonstrate that it is feasible to analyse VQ reliability and that such analyses can demonstrate highly reliable assessment. The current work seeks to build on the foundation established by Harth & Hemker; we address a different part of the VQ portfolio (knowledge tests rather than judgements of competence) and draw out some implications about the nature of data sets and suitable coefficients to use given the inferences that certain VQs sustain.
Factors that affect values on reliability indices
Now, we move on to consider the factors that can impact upon indices of reliability. Reliability can be expressed as any of:
the squared correlation between true score and observed score
the correlation between observed scores on two equivalent tests
the ratio of true score variance to total variance
the ratio of true score variance to the sum of true score variance and error variance. Ofqual’s definition (as cited above at p. 13) puts replication at the heart of the conception of reliability while the focus in the cited extract from the regulator’s specification of
immediately, if one was thinking only in terms of the proportion of total variance that is true score variance. Thus, in the following section, we review some of the structures of test-generated data sets which can impact on the values of reliability coefficients.
The first aspect of data set structure that can impact on reliability is the spread of scores. When a reliability index seeks to convey the extent to which test takers’ scores can be distinguished from each other (a classic NRT aim, see above), then a test will appear more reliable if the scores of candidates have a larger spread, i.e. variance. This will be true even if the amount of error variance is constant (Traub & Rowley, 1991, pp. 177 – 178).
The extent to which test items address the same ability can affect reliability. If all items in a test address the same or similar abilities, then the reliability index is likely to be higher. This is true for those indices in which covariance between items constitutes a term in the formula, and also for those indices that are based on a measurement model that requires measures to be arrayed on an underlying, latent trait (see below at p. 21). Any researcher using statistical techniques needs to be sensitive to differences between populations and samples (Gravetter & Wallnau, 1996, p. 201). Further, the reader will note that the reliability formulae set out below are mostly expressed in terms of
population parameters. This is a challenge for the research in that observed test scores upon which calculations are performed are sample statistics drawn from a larger
population. As such, they are potentially biased estimates of population parameters. Having said that, Cronbach & Shavelson (2004, p. 414)’s remark seems relevant:
… a naïve response would be to say that if [random sampling] assumptions are violated, the Alpha calculations4 cannot be used. No statistical work would be possible, however, without making assumptions and so long as the assumptions are not obviously grossly inappropriate to the data, the statistics calculated are used, if only because they can provide a definite result that replaces a hand-waving interpretation.
Further, Bramley & Dhawan have commented that indices such as Cronbach’s alpha are – for all their weaknesses – ‘a de facto standard’ (2010, p. 10). As such they are worth
calculating in the current project. However, the impact of failing to deal fully with sample bias may be to limit the generalisability of findings. This issue is particularly acute in the
4
case of CRT, because while some indices may provide perfectly adequate results to convey the extent to which tests reliably perform NRT tasks (essentially rank ordering candidates), their use for more absolute interpretations may be less defensible. For that reason, reliability approaches that contain explicit corrections for sampling bias are to be preferred in the case of CRT.
The final point in this section echoes the observations of Hutchison & Benton (2009, p. 4) regarding different measurement philosophies. Reliability indices derived from different traditions can give different results. Also, the complexity of the formulae used to convey indices can obscure important matters of principle. Finally, researchers differ in the extent to which they would ‘mix and match’ reliability approaches from different traditions; some would be prepared to take aspects from across the range of reliability techniques, whereas others would stick firmly within their own paradigm. At the very least, researchers – whichever and however many tradition(s) they take their reliability indices from – should state the assumptions underlying the reliability analyses that they use and any limitations of the inferences that can therefore be made.
Types of reliability measure
We have reached a somewhat paradoxical juncture; the specification of requirements for this project refers to ‘internal reliability’ – a term that implies strongly that reliability
indices should be generated to describe the structure of data sets generated in response to tests. Yet we also know that data sets from CRTs tend to have different features from those from NRTs and that what is ‘good’ in a data set distribution for an NRT is not necessarily good for a CRT. We also know that in CRT the categorisation of a candidate as ‘competent’ or ‘not yet competent’ (master or non-master of the topic) is crucial. For this reason it is important to note that different sources have categorised reliability approaches for CRTs into three basic types.
themselves, say anything about the extent of misclassification (people truly competent who are classified as not competent or vice versa) (Newton, 2009, p. 185).
Generalizability theory provides co-efficients of ‘relative’ and ‘absolute’ measurement
(Johnson & Johnson, 2010, p. 23). The coefficient of absolute measurement ‘provide[s] a handy way of estimating the overall dependability of the scores on a CRT without reference to a cut-score’ (Brown, 1990, p. 90).
So-called ‘threshold-loss indices’ are an alternative to internal consistency and/or dependability coefficients that provide information on the extent of misclassification (Brown, 1990, p. 81; Traub & Rowley, 1980, pp. 526 – 529). Gower’s coefficient and Cohen’s kappa as used by Harth & Hemker (see above at p. 14) are examples of such indices. An indication of the extent of misclassification is of course crucial in an analysis of the reliability of CRTs. However, whilst threshold-loss indices do give information on the extent of misclassification, they do not distinguish between misclassifications; any misclassification – however gross – is treated equally. Also, threshold-loss indices give no indication of the internal structure of the data set generated by the studied test, and hence do not comply with the specification of requirements for this project.
In contrast, squared-error loss agreement approaches ‘take into account the distances of
students’ scores from the cut-point, i.e., the degree of mastery or non-mastery rather than just the simple categorization’ (Brown, 1990, p. 88). Thus, they afford the possibility of modelling the extent of misclassification and they could be conceived as fitting the ‘internal reliability’ definition set out in the specification of requirements.
Examples of indices and the replications that they quantify
The main features of English VQ assessment systems and the considerations affecting reliability estimation have been set out in the previous sections. In the section that follows, we define formally5 the reliability indices that we intend to employ and comment briefly on the considerations that affect the implementation of each index.
5
Internal consistency and dependability indices
Kuder & Richardson (1937) derived several formulae to estimate the internal consistency of test data sets. Their equation 21 (known as KR-21) is relevant for the current project:
x x x x xn
n
n
n
2 211
1
(1)where: x x
21 is the Kuder-Richardson 21 reliability co-efficient for test x
n is the number of items in the test x
is the raw (population) mean score for test xand
2x is the (population) variance of scores on test xKR-21 is relatively little used in modern-day reliability research, but its benefit for our purposes is that it is possible to calculate it using total test scores, rather than item scores (Hutchison & Benton, 2009, p. 24). Thus it has possibilities in cases where different candidates receive different items. However, any such use of KR-21 would come with the ‘health warning’ that the derived index does not model any unreliability deriving from the candidates receiving different items.
KR-21 has largely been superseded in reliability estimation by Cronbach’s alpha (Cronbach, 1951, p. 299). The formula for alpha is:
x j i ij x xn
n
2 21
1
(2) where: x x
is the Cronbach’s alpha reliability co-efficient for test x
n is the number of items in the test 2
ij
is the (population) covariance of scores for items i and jand
2x is the (population) variance of scores for test xCronbach’s is an extremely widely used index (Sijtsma, 2009, p. 108). However, that use is controversial. Cronbach himself (Cronbach & Shavelson, 2004) disavowed the
coefficient towards the end of his life in favour of the standard error of measurement6. Sijtsma (2009) has stated that is often a ‘gross underestimate’ of the true reliability,
and Harth & Hemker (2011, p. 20) simplifying a formula from Sijtsma’s paper, suggested the following relationship:
' '
2
' xx xx
xx
(3)7 where:
x x
is the Cronbach’s alpha reliability co-efficient for test x
' 2
xx is the Guttman’s lambda-2 alpha reliability co-efficient for test x, and
' xx
is the ‘true’ reliability for test xAs an internal consistency coefficient, gives no information on the extent of misclassifications. Secondly, as an index from the NRT tradition, will tend to be higher in those instances where scores are spread along the length of a scoring scale, and may give misleading results if scores are ‘bunched’ in one part of the scale. Thirdly, as an index from classical test theory (CTT),
is subject to the assumption of strictly parallel forms. Strictly parallel forms have four properties: Identical test specifications
Identical observed score distributions when administered to any (indefinitely large) population of examinees
Tests which covary equally with one another, and
Covary equally with some other measure, where that other measure is a measure of the same construct
(Haertel, 2006, p. 69)
It is likely that these assumptions do not always hold in CRT.
Finally, as depends in part on the variance of item scores, it is only possible to calculate its value in cases where all candidates receive the same items.
According to Sijtsma (2009),
2 gives a better estimate of the true reliability than , and so it may be appropriate to use it for the current project. Guttman (1945) derived six reliability indices and Callender & Osburn (1979, p. 89) give the following interpretation of
2 by showing its relationship to
1:
7
2 1 2 1 ' 1 x n i i xx
and (4)
2 2 1 ' 1 ' 2 x xx xx n n
where:n is the number of items in the test 2
x
is the variance of scores on test x2 i
is the variance of a single item i2
is the sum of the squares of the covariances between items, a sum which includes n(n-1) terms
' 1
xx is the Guttman’s lambda-1 alpha reliability co-efficient for test x
' 2
xx is the Guttman’s lambda-2 alpha reliability co-efficient for test x
Item response theory (IRT) is a family of measurement models that has many applications in the evaluation (Embretson & Reise, 2000) and scoring (Thissen & Wainer, 2001) of tests. The IRT model containing the fewest parameters is the Rasch model. Rasch model adherents emphasise its supposed elegance, parsimony and closeness to the ‘essence’ of measurement (eg Andrich, 2004). However, Rasch modelling/theory8 has been controversial in the United Kingdom9 (Panayides, Robinson, & Tymms, 2010).
IRT (including Rasch) practitioners tend to think of reliability in different terms to those discussed so far. The Test Information Function (TIF) is a frequently-used indicator of measurement quality (Hutchison & Benton, 2009, p. 28). This has the benefit of showing the magnitude of measurement information, and of showing its location on an
ability/difficulty (trait) scale (ibid.). However, TIFs arguably do not constitute a reliability
8
The nomenclature that commentators use tends to hint at their attitude to Rasch.
9
measure within Ofqual’s definition, since they make no direct statement about replication.
However, Rasch practitioners have developed several analogues to conventional internal consistency coefficients which may be useful in this project. Wright (1996) defines a ‘separation index’ such that
… separation is the number of statistically different performance strata that the test can identify in the sample. This can be pictured by placing an error
distribution in each stratum. A separation of ‘2’ implies that only two levels of performance can be consistently identified by the test for samples like the one tested. (Wright, 1996, p. 472)
Linacre has used the separation index to develop an analogue to an internal consistency index within the Winsteps program (Linacre, 2009). This index is notated as follows by Hutchison & Benton (2009, p. 63):
SE
SDT
SEP
and (5)
2 2 1 SEP
SEP REL
where
SDT is the expected true SD of the target sample
SE is the mean test standard error of measurement
SEP is the separation index
REL is the person separation reliability index.
SEP (and hence REL) are reliability indices calculated from Rasch trait estimates. Some Rasch theorists (Andrich, 1982; Linacre, 1997) contrast Rasch reliability indices with ‘raw score reliability indices’ such as
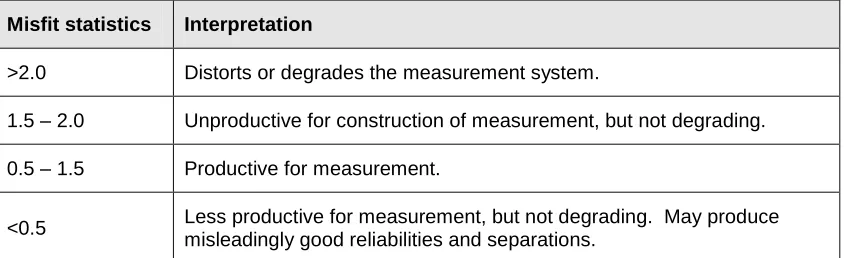
. Trait estimates essentially amount to ‘adjusted scores’ for the case where candidates receive items of differing difficulties. Also, IRT has always been able to handle missing data matrices (witness IRT’s prominent role in Computer Adaptive Testing). Further, the REL index functions even in the situation where different candidates receive different items. Thus, this appears to have potential for the analysis of randomly-generated tests (where different candidates receive different questions from an item bank) in the current project.will write tests with the aim of fitting the Rasch model, rather than the other way around. Also, as we have seen above (p. 14), VQs are written to assess all of a qualification’s LOs and AC and thus are not designed to array candidates in respect of a single latent trait. Thus, a necessary condition for the use of a Rasch-based reliability index would be the calculation of a statistic to show the extent to which scores fit the Rasch model. The Rasch Measurement Software ‘Winsteps’ provides the following guide to interpreting the Winsteps misfit statistic:
Misfit statistics Interpretation
>2.0 Distorts or degrades the measurement system.
1.5 – 2.0 Unproductive for construction of measurement, but not degrading.
0.5 – 1.5 Productive for measurement.
[image:29.612.92.514.230.359.2]<0.5 Less productive for measurement, but not degrading. May produce misleadingly good reliabilities and separations.
Table 1: Interpretation of Rasch model parameter-level mean-square fit statistics
(Linacre, 2009, p. 444)
Generalizability theory (Cronbach et al, 1972; Brennan, 2001; Cardinet, Johnson & Pini, 2010) affords several possibilities. The (relative) generalizability co-efficient can be noted as follows:
)
(
)
(
)
(
2 2
2 2
p
p
E
(6)where 2
E
is the (relative) generalizability coefficient)
(
2p
is the universe score10 variance, and)
(
2
is the relative error variance (Brennan, 2003, p. 11)When data are arranged in a two-factor ‘crossed design’ (see below),
2E
gives equivalent results to Cronbach’s
(ibid. at p. 12). WhilstE
2 is computed using relative error variance (a concept most suitable for NRT applications), generalizabilitytheory also provides coefficients that are based on absolute error variance. The dependability coefficient can be noted as follows:
)
(
)
(
)
(
2 2
2
p
p
(7)
where
is the (absolute) dependability coefficient)
(
2p
is the universe score variance, and)
(
2
is the absolute error variance (Brennan, 2003, p. 12)In practice, for the simplest assessment model, in which candidates take the same test, the absolute error variance is the sum of the item variance and the residual variance (which is confounded with the candidate-item interaction variance), both terms divided by the number of items. The benefit of this ‘absolute’ coefficient in principle is that it is not dependent on the CTT assumption of strictly parallel forms, and thus is more appropriate for the case of CRT measurement.
For those indices that take into account item variances (
,E
2 and
) it has been implicit thus far that data will be set up in a matrix or ‘crossed’ format (noted as i x c –items crossed with candidates). This scenario is the most efficient for extracting the maximum amount of measurement information about both candidates and items. Generalizability theory also addresses situations in which facets are ‘nested’ within each other (Cardinet, Johnson & Pini, 2010, pp. 13 – 14). This is the case, for example, when candidates receive different items from each other (see above, p. 8),which can be conceptualised as items ‘nested within’ candidates (noted as i : c)11.
Squared error loss indices
Since internal consistency, generalizability or dependability indices do not give
information on the extent of misclassification, one or more squared-error loss agreement
11
indices are necessary. Livingston’s index ( 2
K
L ) (Livingston, 1972) was the earliest squared-error loss agreement index to be developed. The following notation is based on that of Traub & Rowley (1980, pp. 536 – 537)12:
2 2 2 2 2
)
(
)
(
)
,
(
'c
c
x
K
x x x x xx L
(8)where
)
,
(
2
x
K
L is Livingston’s K (squared) index
x is ‘the realization of a true or latent measurement’ plus measurement error
(Traub & Rowley, 1980, p. 524) – i.e. observed scores.
is the ‘true or latent measurement’ (ibid.) – i.e. ‘true score’' xx
is some NRT internal consistency reliability estimatec is a pre-determined cut score, and x
is the mean observed score on the test 2x
is the variance of observed scores on the test The following is a logical consequence of the definition of LK
2:2
' L
K
xx
(9)where 2
K
L is Livingston’s index, and '
xx
is some NRT internal consistency reliability estimateFurther, if the mean score is equal to the cut score, then the squared error loss index reduces to the internal consistency index (Traub & Rowley, 1980, p. 537).
In L
K
2,
xx' is some NRT internal consistency reliability estimate. Most often
hasbeen the internal consistency that has been ‘plugged into’ 2
K
L . However, 2
K
L is written sufficiently generally that some other internal consistency/NRT-derived index could be substituted. This may be useful for cases where different candidates receive different items, and this precludes the use of certain indices (typically those using a
12
‘crossed design’ – see above). Values
xx'from KR-21 or the Rasch person separationindex could be used as the value for ' xx
in the equation above.Given that the Rasch person separation index is based on trait measures rather than raw scores, whereas the KR-21 index is not, and that L
K
2 containing any internal consistency index is greater than or equal to an internal consistency coefficient, we may tentatively posit the following relationship:2 ) 21 ( 2 ) (
'
K
KRK
L REL
L
xx
(10)where
' xx
is some NRT internal consistency reliability estimate 2) (REL
K
L is Livingston’s index calculated using the Rasch person separation index
2 ) 21 (KR
K
L is Livingston’s index calculated using the KR-21 internal consistency index
This approach of ‘plugging in’ NRT internal reliability co-efficients into Livingston’s index may be useful to researchers who do not – for some reason – have access to the phi (lambda) approach that is about to be described. It is acknowledged to be an imperfect solution, however. Firstly, KR-21 tends to be rarely used nowadays. Also, there are several reasons to challenge the use of the Rasch person separation index ‘inside’ Livingston’s index. These are:
The Rasch person separation index is not the main way in which that measurement tradition conceives of reliability, and therefore the properties of that index have been less rigorously interrogated in research.
We know of no published attempts to ‘plug’ the Rasch person separation index into Livingston’s index, and hence this would be a novel or idiosyncratic procedure.
If the variance quantification within the Rasch person separation index were conducted using different assumptions to those used to quantify variance in other parts of Livingston’s formula (particularly the denominator), this would limit the interpretations that a user of this index could make.
Brennan & Kane (1977) developed the phi (lambda) ((
)) index. This is a squared-error loss agreement index with philosophical underpinnings from generalizability theory. This index has been said to be preferable to LK
2 in the case of CRT since it requires fewer classical test theory assumptions (Brown, 1980, pp. 92 – 93). The formula for) (
is noted as follows by Haertel (2006, p. 99)13:
)
(
)
(
)
(
)
(
)
(
)
(
2 2 22 2
p
p
(11) where ) (
is the (absolute) dependability coefficient for a given cut score,
is the cut score (expressed as a proportion of the total test score14)
is the grand mean score)
(
2p
is the universe score variance, and)
(
2
is the absolute error variance15) (
shares some features with 2
K
L , but its calculation also includes some steps that make it more appropriate for CRT applications. When the mean score approaches the cut score, (
) approaches
. However, in estimating ( ) from sample data, we need to make an adjustment, because ( ̅ ) is a biased estimate of ( ) , the amount of the bias being equal to ̅ (where ̅ is the sample mean). Whilst this adjustment involves an extra calculation when compared to the LK
2, it also means that) (
is a more principled treatment of sample-to-population generalisation.
The Standard Error of Measurement
Haertel defines the Standard Error of Measurement (SEM) as:
… a number expressed in the same units as the corresponding test score [which] indicates the accuracy with which a single score approximates the expected value of possible scores for the same examinee. (Haertel, 2006, p. 65)
13
See also Brennan (2001, p. 13).
14
For binary data tests. If
is the mean score then should be on the same metric as
.15
We have used this notation for phi (lambda) in preference to that of the original article (Brennan & Kane, 1977, p. 281) on the grounds of parsimony and consistency with the earlier G-theory
SEM is the square root of the measurement error variance (Haertel, 2006, p. 69). SEM is related to the reliability, and is often expressed in terms of
, as in this widely-used formula:2 ) 1
( X
SEM
(12)where
SEM
is the Standard Error of Measurement for a total test score
is the reliability coefficient2 X
is the variance of a set of test scores X(Hutchison & Benton, 2009, p. 62)
However, SEM is logically distinct from the reliability co-efficient; it is the value of the reliability coefficient that depends on the value of measurement error and not the other way around. It is not necessary to calculate the reliability coefficient to get the SEM. Many modern measurement software applications provide SEM estimates as a default output. Both ‘Winsteps’ and ‘EduG’16 – the software applications used in the current project – do so (see page 46 for description of these applications).
An SEM value can be used to calculate a confidence interval around an observed score. For example, under the central limit theorem (Gravetter & Wallnau, 1996, p. 204), one can infer that there is a 95% probability that the true score lies within 1.96 x SEM either side of the observed score (Harvill, 1991, p. 33). This is a useful property of the SEM, and it is not liable to provide misleading results in the case of widely or narrowly spread data (Hutchison & Benton, 2009, p. 26). However, in the current project, it would be a stretch to describe SEM as an ‘internal reliability co-efficient’ and thus it would be strictly speaking outside the scope of the project as specified.
16 EduG provides an ‘absolute SE’, and one needs to divide that quantity by the number of items
Index Type of index Strengths Weaknesses/limitations Kuder-Richardson 21 (KR-21) Internal consistency
Simple to compute using off-the shelf statistical packages.
Can be calculated from total scores alone.
Will work in the case of candidates receiving different items.
Could be inserted into Livingston’s index for tests where different candidates receive different items.
Somewhat archaic – rarely used in modern research.
Does not model inter-item unreliability in the case where different candidates receive different items.
Cronbach’s alpha
Internal consistency
Simple to compute using off-the shelf statistical packages.
Widely understood.
Models inter-item unreliability.
May understate reliability when test score distribution is ‘narrow’ or ‘bunched’.
Makes no statement about misclassification.
Criticised by authoritative articles – especially that it may underestimate reliability.
Needs all candidates to answer same questions to function.
Guttman’s lambda-2
Internal consistency
Simple to compute using off-the shelf statistical packages.
Moderately well understood.
Models inter-item unreliability.
Suggested to be closer to ‘true reliability’ than alpha.
May understate reliability when score distribution ‘narrow’ or ‘bunched’.
Makes no statement about misclassification.
Needs all candidates to answer same questions to function.
Rasch-based person separation reliability index (REL) Pseudo-internal consistency
Simple to compute (using specialist software).
Models inter-item unreliability.
Based on trait measures, which amount to ‘adjusted scores’ in the case where different candidates receive different items.
Could be inserted into Livingston’s index for tests where different candidates receive different items (and such a use would model inter-item
unreliability in the case where different candidates received different items).
Needs specialist software to compute.
Rasch models tend to be contentious among psychometricians.
VQ tests are designed to assess all LCs and ACs – not to develop a latent trait scale. Therefore, not clear as a matter of principle that these tests should fit the Rasch model.
Person separation reliability index not the main way that IRT conceives of reliability.
Relative G
coefficient Generalizability
Simple to compute (using specialist software).
Models inter-item unreliability.
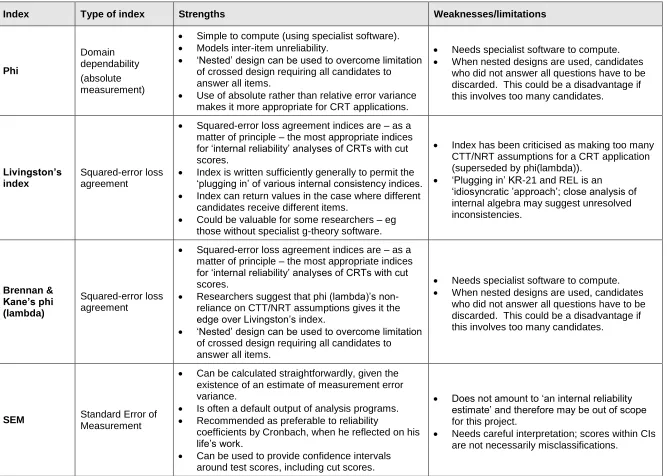
Index Type of index Strengths Weaknesses/limitations Phi Domain dependability (absolute measurement)
Simple to compute (using specialist software).
Models inter-item unreliability.
‘Nested’ design can be used to overcome limitation of crossed design requiring all candidates to answer all items.
Use of absolute rather than relative error variance makes it more appropriate for CRT applications.
Needs specialist software to compute.
When nested designs are used, candidates who did not answer all questions have to be discarded. This could be a disadvantage if this involves too many candidates.
Livingston’s index
Squared-error loss agreement
Squared-error loss agreement indices are – as a matter of principle – the most appropriate indices for ‘internal reliability’ analyses of CRTs with cut scores.
Index is written sufficiently generally to permit the ‘plugging in’ of various internal consistency indices.
Index can return values in the case where different candidates receive different items.
Could be valuable for some researchers – eg those without specialist g-theory software.
Index has been criticised as making too many CTT/NRT assumptions for a CRT application (superseded by phi(lambda)).
‘Plugging in’ KR-21 and REL is an
‘idiosyncratic ’approach’; close analysis of internal algebra may suggest unresolved inconsistencies. Brennan & Kane’s phi (lambda) Squared-error loss agreement
Squared-error loss agreement indices are – as a matter of principle – the most appropriate indices for ‘internal reliability’ analyses of CRTs with cut scores.
Researchers suggest that phi (lambda)’s non-reliance on CTT/NRT assumptions gives it the edge over Livingston’s index.
‘Nested’ design can be used to overcome limitation of crossed design requiring all candidates to answer all items.
Needs specialist software to compute.
When nested designs are used, candidates who did not answer all questions have to be discarded. This could be a disadvantage if this involves too many candidates.
SEM Standard Error of Measurement
Can be calculated straightforwardly, given the existence of an estimate of measurement error variance.
Is often a default output of analysis programs.
Recommended as preferable to reliability
coefficients by Cronbach, when he reflected on his life’s work.
Can be used to provide confidence intervals around test scores, including cut scores.
Does not amount to ‘an internal reliability estimate’ and therefore may be out of scope for this project.
[image:36.792.69.736.55.531.2]Interpretation of reliability indices
Reliability analysis is a deeply quantitative enterprise. However, quantification alone is insufficient to constitute effective reliability research. Nicols & Smith (1998, p. 34) argue for:
a reconceptualization of reliability that reflects the importance of the theoretical expectations of the test specialist and the learning and problem solving of the test takers.
Parkes (2007, p. 6) suggests that reliability research should adopt recent innovations from validity research and attempt to construct reliability arguments. Such arguments would have the following six stages:
1. A determination of the social and scientific values of dependability, consistency, accuracy, etc. most relevant to the scenario at hand. 2. Clear statements of the purpose and the context of the assessment. 3. The definition of a replication in the particular assessment.
4. A determination of the tolerance or level of reliability needed. 5. The evidence.
6. The Judgment: Pulling it all together
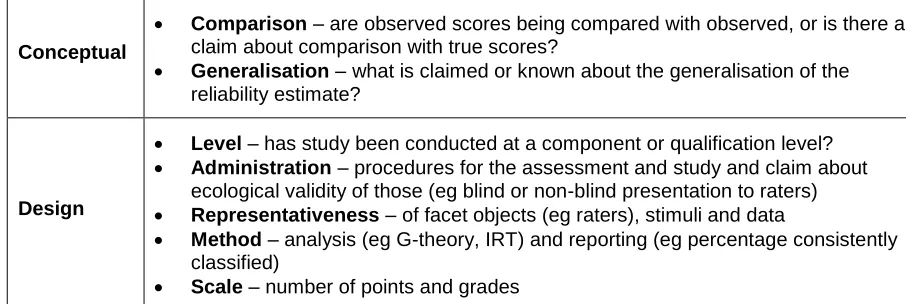
Baird et al (2011, p. 22) suggest that the following information should be presented in reliability research reports:
Facets – which replications have been included in the study (eg raters, items, occasions)
Conceptual
Comparison – are observed scores being compared with observed, or is there a claim about comparison with true scores?
Generalisation – what is claimed or known about the generalisation of the reliability estimate?
Design
Level – has study been conducted at a component or qualification level?
Administration – procedures for the assessment and study and claim about ecological validity of those (eg blind or non-blind presentation to raters)
Representativeness – of facet objects (eg raters), stimuli and data
Method – analysis (eg G-theory, IRT) and reporting (eg percentage consistently classified)
[image:37.612.81.534.434.586.2] Scale – number of points and grades
Table 3: Checklist for reporting reliability claims
It is suggested that the extensive review section above, and the detailed description of procedures in the following Method section, addresses the concerns implied by Baird et al in their table above. When findings are presented below, they will also be
Taxonomies
The organised description of (groups of) phenomena by means of taxonomies is one of the fundamental building blocks in the scientific method. A taxonomy will be beneficial for this reliability project because it will help describe tests that meet criteria set out by Ofqual, and enable a range of tests to be selected for reliability analysis. The
information required to describe tes