Higher Education Performance Indicators, 2010/11
SB 35/2012 3 April 2012
This Statistical Bulletin presents summary information from the report “Performance Indicators in Higher Education in the UK 2010/11” published by the Higher Education Statistics Agency (HESA). The HESA publication, along with data for each higher education institution, can be found at
http://www.hesa.ac.uk/pi
The indicators are designed to provide reliable information on the nature and performance of the higher education sector in the UK and a consistent set of measures of this performance. The performance indicators broadly cover widening participation, non-continuation rates and outcomes. Indicators relate to higher education institutions in the individual countries of the UK. These tables can also be found on
StatsWales, along with breakdowns by individual Welsh institutions.
Summary
• In summary, the indicators show that Wales are performing at above or around the UK average in terms of entrants from state schools and social class, but a more mixed picture with regards to continuation rates and entrants from “low participation” neighbourhoods.
• The proportion of first degree entrants from state schools continues to be higher in Wales than from the UK as a whole while the proportion from NS-SEC classes 4, 5, 6 and 7 was broadly similar in Wales and the UK.
• The proportion of young and mature part-time undergraduate entrants from low participation neighbourhoods in England and the UK was higher than in Wales, but the variability in figures for Wales over recent years make it difficult to identify a particular trend.
• Levels of non-continuation rates amongst both young and mature full-time first degree entrants after their first year were above that for England and the UK as a whole.
• Drop out rates amongst part-time first degree entrants after two years were also lower in Wales, but figures were higher amongst full-time other undergraduate entrants after their first year.
• Projected non-completion rates for full-time, first degree starters in 2009/10 increased in Wales and remained above rates in England and the UK.
Statistician: Amira Irshad Tel: 029 2082 3528 E-mail: [email protected]
Next Update: April 2013 (provisional)
Widening Participation Indicators, 2010/11
• The percentage of young1 full-time first degree entrants to Welsh higher education institutions (HEIs)
from state schools or colleges was 92.2 per cent, one percentage point lower than the previous year. The UK comparable figure was 88.7 per cent (Table 1).
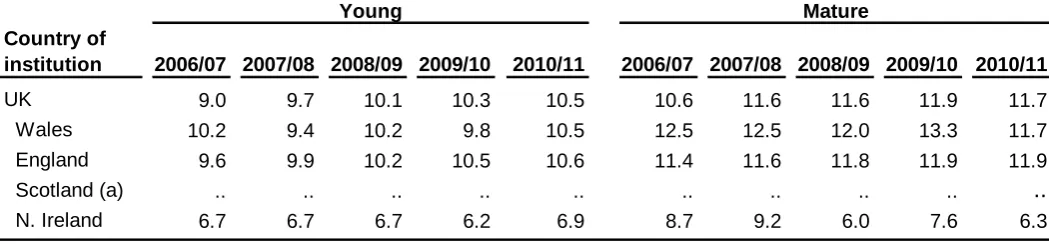
• 10.5 per cent of young full-time first degree entrants and 11.7 per cent of mature1full-time first degree
entrants at Welsh HEIs came from low participation neighbourhoods2. Welsh HEIs have the same
rate as that of the UK as a whole (Table 3).
• 10.8 per cent of young part-time undergraduate entrants and 7.0 per cent of mature part-time
undergraduate entrants at Welsh HEIs came from low participation neighbourhoods2. The UK has
corresponding figures of 13.0 per cent for young entrants and 8.0 per cent for mature entrants
(Table 4).
• 6.1 per cent of full-time first degree students (the highest rate in the UK) and 2.7 per cent of part-time undergraduate students in Welsh HEIs were in receipt of a disabled students’ allowance (DSA)1
(Table 5).
• 31.0 per cent of young full-time first-degree entrants to Welsh HEIs were from National Statistics Socio-Economic Classification (NS-SEC) Classes 4 - 71,similar to the UK comparable figure (30.6 per
cent)3(Table 2).
Non-continuation Indicators, 2009/10 students
• 7.6 per cent of young full-time first-degree entrants and 14.0 per cent of mature full-time first degree entrants to Welsh HEIs in 2009/10 did not continue beyond their first year. Both figures were higher than the comparable UK figures (7.2 per cent and 13.3 per cent respectively) (Table 6).
• 20.6 per cent of young full-time other undergraduate entrants to Welsh HEIs in 2009/10 did not continue beyond their first year. This has remained unchanged compared with 2008/09 and is 2 percentage points higher than the UK figure. 23.2 per cent of mature full-time other undergraduate entrants to Welsh HEIs in 2009/10 did not continue beyond their first year, compared with 14.6 per cent for the UK (Table 7).
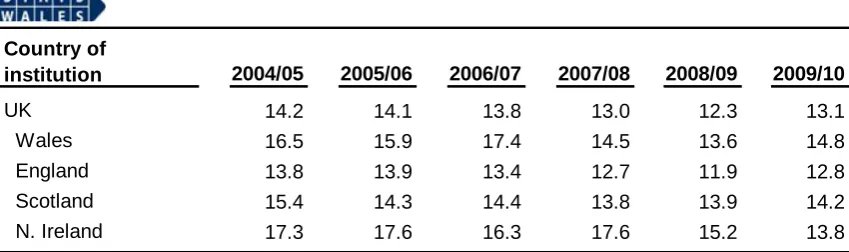
• 76.6 per cent of full-time students starting first degree courses in Welsh HEIs in 2009/10 were
expected to gain a degree, slightly lower than in the previous year, while 14.8 per cent of such students were not expected to obtain an award or to transfer to another institution. This latter figure is higher than the figure for 2008/09 (13.6 per cent), and the figure for the UK (Tables 9 and 10).
• 32.1 per cent of part-time first degree entrants to Welsh HEIs in 2008/09 who were aged 30 or under did not continue beyond their second year. This is 2.1 percentage points lower than the UK figure. 27.1 per cent of part-time first degree entrants to Welsh HEIs in 2008/09 who were aged over 30 did not continue beyond their second year, 2 percentage points lower than the previous cohort and 5.7 percentage points lower than the UK figure (Table 8).
Module completion rates for part-time students, 2010/11
4• At Welsh HEIs, 83.2 per cent of modules undertaken by part-time undergraduate students were passed, 2 percentage points higher than the previous year. On average each student undertook 2.4 modules and each module was worth on average 14.7 per cent of annual full-time equivalent study
(not in tables).
1 See definitions in Notes Section.
2 The method for defining low participation neighbourhoods changed in 2006/07 and is not comparable with earlier years. See NOTE 3 for further details.
Table
Table 1: Percentage of young entrants to full-time first degree courses from state schools or colleges
UK 86.7 87.4 87.8 88.0 88.5 88.8 88.7
Wales 91.2 91.8 93.1 93.4 93.2 93.2 92.2
England 85.9 86.9 87.2 87.4 88.0 88.4 88.2
Scotland 86.3 85.7 86.6 86.8 86.7 86.8 88.3
N. Ireland 99.7 99.8 99.6 99.7 99.5 99.2 98.9
Country of
institution 2004/05 2005/06 2006/07 2007/08 2008/09 2010/11
[image:3.595.42.487.296.424.2]Source: HESA Performance Indicators in Higher Education in the UK 2009/10
Table 2: Percentage of young full-time first degree entrants from NS-SEC Classes 4,5,6 or 7
UK 28.2 29.3 29.8 29.5 .. 30.0 30.6
Wales 28.4 29.0 30.1 30.4 .. 30.2 31.0
England 27.9 29.1 29.8 29.4 .. 30.1 30.7
Scotland 26.7 27.3 25.9 26.3 .. 25.8 27.2
N. Ireland 41.2 41.0 41.7 40.6 .. 39.1 39.4
2006/07 Country of
institution 2004/05
(a) In 2008/09 UCAS changed the question that informs NS-SEC. In 2009/10 UCAS reverted back to the previous measure. 2008/09 figures are not comparable with the rest of the timeseries and so have been left out.
Source: HESA Performance Indicators in Higher Education in the UK 2010/11 2009/10
2007/08 2008/09(a) 2005/06
Table 3: Percentage of full-time first degree entrants from low-participation neighbourhoods
UK 9.0 9.7 10.1 10.3 10.5 10.6 11.6 11.6 11.9 11.7
Wales 10.2 9.4 10.2 9.8 10.5 12.5 12.5 12.0 13.3 11.7
England 9.6 9.9 10.2 10.5 10.6 11.4 11.6 11.8 11.9 11.9
Scotland (a) .. .. .. .. .. .. .. .. .. ..
N. Ireland 6.7 6.7 6.7 6.2 6.9 8.7 9.2 6.0 7.6 6.3
Young Mature
2008/09 2010/11
2007/08 2006/07 2009/10
Country of
institution 2006/07
(a) '..' indicates the data item is not available.
2008/09 2007/08
2010/11
[image:3.595.43.568.514.636.2]Table 4: Percentage of part-time undergraduate entrants from low-participation neighbourhoods
UK 12.2 12.4 13.3 13.5 13.0 6.4 6.7 6.8 6.7 8.0
Wales 12.2 9.4 12.4 9.2 10.8 7.2 6.4 6.8 6.1 7.0
England 13.0 13.0 13.4 13.8 13.3 6.7 6.8 6.8 6.7 8.1
Scotland (a) .. .. .. .. .. .. .. .. .. ..
N. Ireland 10.9 4.6 6.4 12.5 9.1 1.3 2.3 3.5 3.3 3.4
(a) '..' indicates the data item is not available.
2009/10 2007/08
Country of
institution 2006/07 2008/09 2010/11 2007/08 2008/09 2009/10 2010/11
Young Mature
Source: HESA Performance Indicators in Higher Education in the UK 2006/07
Table 5: Percentage of students in receipt of Disabled Students' Allowance (a)
UK (b) 4.4 4.5 4.7 4.9 5.3 2.3 2.4 2.6 2.9 3.0
Wales 5.4 5.8 5.8 5.7 6.1 1.8 1.4 1.8 1.9 2.7
England (b) 4.4 4.6 4.8 4.9 5.4 2.3 2.5 2.7 3.0 3.5
Scotland 3.6 3.7 3.6 4.1 4.3 2.4 1.7 1.6 2.2 2.3
N. Ireland 3.3 3.5 3.7 3.5 4.1 2.3 2.1 2.4 2.8 2.1
. . . 2.7 .. .. 2.9 ..
(c) '.' indicates the data item is not applicable. '..' indicates the data item is not available. Country of
institution 2009/10
Open University (c)
Full-time, first degree
(b) Excluding Open University.
Source: HESA Performance Indicators in Higher Education in the UK 2007/08
2007/08 2010/11
(a) Unlike the other access indicators, this is based on all undergraduates, not just entrants.
2008/09 2010/11
2006/07
Part-time, undergraduate
2008/09 2009/10 2006/07
Table 6: Percentage of full-time first degree entrants not continuing in HE after their first year
UK 7.1 7.4 7.2 6.5 7.2 14.3 14.8 14.0 12.9 13.3
Wales 7.8 8.9 7.4 6.1 7.6 15.2 17.1 14.9 11.9 14.0
England 6.7 7.1 6.9 6.4 7.1 14.2 14.5 13.9 12.9 13.2
Scotland 8.7 9.0 8.3 7.6 7.6 15.1 16.0 15.0 14.8 14.6
N. Ireland 11.0 8.8 9.9 9.0 8.2 12.3 11.3 11.7 8.8 9.1
Source: HESA Performance Indicators in Higher Education in the UK Country of
institution 2009/10 2005/06 2006/07 2007/08 2008/09
Young Mature
2009/10 2007/08 2008/09
Table 7: Percentage of full-time other undergraduate entrants not continuing in HE after their first year
UK 18.2 18.6 18.3 17.6 18.6 17.3 16.9 14.6 14.7 14.6
Wales 21.5 21.2 20.1 20.6 20.6 31.3 27.1 28.6 21.9 23.2
England 17.0 17.1 17.3 17.0 17.2 16.7 16.2 13.9 14.4 13.8 Scotland 25.3 27.2 24.4 22.3 35.5 17.8 18.3 16.7 14.9 24.4 N. Ireland 21.7 23.4 26.0 16.7 9.4 16.6 32.9 21.2 31.6 19.0
2007/08 2006/07
2005/06
2009/10 2009/10
Source: HESA Performance Indicators in Higher Education in the UK
Young Mature
2008/09 2007/08
2006/07 2005/06
Country of
institution 2008/09
Country of
institution 30 and under Aged over 30 30 and under Aged over 30
UK 33.4 33.3 34.2 32.8
Wales 32.3 29.1 32.1 27.1
England 33.9 33.9 34.9 33.7
Scotland 29.2 31.6 28.0 28.0
N. Ireland 26.1 17.5 21.2 17.4
Source: HESA Performance Indicators in Higher Education in the UK Table 8: Percentage of part-time, first degree entrants not continuing in HE two years after year of entry
Age Age
[image:5.595.45.546.256.409.2]2007/08 2008/09
Table 9: Percentage of full-time students starting a first degree course expected to gain a degree
Country of
institution 2004/05 2005/06 2006/07 2007/08 2008/09 2009/10
UK 77.6 77.4 77.3 77.9 78.8 78.4
Wales 77.1 77.2 75.3 77.5 78.2 76.6
England 78.1 78.0 77.9 78.2 79.2 78.7
Scotland 73.8 72.7 73.0 75.7 75.4 76.3
N. Ireland 77.9 77.7 78.6 77.1 80.9 81.3
Source: HESA Performance Indicators in Higher Education in the UK
Table 10: Percentage of full-time students starting a first degree course not expected to obtain award nor transfer
Country of
institution 2004/05 2005/06 2006/07 2007/08 2008/09 2009/10
UK 14.2 14.1 13.8 13.0 12.3 13.1
Wales 16.5 15.9 17.4 14.5 13.6 14.8
England 13.8 13.9 13.4 12.7 11.9 12.8
Scotland 15.4 14.3 14.4 13.8 13.9 14.2
N. Ireland 17.3 17.6 16.3 17.6 15.2 13.8
[image:5.595.43.468.653.779.2]Notes
1. Related Publications
The information in this Bulletin is taken from 'Performance Indicators in Higher Education in the UK' available on the HESA web-site at http://www.hesa.ac.uk/pi . A 'Guide to Performance Indicators in Higher Education' is also available at this web-site.
2. Data Source
The indicators are designed to provide information on the nature and performance of the higher
education sector in the UK. They contribute to public accountability, and ensure that policy decisions are made on the basis of consistent and reliable information. The Performance Indicators are specified by the Performance Indicators Steering Group (PISG) made up of funding bodies, government departments and representative bodies. They are calculated and published on behalf of PISG by HESA.
PISG has led the development of these indicators. Members are drawn from the four higher education funding bodies for England, Scotland, Wales and Northern Ireland (HEFCE, SHEFC, HEFCW, DEL); government departments including the Welsh Government, the Higher Education Statistics Agency, and the universities and colleges through their representative bodies (Universities UK and SCOP).
The HESA PI tables provide an indicator for each institution and a benchmark. The indicator shows how well the institution performed. The benchmark is an adjusted average based on the characteristics of each institution. Benchmarks are adjusted according to the subject mix offered, age profile of students and qualifications of students on entry. The benchmark can be used in two ways: To see how well an HEI is performing compared to the HE sector as a whole and to decide whether it is meaningful to compare two institutions – for example it probably isn’t worth comparing a specialist art college with a large university offering a wide range of subjects. More details regarding the use of benchmarks can be found on the HESA website at
http://www.hesa.ac.uk/index.php?option=com_content&task=view&id=2059&Itemid=141
Please refer to the following HESA web page for information relating to changes that have been made to the Performance Indicators used in the Bulletin since 2001/02:
http://www.hesa.ac.uk/index.php?option=com_content&task=view&id=2055&Itemid=141
3 Definitions
3.1 Coverage
All the tables are based on students who are residents of England, Scotland, Wales or Northern Ireland. Most of the indicators are shown separately for young and mature students. In addition, most of them refer just to students on undergraduate courses. 2008/09 was the first year in which a non-continuation indicator was provided for part-time students.
3.2 Age
Many of the tables are split between young and mature students, defined as follows:
• Young students are those who are under 21 at 30 September of the academic year in which they are recorded as entering the institution - for students recorded as entering an institution in 2008/09, young students are those born after 30 September 1987.
• Mature students are those who are 21 or over, also at 30 September of the academic year in which they are recorded as entering the institution.
3.3 National Statistics Socio-Economic Classification (NS-SEC)
The information on Economic Classification (SEC) is taken from the National Statistics Socio-Economic Classification (NS-SEC). The classifications used are:
NS-SEC 1: Higher managerial and professional occupations
NS-SEC 2: Lower managerial and professional occupations
NS-SEC 3: Intermediate occupations
NS-SEC 4: Small employers and own account workers
NS-SEC 5: Lower supervisory and technical occupations
NS-SEC 6: Semi-routine occupations
NS-SEC 7: Routine occupations
UCAS changed the question that informs NS-SEC for the majority of applicants for the 2008/09
academic year, but reverted to the original question for applicants in 2009/10. For applicants up to and including the 2007/08 academic year and for applicants in 2009/10, UCAS asked:
“If you are under 21, please give the occupation of your parent, step-parent or guardian who earns the most. If he or she is retired or unemployed, give their most recent occupation. If you are 21 or over, please give your own occupation.”
For applicants for 2008/09 entry only, UCAS asked:
“If you are in full-time education, please state the occupation of the highest earning family member of the household in which you live. If he or she is retired or unemployed, give their most recent occupation. If you are not in full-time education, please state just your own occupation.”
The change in question between 2007/08 and 2008/09 had an impact on the NS-SEC indicators, causing the proportion of students classified as ‘unknown’ and those classified as falling in to NS-SEC groups 4-7 to rise. NS-SEC data from 2008/09 was deemed by HESA to be not comparable with that published previously, and is therefore excluded from Table 2. While figures for 2009/10 are included in this table, there might be a slight impact on them caused by some applicants deferring their application to 2009/10 while using the 2008/09 form.
3.4 Low-participation neighbourhoods
This indicator is based on the revised POLAR definitions of low participation areas. For this indicator, which is applied to young and mature, full-time and part-time entrants, a ward is defined as low
participation if its participation rate places it in the bottom 20 per cent of wards ranked by this measure. Students have been allocated to these neighbourhoods on the basis of their postcodes. Due to this change in methodology this indicator is not comparable with years before 2006/07. More information about this change can be found at;
http://www.hesa.ac.uk/index.php?option=com_content&task=view&id=2055&Itemid=141
The low participation measure is based on a UK wide classification of areas into participation bands. The relatively high (in UK terms) participation rate in Scotland coupled with the very high proportion of HE that occurs in FE colleges means that the figures for Scottish institutions could, when viewed in isolation, misrepresent their contribution to widening participation. Low participation data has therefore not been produced for institutions in Scotland.
3.5 Disabled students
4 Key quality information
Data for the Open University have been suppressed for the years 2007/08 and 2008/09 because changes introduced by HESA to the method of apportioning FTEs between years affected the reliability of this indicator for Open University students.
4.1 Relevance
HESA is the official agency for the collection, analysis and dissemination of quantitative information about higher education. It was set up by agreement between the relevant government departments, the higher education funding councils and the universities and colleges. The primary purpose of the Student data collection is to provide each of the bodies listed above with accurate and comprehensive statistical information regarding student enrolments.
The statistics are used both within and outside the Welsh Government to monitor the performance of at Welsh HEIs. Some of the key users are:
• Ministers and the Members Research Service in the National Assembly for Wales;
• Officials in the Welsh Government;
• Other government departments;
• The Higher Education Funding Council for Wales;
• Higher Education Institutions and representative bodies;
• Students, researchers, and academics;
• Individual citizens, private companies, and the media;
These statistics are used in a variety of ways. Some examples of these are:
• Advice to Ministers;
• To inform the education policy decision-making process in Wales;
Further information about the performance indicators and specific data issues can be found at the web address provided in the opening paragraph of this note.
4.2 Comparability
The Performance Indicators are in general consistent across all UK countries and data for higher education institutions in England, Scotland and Northern Ireland are presented in this Bulletin.
Further UK data, including at an institution level, contained in the Higher Education Statistics Agency (HESA) report “Performance Indicators in Higher Education in the UK 2010/11” can be found at
http://www.hesa.ac.uk/pi.
StatsWales