Statistical First
Release
DESTINATIONS OF KEY STAGE 4 AND KEY STAGE 5 PUPILS, 2009/10
OSR13/2012
17 July 2012
Coverage: England
Theme: Children, Education and Skills
Issued by
Department for Education Sanctuary Buildings Great Smith Street London SW1P 3BT
Telephone: Press Office
020 7783 8300
Public Enquiries
0370 000 2288
Statistician
Stephen Harris
Destination.measures@ed ucation.gsi.gov.uk
Internet
http://www.education.gov.uk/r sgateway/DB/STA/t001076/in dex.shtml
These are experimental statistics.
INTRODUCTION
This Statistical Release on Education Destination Measures shows the percentage of students progressing to further learning in a school, Further Education or 6th Form College, Apprenticeship, work based learning provider or Higher Education Institution. Two destination measures are being introduced to show the destinations of young people the year after KS4 and the year after taking A level or equivalent qualifications (KS5):
• The Key Stage 4 Measure is based on activity at academic age 16 (i.e. the year after the young person finished compulsory schooling)
• The Key Stage 5 Measure is based on activity in the year after the young person took their A Level or equivalent qualification/s
To be included in the Measure, young people have to show sustained
participation in an education destination in all of the first two terms of the year after they completed KS4 or took A level or equivalent qualifications. The first two terms is defined as October to March.
The statistics are published as "Experimental Statistics" and do not display the National Statistics Logo. They are still being evaluated and remain subject to further testing to determine their reliability and ability to meet customer needs. The figures should be treated with caution as this is the first year for which such data have been produced. As improvements are made to the methodology, data quality will be assessed to establish whether the statistics meet the quality standards for National Statistics.
DESTINATIONS IN THE YEAR AFTER TAKING KEY STAGE 4, 2009/10,
National (Table 1)
• 85% of young people were recorded as being in a sustained education destination in the year after Key Stage 4
o School Sixth Form (36% of young people) and Further Education College (33%) were the most popular destinations
o 12% of young people were studying in a Sixth Form College
o 4% were taking an Apprenticeship in these institutions
• Just under 1 in 10 (9%) of young people did not fulfil the two term criteria for sustained participation in an education destination
Scottish or Welsh college or school
Local Authority (Table LA1)
• Brent, Harrow, Redbridge and Sutton had the highest percentage of young people recorded as being in sustained education in the year after they took their KS4, at 91%
• Knowsley had the lowest percentage of young people recorded as being in sustained education, at 75%
DESTINATIONS IN THE YEAR AFTER TAKING A LEVEL OR EQUIVALENT QUALIFICATIONS, 2009/10, National (Table 2)
• 64% of young people were recorded as being in a sustained education destination in the year after they took their A Level or equivalent qualification/s (KS5):
o 8% were studying in a Further Education College, with a further 2% studying in a School Sixth Form or Sixth Form College
o 2% were taking an Apprenticeship in these institutions
o 52% went to a Higher Education Institution, with 1% studying at the University of Oxford or Cambridge and 8% at another Russell Group University (see Technical Note for a list of these universities)
• Just under 1 in 10 (8%) of young people did not fulfil the two term criteria for sustained participation
• Over a quarter (28%) of young people were not captured in the education destination data. These young people may have been in employment, not in employment, education or training (NEET), on a gap year, left the country, or attending a Scottish or Welsh college or school
Local Authority (Table LA2)
• Harrow had the highest percentage of young people recorded as being in sustained education in the year after their A level or equivalent qualifications/s, at 79%
TABLES
Table 1 Percentage of 2008/09 KS4 cohort going to, or remaining in, an
education destination in 2009/10, England.
Table 2 Percentage of students in 2008/09, who entered an A Level or
equivalent qualification going to, or remaining in, an education destination in 2009/10, England.
Table LA1 Percentage of 2008/09 KS4 cohort going to, or remaining in, an
education destination in 2009/10, Local Authority.
Table LA2 Percentage of students, in 2008/09, who entered an A Level or equivalent
qualification going to, or remaining in, an education destination in 2009/10, Local Authority.
Additional Information
Supplementary tables showing figures at institution level are available on the DfE statistics website
Table INST1A – INST1I Percentage of 2008/09 KS4 cohort going to, or remaining in, an
education destination in 2009/10, Institution.
Table INST2A – INST2I Percentage of students, in 2008/09, who entered an A Level or equivalent
qualification going to, or remaining in, an education destination in 2009/10, Institution.
In order to improve data accessibility, underlying data will be published on 17 July 2012 in the
‘Publication’s Underlying Data’ section. This will include the numbers going to an education destination at National, LA and Institution level for KS4 and KS5.
Additional information and underlying data will be published at:
http://www.education.gov.uk/rsgateway/DB/STA/t001076/index.shtml
EVALUATION OF THE DATA (by 1 October 2012)
In order for the Department to meet user needs it is essential that we capture feedback from those who access the data. One approach we use to obtain the views and opinions from our users is the Evaluation questionnaire.
This questionnaire provides the opportunity for our users to share their views on how the first release of Key Stage 4 and Key Stage 5 Destination Measures has met their needs, how the Statistical First
release/technical note could be developed and analysis you would ideally like to see incorporated into the next release. The link to the questionnaire is below. Please complete before 1 October 2012.
http://www.surveymonkey.com/s/SXFDKWC
RELATED PUBLICATIONS
DfE: Participation in Education, Training and Employment by 16-18 Year Olds in England, end 2011
TECHNICAL NOTES
A detailed technical note is published alongside the Statistical First Release at
http://www.education.gov.uk/rsgateway/DB/STA/t001076/index.shtml Experimental Statistics
1. This is the first publication on Destination Measures and is classified as experimental sstatistics as the data are still being evaluated and remain subject to further testing in terms of their reliability and ability to meet customer needs. The data should be treated with caution as this is the first year for which such data have been produced.
Cohort
2. This SFR reports on young people in Key Stage 4 (KS4) and Key Stage 5 (KS5) in the 2008/09 academic year and identifies their education destinations in the 2009/10 academic year.
KS4
The 2008/09 cohort is obtained from the published Performance Tables (PT) where
• Young people are identified as being at the end of KS4. In the majority of schools, pupils in Year 11 in the 2008/09 school year were at the end of KS4, but some may have completed this Key Stage in an earlier or later year group.
The base cohort includes students in English Maintained Mainstream schools only.
KS5
The 2008/09 cohort is obtained from the published Performance Tables where
• Young people aged 16, 17 or 18, were entered for A levels or other Level 3 equivalent
qualifications during the 2008/2009 academic year; this is otherwise referred to as ‘Key Stage 5’. The qualifications included in the tables are on the basis of their equivalence with A levels; A qualification's 'equivalence' is quantified by looking at its size and the level of challenge it poses compared to an A level. An ‘AS’ is a Level 3 qualification but students only get included in the cohort if they have undertaken a qualification equivalent to the size of an A-level
The Destination Measures KS5 cohort is for Maintained Mainstream schools plus the addition of Further Education Colleges and Sixth Form Colleges.
Time Lag
3. Creation of the Destination Measures requires higher education (HESA) data to be matched to the pupil data in the National Pupil Database. The HESA data used in this Release are for the academic year 2009/10 and these are the most recent data to have been matched. This publication is therefore reporting on 2008/09 KS4 and KS5 (A level or equivalent qualification/s) students who went on to education destinations in 2009/10.
Data sources
4. For this publication, data from the National Pupil Database (NPD) has been used. The NPD is a longitudinal database linking pupil/student characteristics (eg age, gender, ethnicity) to school and college learning aims and attainment information for children in schools in England. Three
administrative data sources used in compiling the NPD have been used to determine the education destinations, namely:
• Individualised Learner Record (ILR) covering English colleges and Further Education providers
• School Census (SC) covering English schools
Russell Group Universities
5. The Russell Group, as at June 2009, comprised:
University of Birmingham University of Bristol University of Cambridge Cardiff University
University of Edinburgh University of Glasgow Imperial College London King's College London University of Leeds University of Liverpool
London School of Economics & Political Science University of Manchester
Newcastle University University of Nottingham University of Oxford Queen's University Belfast University of Sheffield University of Southampton University College London University of Warwick
Suppression
6. For any institutions where the total number of students in the 2008/09 cohort is fewer than 6, all data have been suppressed. For breakdowns of students, any numbers of fewer than 3 have been
suppressed, being replaced in the table by an ‘x’. Where the numerator of a percentage is fewer than 3, this has been suppressed and replaced by an ‘x’. All totals have been rounded to the nearest 10 to ensure individuals can not be identified. Where any number is shown as zero (0), the original figure was also zero.
Symbols used in the publication
The following symbols have been used in this publication:
0 - zero
Enquiries
1. Enquiries (non-media) or feedback about information contained in this document should be addressed to Product Development Unit, Department for Education, Sanctuary Buildings, Great Smith Street, London SW1P 3BT or e-mail [email protected]
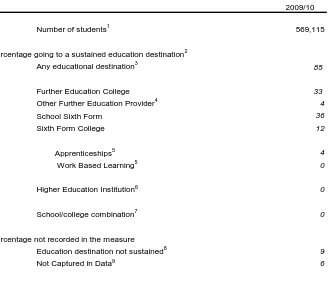
Table 1. Percentage of 2008/09 KS4 cohort going to, or remaining in, an education destination in 2009/10 Year: 2009/10
Coverage: England
2009/10
Number of students1 569,115
Percentage going to a sustained education destination2
Any educational destination3 85
Further Education College 33
Other Further Education Provider4 4
School Sixth Form 36
Sixth Form College 12
Apprenticeships5 4
Work Based Learning5 0
Higher Education Institution6 0
School/college combination7 0
Percentage not recorded in the measure Education destination not sustained8 9
Not Captured in Data9 6
Source: National Pupil Database
1. Number of students in the 2008/09 KS4 cohort.
2. Includes students who have been in a sustained education destination for the first two terms, October to March.
3. Individual lines may not add up to totals as there is a small number of students who were identified in more than one destination.
4. Other Further Education Providers includes students undertaking Further Education provision at a Higher Education Institution
6. The Higher Education Institution (HEI) percentage includes UK Higher Education Institutions only.
7. School/College combination means the student fulfilled the October to March participation criteria but through more than one type of education destination.
8. 'Education destination not sustained' means the student did not have continuous participation in education destinations from October to March.
9. 'Not captured in data' means the young person was not found in an education destination. Possible reasons for this could be that the young person was in employment, not in employment, education or training (NEET), on a gap year, left the country, or attending a Scottish or Welsh college or school.
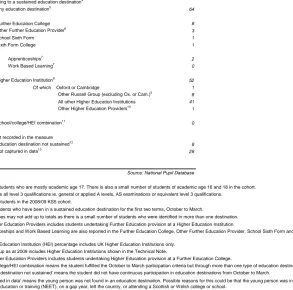
Year: 2009/10 Coverage: England
2009/10
Number of students3
313,340
Percentage going to a sustained education destination4 Any education destination5
64
Further Education College 8
Other Further Education Provider6 3
School Sixth Form 1
Sixth Form College 1
Apprenticeships7
2
Work Based Learning7 0
Higher Education Institution8 52
Of which Oxford or Cambridge 1 Other Russell Group (excluding Ox. or Cam.)9
8 All other Higher Education Institutions 41 Other Higher Education Providers10
1
School/college/HEI combination11 0
Percentage not recorded in the measure Education destination not sustained12
8 Not captured in data13
28
Source: National Pupil Database
1. These are students who are mostly academic age 17. There is also a small number of students of academic age 16 and 18 in the cohort.
2. This includes all level 3 qualifications ie. general or applied A levels, AS examinations or equivalent level 3 qualifications.
3. Number of students in the 2008/09 KS5 cohort.
4. Includes students who have been in a sustained education destination for the first two terms, October to March.
5. Individual lines may not add up to totals as there is a small number of students who were identified in more than one destination.
6. Other Further Education Providers includes students undertaking Further Education provision at a Higher Education Institution
8. The Higher Education Institution (HEI) percentage includes UK Higher Education Institutions only. 9. Russell Group as at 2009 includes Higher Education Institutions shown in the Technical Note.
10. Other Higher Education Providers includes students undertaking Higher Education provision at a Further Education College.
[image:8.595.42.336.116.407.2]11. School/College/HEI combination means the student fulfilled the October to March participation criteria but through more than one type of education destination. 12. 'Education destination not sustained' means the student did not have continuous participation in education destinations from October to March.
Table 2. Percentage of students1, in 2008/09, who entered an A Level or equivalent qualification2, going to, or remaining in, an education destination in 2009/10
7. All Apprenticeships and Work Based Learning are also reported in the Further Education College, Other Further Education Provider, School Sixth Form and Sixth Form College lines.
Table LA1. Percentage of 2008/09 KS4 cohort going to, or remaining in, an education destination in 2009/10 Year: 2009/10
Coverage: Local Authority
Code Local Authority
Number of students1
Any education
destination3
Further Education
College
Other Further Education
Provider4
School Sixth Form
Sixth Form College
Apprentice-ships5
Work Based Learning5
Higher Education Institution6
School/college combination7
Education destination not
sustained8
Not Captured in Data9
ENGLAND 569,115 85 33 4 36 12 4 0 0 0 9 6
NORTH EAST
841 Darlington 1,160 84 28 6 8 41 6 0 0 0 11 5
840 Durham 5,565 83 41 4 32 6 6 x 0 x 12 5
390 Gateshead 2,115 83 28 6 49 0 8 0 0 0 13 4
805 Hartlepool 1,225 86 35 6 15 30 7 0 0 0 10 4
806 Middlesbrough 1,705 80 41 10 15 15 7 0 0 0 15 6
391 Newcastle upon Tyne 2,670 80 22 6 51 0 7 x x 0 14 6
392 North Tyneside 2,245 83 31 6 46 0 8 0 0 0 12 5
929 Northumberland 3,740 84 23 5 57 x 6 0 0 0 11 5
807 Redcar and Cleveland 1,880 85 40 6 9 30 8 0 0 x 11 4
393 South Tyneside 1,840 83 56 9 18 0 9 x 0 x 13 5
808 Stockton-on-Tees 2,365 84 44 7 12 22 6 x 0 0 11 5
394 Sunderland 3,445 81 54 9 18 0 9 x 0 x 14 4
NORTH WEST
889 Blackburn with Darwen 1,760 87 49 5 17 15 4 x 0 0 9 4
890 Blackpool 1,615 81 40 7 6 29 7 x 0 0 12 7
350 Bolton 3,575 83 41 5 20 17 5 0 0 0 11 6
351 Bury 2,195 85 50 4 1 30 5 0 0 0 10 5
895 Cheshire East 3,975 86 40 4 38 5 3 x 0 0 8 5
896 Cheshire West and Chester 3,885 84 32 4 35 12 5 0 0 x 9 7
909 Cumbria 6,040 83 26 11 41 6 9 x 0 0 10 7
876 Halton 1,500 80 42 5 13 20 6 0 0 x 15 6
340 Knowsley 1,605 75 52 9 7 8 9 0 0 0 17 8
888 Lancashire 13,400 85 47 5 16 18 6 0 0 x 9 5
341 Liverpool 5,230 84 22 7 54 1 7 0 0 0 11 5
352 Manchester 4,580 81 39 15 10 18 4 0 0 0 12 7
353 Oldham 3,000 85 36 5 15 29 4 x 0 x 11 5
354 Rochdale 2,560 82 52 4 13 13 5 x 0 x 11 7
355 Salford 2,285 81 66 10 4 1 7 0 0 0 15 5
343 Sefton 3,465 86 28 7 35 16 8 x 0 x 10 4
342 St. Helens 2,115 84 32 5 24 24 7 x 0 x 11 5
356 Stockport 3,000 83 23 4 5 51 6 x 0 0 11 6
357 Tameside 2,940 82 33 6 7 37 7 0 0 0 11 6
358 Trafford 2,845 87 34 11 37 5 3 0 0 0 8 5
877 Warrington 2,525 88 23 5 24 36 7 0 0 0 8 4
359 Wigan 3,855 83 42 7 7 27 8 x x x 12 5
344 Wirral 3,915 86 13 6 55 11 6 0 0 0 10 4
Percentage going to a sustained education destination2 Percentage not recorded in
Code Local Authority
Number of students1
Any education
destination3
Further Education
College
Other Further Education
Provider4
School Sixth Form
Sixth Form College
Apprentice-ships5
Work Based Learning5
Higher Education Institution6
School/college combination7
Education destination not
sustained8
Not Captured in Data9
Percentage going to a sustained education destination2 Percentage not recorded in
the measure
YORKSHIRE AND THE HUMBER
370 Barnsley 2,615 82 65 8 7 1 10 0 0 0 10 8
380 Bradford 5,795 82 25 4 52 1 4 0 0 x 12 6
381 Calderdale 2,610 85 24 3 47 12 4 0 0 x 11 4
371 Doncaster 3,610 80 26 6 44 3 8 x 0 x 14 6
811 East Riding of Yorkshire 3,995 88 31 5 43 9 6 x x 0 7 4
810 Kingston Upon Hull, City of 2,840 79 32 8 6 33 10 0 0 x 14 6
382 Kirklees 4,620 83 28 3 18 33 6 0 0 x 12 5
383 Leeds 8,155 81 27 5 41 9 3 0 0 x 12 7
812 North East Lincolnshire 1,930 82 39 5 9 29 6 0 0 0 12 6
813 North Lincolnshire 2,010 86 38 5 5 38 7 0 0 0 10 5
815 North Yorkshire 6,895 86 25 7 44 10 4 x 0 0 8 7
372 Rotherham 3,615 80 32 5 26 17 5 0 0 0 15 6
373 Sheffield 5,645 83 39 8 26 11 8 0 0 x 12 5
384 Wakefield 3,930 78 30 5 22 21 6 x 0 0 14 8
816 York 1,695 86 47 3 36 x 5 x 0 0 7 6
EAST MIDLANDS
831 Derby 2,810 83 42 7 32 2 7 0 0 x 12 5
830 Derbyshire 8,845 84 30 11 38 4 5 x x 0 10 6
856 Leicester 3,410 86 24 3 13 45 3 0 0 0 9 6
855 Leicestershire 7,330 87 29 2 52 3 4 0 0 x 9 5
925 Lincolnshire 8,305 83 33 3 44 2 5 x 0 x 10 7
928 Northamptonshire 7,900 84 32 3 49 0 4 x x 0 10 6
892 Nottingham 2,735 78 40 4 22 12 5 0 0 x 15 7
891 Nottinghamshire 9,170 84 33 5 41 5 5 0 x x 10 6
857 Rutland 475 82 63 1 13 5 4 x 0 0 8 10
WEST MIDLANDS
330 Birmingham 12,000 82 27 9 32 15 3 0 0 0 10 8
331 Coventry 3,440 86 32 5 49 0 5 x 0 0 9 5
332 Dudley 3,900 86 61 4 8 13 7 0 0 0 8 6
884 Herefordshire 1,900 85 30 6 14 35 6 x 0 0 8 7
333 Sandwell 3,585 81 40 8 30 3 7 x 0 x 12 7
893 Shropshire 3,185 83 33 3 20 27 4 0 0 0 9 8
334 Solihull 3,035 84 27 4 29 24 5 x 0 0 9 7
860 Staffordshire 9,685 86 40 5 40 2 5 x 0 0 9 5
861 Stoke-on-Trent 2,655 82 43 8 10 21 6 0 0 0 12 6
894 Telford and Wrekin 2,070 86 33 7 24 23 5 0 0 0 10 4
335 Walsall 3,660 81 28 6 47 0 5 0 0 0 11 7
937 Warwickshire 5,810 85 39 3 35 9 4 0 0 0 10 6
336 Wolverhampton 2,680 84 29 4 50 0 6 x 0 x 10 5
Code Local Authority
Number of students1
Any education
destination3
Further Education
College
Other Further Education
Provider4
School Sixth Form
Sixth Form College
Apprentice-ships5
Work Based Learning5
Higher Education Institution6
School/college combination7
Education destination not
sustained8
Not Captured in Data9
Percentage going to a sustained education destination2 Percentage not recorded in
the measure
EAST OF ENGLAND
822 Bedford 1,810 87 26 2 59 x 3 x 0 0 7 5
823 Central Bedfordshire 2,815 87 30 2 54 1 4 x 0 0 8 5
873 Cambridgeshire 5,745 88 32 1 24 30 3 x 0 x 7 5
881 Essex 15,935 84 29 6 34 15 5 x x 0 9 7
919 Hertfordshire 12,745 88 26 1 60 0 2 0 0 x 7 5
821 Luton 2,390 89 34 3 7 45 3 x 0 0 8 3
926 Norfolk 8,815 82 37 3 32 10 4 0 0 0 10 8
874 Peterborough 2,240 76 27 4 45 x 3 x 0 x 12 12
882 Southend-on-Sea 2,150 85 26 1 50 8 3 0 0 x 9 5
935 Suffolk 7,680 84 27 8 43 6 4 0 0 0 9 7
883 Thurrock 1,845 82 9 23 4 45 3 x 0 0 9 9
LONDON INNER LONDON
202 Camden 1,420 85 17 2 63 3 1 x 0 0 9 6
201 City of London . . . .
204 Hackney 1,305 86 29 1 40 15 1 0 0 0 9 5
205 Hammersmith and Fulham 1,010 88 28 1 52 7 1 0 0 x 6 6
309 Haringey 2,115 85 26 2 41 17 1 0 0 0 8 6
206 Islington 1,390 84 52 2 21 10 1 x 0 0 9 6
207 Kensington and Chelsea 560 90 29 1 45 14 1 0 0 0 6 4
208 Lambeth 1,505 88 34 2 35 17 1 0 0 x 8 4
209 Lewisham 2,080 88 25 2 43 18 2 0 0 0 7 6
316 Newham 3,395 87 21 3 21 43 1 x 0 0 8 5
210 Southwark 2,310 84 29 4 27 25 2 0 0 x 10 6
211 Tower Hamlets 2,330 84 32 3 40 9 1 x 0 x 10 5
212 Wandsworth 1,780 88 25 2 54 7 1 x 0 0 7 5
213 Westminster 1,290 86 20 1 59 5 1 0 0 0 8 6
OUTER LONDON
301 Barking and Dagenham 2,020 85 22 3 55 5 2 0 0 0 9 5
302 Barnet 3,205 88 17 1 62 7 1 0 0 0 6 5
303 Bexley 3,150 88 26 2 55 5 3 x 0 x 7 4
304 Brent 2,755 91 22 1 65 4 1 0 0 x 5 5
305 Bromley 3,440 88 18 2 68 1 3 0 0 0 7 5
306 Croydon 3,595 87 27 2 40 18 2 0 0 x 8 6
307 Ealing 2,740 90 30 1 57 2 1 0 0 x 6 4
308 Enfield 3,580 88 23 1 57 8 1 x 0 0 6 5
203 Greenwich 2,390 83 18 2 52 10 2 0 0 x 9 8
310 Harrow 2,125 91 37 1 38 15 1 0 0 0 5 4
311 Havering 2,995 87 27 4 24 33 3 x 0 0 6 6
312 Hillingdon 2,885 86 26 3 57 1 4 0 0 x 7 6
313 Hounslow 2,515 90 24 1 61 3 1 0 0 x 6 4
314 Kingston upon Thames 1,455 90 16 2 68 5 2 0 0 0 5 5
315 Merton 1,530 86 42 2 35 8 2 0 0 0 9 5
317 Redbridge 3,205 91 15 1 72 3 1 x 0 0 5 4
318 Richmond upon Thames 1,395 85 57 2 4 22 2 0 0 0 9 7
319 Sutton 2,550 91 21 2 65 3 3 0 0 x 5 4
Code Local Authority
Number of students1
Any education
destination3
Further Education
College
Other Further Education
Provider4
School Sixth Form
Sixth Form College
Apprentice-ships5
Work Based Learning5
Higher Education Institution6
School/college combination7
Education destination not
sustained8
Not Captured in Data9
Percentage going to a sustained education destination2 Percentage not recorded in
the measure
SOUTH EAST
867 Bracknell Forest 1,100 86 29 5 39 13 3 0 0 x 9 5
846 Brighton and Hove 2,210 84 22 2 18 42 3 0 0 0 9 7
825 Buckinghamshire 5,460 88 20 2 63 3 2 x 0 0 6 5
845 East Sussex 5,090 86 51 2 18 15 3 0 0 x 8 6
850 Hampshire 13,830 86 38 2 6 40 4 0 0 x 8 5
921 Isle of Wight 1,480 86 36 4 45 1 5 0 0 x 9 5
886 Kent 16,400 85 22 5 57 0 3 0 x 0 9 6
887 Medway 3,340 84 28 4 51 0 3 0 0 x 10 6
826 Milton Keynes 2,590 84 27 1 55 x 2 x 0 x 11 6
931 Oxfordshire 6,220 83 28 3 46 6 3 x x 0 8 9
851 Portsmouth 1,930 82 56 3 x 23 3 0 0 0 11 7
870 Reading 940 84 2 19 55 7 3 0 0 x 9 8
871 Slough 1,450 90 19 4 64 3 2 0 0 0 6 4
852 Southampton 2,220 79 22 3 2 51 4 x 0 0 14 7
936 Surrey 10,290 86 25 2 32 27 2 0 0 x 8 6
869 West Berkshire 1,970 85 16 8 59 3 4 0 0 0 9 6
938 West Sussex 8,090 86 42 1 29 13 3 0 0 x 8 6
868 Windsor and Maidenhead 1,520 87 19 5 58 6 2 0 0 x 7 6
872 Wokingham 1,680 87 10 11 56 10 3 0 0 0 7 6
SOUTH WEST
800
Bath and North East
Somerset 2,130 82 31 2 38 11 5 0 0 x 13 5
837 Bournemouth 1,750 82 40 4 39 x 5 0 0 x 11 7
801 Bristol, City of 3,030 82 38 4 31 10 6 x 0 x 11 6
908 Cornwall 5,940 86 58 1 27 0 4 x 0 0 9 5
878 Devon 7,620 85 49 2 33 2 5 x x 0 8 7
835 Dorset 4,310 85 32 3 50 0 6 0 0 0 9 6
916 Gloucestershire 6,780 86 36 2 48 0 3 0 0 0 9 5
420 Isles of Scilly 20 80 40 0 40 0 0 0 0 0 0 20
802 North Somerset 2,240 89 50 2 37 0 6 0 0 0 6 5
879 Plymouth 2,900 85 18 3 64 x 7 0 0 0 11 4
836 Poole 1,660 84 29 2 53 0 4 0 0 0 9 7
933 Somerset 5,640 85 54 3 17 10 6 x 0 x 8 7
803 South Gloucestershire 3,080 87 31 4 47 6 5 0 0 x 9 4
866 Swindon 2,210 87 72 1 13 0 2 x 0 0 8 6
880 Torbay 1,470 87 40 1 46 x 4 0 0 0 9 4
865 Wiltshire 5,000 86 37 2 45 2 3 x 0 0 8 6
Source: National Pupil Database
1. Number of students in the 2008/09 KS4 cohort.
2. Includes students who have been in a sustained education destination for the first two terms, October to March.
3. Individual lines may not add up to totals as there is a small number of students who were identified in more than one destination. 4. Other Further Education Providers includes students undertaking Further Education provision at a Higher Education Institution.
6. The Higher Education Institution (HEI) percentage includes UK Higher Education Institutions only.
7. School/College combination means the student fulfilled the October to March participation criteria but through more than one type of education destination. 8. 'Education destination not sustained' means the student did not have continuous participation in education destinations from October to March.
9. 'Not captured in data' means the young person was not found in an education destination. Possible reasons for this could be that the young person was in employment, not in employment, education or training (NEET), on a gap year, left the country, or attending a Scottish or Welsh college or school.
“x“ means the data has been suppressed as the school or college has fewer than 6 students in a particular denominator, or small numbers for the numerator (1’s and 2’s). Results are not shown because of the risk of an individual student being identified. All totals have been rounded to the nearest 10. Zeros are shown as zeros. See Technical Note for further detail.
5. All Apprenticeships and Work Based Learning are also reported in the Further Education College, Other Further Education Provider, School Sixth Form and Sixth Form College lines. Apprenticeships and Work Based Learning are identified where any qualifying learning has occurred at any time during the October to March participation period.
Year: 2009/10
Coverage: Local Authority
Code Local Authority
Number of students3
Any education destination5
Further Education
College
Other Further Education
Provider6
School Sixth Form
Sixth Form College
Apprentice-ships7
Work Based Learning7
Higher Education
Institution8 Oxford or
Cambridge Other Russell
Group (excluding
Ox. or Cam.)9
All other HEIs
Other HE Providers10
School/college/ HEI combination11
Education destination
not sustained12
Not Captured in Data13
ENGLAND 313,340 64 8 3 1 1 2 0 52 1 8 41 1 0 8 28
North East
841 Darlington 1,150 65 3 1 0 3 2 x 56 0 7 48 1 0 9 27
840 Durham 2,340 66 9 3 1 x 4 x 52 0 8 41 3 0 11 23
390 Gateshead 1,110 70 13 4 2 0 4 0 51 0 9 39 4 0 9 21
805 Hartlepool 710 72 6 5 1 4 6 0 57 x 7 49 1 0 9 19
806 Middlesbrough 1,040 68 6 3 0 2 3 0 57 0 3 47 6 0 12 20
391 Newcastle upon Tyne 1,940 69 9 2 3 0 2 x 55 1 8 38 8 0 10 21
392 North Tyneside 940 74 9 4 2 0 5 x 58 1 13 41 4 0 10 16
929 Northumberland 1,710 65 9 4 2 0 4 0 51 0 11 38 3 0 10 25
807 Redcar and Cleveland 870 75 6 4 0 1 5 x 64 x 7 55 1 0 10 15
393 South Tyneside 550 70 14 4 1 0 5 x 51 0 7 41 2 0 9 21
808 Stockton-on-Tees 1,020 71 6 3 x 2 3 x 60 1 8 50 0 x 9 20
394 Sunderland 1,290 68 5 3 1 0 4 x 59 x 6 50 3 0 11 21
North West
889 Blackburn with Darwen 1,370 70 6 2 x 3 2 x 60 0 6 45 8 0 8 21
890 Blackpool 1,250 66 6 3 x 0 3 x 57 1 5 44 8 0 10 24
350 Bolton 1,260 70 5 1 2 1 1 0 61 x 8 52 1 0 9 20
351 Bury 1,940 67 4 2 0 1 2 x 60 0 10 49 0 0 8 25
895 Cheshire East 2,570 63 9 3 1 0 2 0 51 1 11 37 2 0 7 30
896 Cheshire West and Chester 2,630 70 8 2 1 0 2 0 59 1 13 43 3 0 6 24
909 Cumbria 2,860 66 5 6 2 1 5 x 52 1 10 41 1 0 9 25
876 Halton 430 66 8 2 2 x 2 0 54 0 3 50 1 0 9 25
340 Knowsley 370 64 21 1 1 0 4 x 41 0 2 38 x 0 12 23
888 Lancashire 6,860 64 6 2 1 0 2 0 55 1 11 43 1 0 10 26
341 Liverpool 2,640 74 9 2 4 0 2 0 59 1 15 42 1 0 8 18
352 Manchester 2,590 68 5 4 0 3 1 0 56 0 12 41 2 0 7 25
353 Oldham 1,760 71 11 1 x 0 2 0 59 0 11 47 0 0 8 21
354 Rochdale 720 58 14 3 1 0 3 x 42 0 3 36 3 0 12 30
355 Salford 1,320 65 8 2 1 0 2 0 55 0 7 46 2 0 8 26
343 Sefton 2,300 65 7 2 1 1 2 0 54 0 11 42 1 0 10 25
342 St. Helens 1,510 77 13 2 1 3 4 0 57 x 13 41 4 0 8 15
356 Stockport 2,060 67 7 2 x 2 3 0 56 1 11 42 3 0 9 24
357 Tameside 1,250 62 5 2 0 0 2 x 54 0 9 44 1 0 8 29
358 Trafford 1,510 69 5 3 0 0 2 0 60 2 21 35 2 0 6 25
877 Warrington 1,400 66 5 2 1 2 2 x 56 1 10 44 1 0 9 25
359 Wigan 2,240 70 6 2 0 2 2 0 60 1 14 41 4 0 10 20
344 Wirral 2,310 72 11 2 1 1 2 0 56 1 16 39 1 0 9 19
Higher Education Institutions (HEIs)
[image:13.595.26.810.112.578.2]Percentage going to a sustained education destination4 Percentage not recorded in the measure
Code Local Authority
Number of students3
Any education destination5
Further Education
College
Other Further Education
Provider6
School Sixth Form
Sixth Form College
Apprentice-ships7
Work Based Learning7
Higher Education
Institution8 Oxford or Cambridge
Other Russell
Group (excluding
Ox. or Cam.)9
All other HEIs
Other HE Providers10
School/college/ HEI combination11
Education destination
not sustained12
Not Captured in Data13 Higher Education Institutions (HEIs)
Percentage going to a sustained education destination4 Percentage not recorded in
the measure
Yorkshire and the Humber
370 Barnsley 1,020 61 12 3 1 x 4 0 46 x 6 38 1 0 9 30
380 Bradford 2,550 74 8 2 2 0 2 0 62 0 8 48 6 0 7 19
381 Calderdale 1,020 68 4 1 2 0 1 x 61 1 10 48 2 0 8 24
371 Doncaster 1,500 68 7 2 3 x 3 0 56 0 8 42 5 x 10 22
811 East Riding of Yorkshire 1,640 69 6 3 2 x 3 0 59 0 8 44 6 0 9 21
810 Kingston Upon Hull, City of 1,460 64 6 4 x 1 4 x 53 0 4 40 9 0 10 27
382 Kirklees 2,930 66 5 3 0 0 3 0 57 1 12 42 2 0 8 26
383 Leeds 3,280 66 5 3 2 2 2 0 54 1 12 39 2 0 8 26
812 North East Lincolnshire 1,130 70 17 3 x 5 6 0 44 x 5 30 8 0 9 21
813 North Lincolnshire 1,350 65 12 4 0 1 4 0 48 0 8 37 3 0 8 27
815 North Yorkshire 3,810 64 5 4 1 1 2 0 52 1 12 37 1 0 7 29
372 Rotherham 1,870 66 8 3 1 3 4 0 51 0 9 38 4 0 10 25
373 Sheffield 2,630 63 8 2 2 1 2 0 50 1 11 34 3 x 8 29
384 Wakefield 1,830 63 5 3 1 2 4 x 52 0 8 41 3 0 8 30
816 York 1,740 56 11 2 0 x 2 0 44 1 7 30 5 0 8 35
East Midlands
831 Derby 1,270 68 7 6 1 x 6 x 54 0 9 44 1 0 9 24
830 Derbyshire 3,370 68 7 4 1 0 4 0 56 1 11 42 2 0 9 23
856 Leicester 2,280 73 6 2 0 6 1 0 57 0 5 51 1 0 7 20
855 Leicestershire 3,900 70 6 4 3 0 2 0 56 1 8 45 2 0 7 23
925 Lincolnshire 4,300 65 8 2 1 x 3 0 53 1 11 40 1 0 8 27
928 Northamptonshire 4,400 66 15 1 1 x 2 0 48 0 6 41 1 0 8 26
892 Nottingham 1,970 67 9 2 2 0 2 x 54 0 10 41 3 0 7 26
891 Nottinghamshire 3,850 67 10 2 3 x 3 0 52 0 10 38 3 x 9 24
857 Rutland . . . .
West Midlands
330 Birmingham 5,590 70 6 3 1 1 1 0 58 1 12 45 0 0 8 22
331 Coventry 1,860 71 9 4 6 x 6 x 53 0 7 43 2 0 7 21
332 Dudley 2,930 67 9 3 0 x 4 0 55 1 8 45 1 x 9 24
884 Herefordshire 1,350 63 10 4 0 4 4 x 44 1 11 31 2 x 8 30
333 Sandwell 890 72 10 3 4 0 2 0 56 0 4 51 1 0 11 17
893 Shropshire 1,790 59 8 2 1 1 2 x 47 1 10 37 0 0 9 32
334 Solihull 2,230 64 7 3 1 1 2 0 52 0 9 41 2 0 8 28
860 Staffordshire 5,410 66 10 1 1 0 3 0 53 0 7 46 0 0 10 24
861 Stoke-on-Trent 1,190 66 7 2 x 6 2 0 51 0 5 45 0 0 10 23
894 Telford and Wrekin 1,200 66 11 2 x 5 3 x 49 1 11 36 0 0 10 24
335 Walsall 1,690 71 14 3 1 x 2 x 53 0 7 45 1 0 8 21
937 Warwickshire 3,840 66 10 2 1 1 3 0 51 1 10 39 2 0 8 27
336 Wolverhampton 1,320 73 9 3 4 0 3 0 58 0 6 52 x 0 10 17
Code Local Authority Number of students3 Any education destination5 Further Education College Other Further Education Provider6 School Sixth Form Sixth Form College Apprentice-ships7 Work Based Learning7 Higher Education Institution8 Oxford or Cambridge Other Russell Group (excluding Ox. or Cam.)9 All other HEIs Other HE Providers10 School/college/ HEI combination11 Education destination not sustained12 Not Captured in Data13
Higher Education Institutions (HEIs)
Percentage going to a sustained education destination4 Percentage not recorded in
the measure
East of England
822 Bedford 1,180 67 8 2 2 0 3 0 56 1 7 46 2 0 5 27
823 Central Bedfordshire 1,300 67 9 1 2 x 1 0 55 0 8 46 0 0 6 27
873 Cambridgeshire 3,350 57 8 1 1 0 2 0 47 2 9 36 0 0 7 35
881 Essex 8,300 61 6 2 1 1 2 0 51 1 6 43 0 0 7 32
919 Hertfordshire 8,360 66 7 1 2 x 1 0 56 1 11 44 0 0 6 28
821 Luton 1,200 75 6 1 0 1 2 x 67 x 5 62 x 0 5 20
926 Norfolk 4,540 54 7 3 1 1 2 0 42 0 5 36 0 0 9 37
874 Peterborough 1,300 67 18 1 3 0 1 0 46 0 7 38 0 0 6 26
882 Southend-on-Sea 1,930 51 5 2 1 0 1 x 44 1 7 36 0 0 8 41
935 Suffolk 3,700 58 7 3 1 0 3 0 47 1 6 40 0 0 9 33
883 Thurrock 980 51 4 5 0 1 2 x 41 x 2 39 0 0 7 42
London
Inner London
201 City of London . . . .
202 Camden 990 59 3 3 2 x x x 51 1 8 42 0 0 10 32
204 Hackney 550 67 4 2 1 2 1 0 59 0 3 55 1 0 11 23
205 Hammersmith and Fulham 930 73 7 2 1 0 1 x 63 1 9 52 1 0 7 21
309 Haringey 760 66 7 2 6 0 0 0 50 0 5 45 x 0 7 27
206 Islington 930 74 6 3 x x 0 x 65 0 3 61 x 0 8 18
207 Kensington and Chelsea 520 68 5 2 x x x 0 60 2 14 44 1 0 7 26
208 Lambeth 400 65 8 2 3 0 1 0 52 x 4 47 x 0 11 24
209 Lewisham 1,360 72 7 4 3 0 1 x 58 0 6 51 1 0 7 21
316 Newham 1,300 76 11 3 0 0 2 1 62 0 3 58 1 0 9 15
210 Southwark 460 67 11 3 1 x 1 x 52 1 3 48 1 0 11 22
211 Tower Hamlets 890 78 3 2 2 x 1 0 70 x 4 66 x 0 9 14
212 Wandsworth 1,400 68 3 1 2 2 1 0 60 1 6 53 1 0 7 24
213 Westminster 1,350 73 7 2 0 x 1 x 64 1 4 57 1 0 7 20
Outer London
301 Barking and Dagenham 1,000 68 6 2 3 x 2 x 57 x 3 52 3 0 7 25
302 Barnet 2,830 69 4 1 1 x 0 0 62 2 16 45 0 0 6 25
303 Bexley 1,330 73 5 4 1 1 1 x 62 1 9 53 0 0 6 21
304 Brent 1,300 76 3 1 2 0 x x 71 1 14 56 0 0 4 19
305 Bromley 2,490 64 5 5 2 x 1 0 53 1 10 41 0 0 6 30
306 Croydon 2,080 65 5 2 3 1 1 0 54 0 4 48 1 0 7 28
307 Ealing 900 77 2 2 4 0 1 x 68 1 10 56 0 0 6 18
308 Enfield 1,640 73 5 2 3 0 1 x 64 2 11 51 x 0 5 22
203 Greenwich 870 70 9 3 10 x 1 x 48 0 2 45 1 0 10 20
310 Harrow 1,800 79 14 1 1 x 1 0 63 1 9 53 0 0 5 16
311 Havering 1,830 65 5 1 x 2 1 x 58 0 6 49 3 0 6 28
312 Hillingdon 1,740 70 3 2 3 0 1 0 62 0 6 55 1 0 6 24
313 Hounslow 1,410 76 4 2 4 0 0 x 66 1 8 57 0 0 6 18
314 Kingston upon Thames 1,740 67 6 2 1 0 1 x 57 2 10 45 1 0 7 26
315 Merton 260 72 1 1 2 0 0 0 67 x 14 52 x 0 5 23
317 Redbridge 2,330 78 3 2 1 x 1 x 72 1 13 58 0 0 5 17
318 Richmond upon Thames 1,410 66 8 2 x 0 1 0 57 0 5 51 1 0 6 27
319 Sutton 1,620 74 4 3 1 0 1 0 65 3 20 43 0 0 6 20
Code Local Authority Number of students3 Any education destination5 Further Education College Other Further Education Provider6 School Sixth Form Sixth Form College Apprentice-ships7 Work Based Learning7 Higher Education Institution8 Oxford or Cambridge Other Russell Group (excluding Ox. or Cam.)9 All other HEIs Other HE Providers10 School/college/ HEI combination11 Education destination not sustained12 Not Captured in Data13
Higher Education Institutions (HEIs)
Percentage going to a sustained education destination4 Percentage not recorded in
the measure
South East
867 Bracknell Forest 460 60 9 4 1 0 1 0 46 1 6 38 0 0 5 36
846 Brighton and Hove 1,830 54 12 1 1 3 1 0 36 1 7 28 1 0 6 40
825 Buckinghamshire 3,650 65 4 3 1 0 1 x 57 2 16 38 0 0 5 31
845 East Sussex 2,830 52 12 2 1 3 2 x 35 0 5 30 1 0 8 40
850 Hampshire 11,290 57 7 3 0 3 2 0 44 1 8 34 1 0 7 36
921 Isle of Wight 660 61 6 3 5 x 3 x 47 x 6 40 0 0 10 29
886 Kent 9,340 61 7 5 2 0 1 0 48 1 7 39 0 0 7 32
887 Medway 1,840 65 6 4 3 0 2 0 52 1 5 46 x 0 8 28
826 Milton Keynes 1,250 67 8 1 1 0 1 x 56 0 6 49 0 0 7 26
931 Oxfordshire 3,880 55 7 3 2 1 1 0 43 1 7 34 0 0 7 38
851 Portsmouth 350 48 3 6 0 3 1 x 35 x 1 33 1 0 13 40
870 Reading 440 67 x 4 4 0 1 0 58 7 21 29 0 0 6 27
871 Slough 1,140 71 9 2 1 x 2 0 59 1 11 48 x 0 6 23
852 Southampton 980 60 6 3 x 15 2 x 36 0 5 31 x 0 8 33
936 Surrey 7,540 57 5 4 1 1 1 0 47 1 7 37 1 0 7 36
869 West Berkshire 1,010 65 4 4 4 x 2 0 53 1 11 40 1 0 8 27
938 West Sussex 4,480 58 13 2 2 0 2 0 41 1 6 32 3 0 7 34
868 Windsor and Maidenhead 800 61 3 6 2 x 3 x 50 1 7 42 0 0 6 32
872 Wokingham 760 65 1 5 x x 1 0 59 1 11 47 x 0 6 28
South West
800 Bath and North East Somerset 1,080 53 11 1 1 x 2 x 39 1 6 31 1 0 8 40
837 Bournemouth 490 62 4 4 3 0 1 x 51 2 13 36 0 0 5 33
801 Bristol,City of 1,880 50 10 1 1 3 1 x 34 1 6 28 0 0 8 43
908 Cornwall 3,220 58 10 3 2 0 3 0 43 0 4 37 1 0 13 29
878 Devon 3,960 53 10 2 2 x 2 0 38 1 5 32 1 0 9 38
835 Dorset 2,270 57 11 4 3 0 3 x 38 1 5 32 0 0 9 34
916 Gloucestershire 4,360 58 10 3 1 0 2 x 43 1 8 33 1 0 8 35
420 Isles of Scilly . . . .
802 North Somerset 1,210 57 14 1 2 0 2 0 40 0 8 32 0 0 8 35
879 Plymouth 1,650 65 12 2 4 0 4 0 47 0 5 39 3 0 11 24
836 Poole 1,390 55 7 4 1 0 2 x 43 1 7 36 0 0 9 36
933 Somerset 3,430 56 13 2 1 1 3 0 40 1 7 31 1 0 8 36
803 South Gloucestershire 1,480 58 11 2 3 0 3 x 42 0 6 34 1 0 9 33
866 Swindon 1,040 59 21 1 1 0 1 x 36 0 5 30 1 0 9 32
880 Torbay 1,090 58 14 2 2 0 3 x 40 2 9 29 x 0 10 31
865 Wiltshire 2,430 54 8 2 1 x 2 0 43 1 8 33 0 0 9 38
Source: National Pupil Database
1. These are students who are mostly academic age 17. There is also a small number of students of academic age 16 and 18 in the cohort. 2. This includes all level 3 qualifications ie. general or applied A levels, AS examinations or equivalent level 3 qualifications.
3. Number of students in the 2008/09 KS5 cohort.
4. Includes students who have been in a sustained education destination for the first two terms, October to March.
5. Individual lines may not add up to totals as there is a small number of students who were identified in more than one destination. 6. Other Further Education Providers includes students undertaking Further Education provision at a Higher Education Institution.
8. The Higher Education Institution (HEI) percentage includes UK Higher Education Institutions only. 9. Russell Group as at 2009 includes Higher Education Institutions shown in the Technical Note.
10. Other Higher Education Providers includes students undertaking Higher Education provision at a Further Education College.
11. School/College/HEI combination means the student fulfilled the October to March participation criteria but through more than one type of education destination. 12. 'Education destination not sustained' means the student did not have continuous participation in education destinations from October to March.
"." means that there are no pupils in the cohort for this LA.
7. All Apprenticeships and Work Based Learning are also reported in the Further Education College, Other Further Education Provider, School Sixth Form and Sixth Form College lines. Apprenticeships and Work Based Learning are identified where any qualifying learning has occurred at any time during the October to March participation period.
“x“ means the data has been suppressed as the school or college has fewer than 6 students in a particular denominator, or small numbers for the numerator (1’s and 2’s). Results are not shown because of the risk of an individual student being identified. All totals have been rounded to the nearest 10. Zeros are shown as zeros. See Technical Note for further detail.