Conservation genetics of the Java sparrow (Padda oryzivora) and an analysis of its viability
126
0
0
Full text
(2) Conservation Genetics of the Java sparrow (Padda oryzivora) and an analysis of its viability. Thesis submitted by Ir. Pramana YUDA, M.Si in December 2008. for the degree of Doctor of Philosophy in the School of Marine and Tropical Biology James Cook University.
(3) STATEMENT OF ACCESS. I, the undersigned, author of this work, understand that James Cook University will make this thesis available for use within the University Library and, via the Australian Digital Theses network, for use elsewhere. I understand that, as an unpublished work, a thesis has significant protection under the Copyright Act and; I do not wish to place any further restriction on access to this work.. _____________________. Signature. 4 December 2008 ________________. Date. 1.
(4) DECLARATION. I declare that this thesis is my own work and has not been submitted in any form for another degree or diploma at any university or other institution of tertiary education. Information derived from the published or unpublished work of others has been acknowledged in the text and a list of references is given.. _____________________. Signature. 4 December 2008 ________________. Date. 2.
(5) ELECTRONIC COPY. I, the undersigned, author of this work, declare that the electronic copy of this thesis provided to the James Cook University Library is an accurate copy of the print thesis submitted, within the limits of the technology available.. _____________________. Signature. 4 December 2008 ________________. Date. 3.
(6) ACKNOWLEDGEMENTS This project would not have been initiated without the permit from Yayasan Slamet Riyadi and Universitas Atma Jaya Yogyakarta, which allowed me to attend the PhD program in JCU. I owe thanks to Slamet Santoso, DBA (former Rector), Boy Raharjo Sidharta (former Dean of Faculty of Biology), Wibowo Nugroho Jati (Dean), and the other Faculty members. This study would not have been possible without the help and co-operation of local authorities. Particularly thanks are due to the Indonesian Ministry of Forestry, Prambanan Temples Authorities, Malang City Council, Archeology Service, and Local Government of Yogyakarta for allowing me to access the study sites. Museum Zoologicum Bogoriense (Indonesia) and Raffles Natural History Museum (Singapore) kindly provided tissue loan as raw material for the molecular analysis. Dr. Sang Putu Kaler Surata kindly provided total DNA from Bali samples. For the extensive and intensive field work, I owe thanks to my field assistants and volunteers in Indonesia: Ratna Indrawati, Sunaring Kurniandaru, Sapta Hutri, Felix Romulus, Marsono, Nuning Wardani, Janu Satya Wardani, Mifta, Rogie, and Iwan Londo and other local bird watchers in Surabaya. I sincerely thank my supervisors Dr. Brad Congdon and Prof Dr. Christopher Johnson, for their scientific support and unlimited patience. I also thank my fellow postgrad students: Anna Koetz, Sandra Abell, Carol Erwin, Darren Peck, Lyne Jones, Mark Harrington, Edd Beddwin, Richard Pauku, Hannington Tate, Intansari Nurjanah, and Rodrigo Espalana-Zanas. Matthew Gordon and Dennis Guild provided their limited time to improve the English of this report. A last proof-read was kindly undertaken by Chris Page and Philip Newey. I gratefully acknowledge the financial assistance from the Australian Development Scholarship which allowed me to attend the PhD program at James Cook University (JCU); Universitas Atma Jaya Yogyakarta (Indonesia) for providing financial assistance for my fieldwork; the expenses of the molecular analysis for this study were partially supported by JCU through IRA and Supplementary IRA, and the generosity of Lady McNeice (Chen-Kim Loke Foundation, Singapore) – who also have agreed to provide financial support for the monitoring program and conservation initiative for three years (2006-2008). This work could not have been accomplished without the full support of my family. Hence, this thesis is dedicated to them: my wife Irin, and my daughters Winih and Puspa who may read this thesis one day.. 4.
(7) ABSTRACT The problem of how to conserve small and declining populations is currently receiving considerable attention in the ecological literature, particularly through the theoretical development of conservation biology and its application to endangered species conservation. This is true despite basic information on the natural history of most endangered species being very limited; not only for species that are very rare, elusive or living in remote areas, but also for species which occupy more accessible habitat (i.e. cultivated areas), such as the Java sparrow (Padda oryzivora). In the research outlined in this thesis, field studies and molecular analyses were combined to establish the current population status, level of continued threat, contemporary connectivity among remnant populations and the genetic diversity of the endangered Java sparrow. Field work included intensive censuses at 6 sites across Central and East Java during the 2004 and 2005 breeding seasons. To gain information about the current scale of trading and trafficking of Java sparrows, the numbers of birds for sale were surveyed at 7 bird markets, mostly situated close to the bird census sites. Further interviews with bird trappers established the level of trapping and distribution of trapping sites. DNA was extracted from both fresh whole blood (field samples) and tissue samples (museum specimens) and analysed using two different molecular marker systems – part one and two of the mtDNA control region and 5 independent nuclear microsatellite loci. MtDNA sequence data were used to infer phylogeography and historical demography of the Java sparrow, while, multi-locus microsatellite genotyping was used to assess contemporary connectivity and levels of genetic variation. In order to predict the future fate of the Java sparrow, a PVA and sensitivity analysis was also undertaken. Stochastic modelling was carried out using the program VORTEX. The results of this study highlight that remnant populations of Java sparrow in Central and East Java are currently small and highly fragmented. Based on roost counts at 6 sites, population estimates range from 5.8 (± 0.2 SE) to 125.2 (± 1.7 SE). The total estimated population for Central and East Java did not exceed 1000. 5.
(8) individuals. If other regions of Indonesia within the species’ natural range have similar abundances, then the total Java sparrow population in Indonesia is likely to be at the lower end of the range of 2500 – 10,000 individuals that is currently used to classify the species as ‘Vulnerable’. The major threat from trapping and trading is still ongoing at a high level, with an average 59.3 % of the total population estimates being trapped during the study period. This threat is particularly severe in central Java, where market demands were mainly supplied by local wild caught birds. In contrast, in the east Java bird markets, introduced and captive bred birds were substituted to satisfy high market demand. These findings emphasize the potential abundance of Java sparrows that may occur in currently unstudied introduced populations on outer islands (e.g. Kalimantan), and the important role that introduced and captive bred birds currently have in mitigating further declines. They also highlight the potential usefulness of these introduced populations as part of future conservation schemes for the Java sparrow. Analysis of mtDNA sequence data was used to infer the effects of historic habitat changes on population demography and genetic diversity in the Java sparrow. Despite an expectation that this species would have increased habitat availability during glacial maxima, analysis based on standard mtDNA mutation rates revealed that major climatic shifts have caused bottlenecking in Java sparrows similar to those observed in temperate species impacted by expanding ice sheets. Alternatively, using more recently derived and contrasting mtDNA mutation rates suggests the Java sparrow was bottlenecked during the expansion of rainforest in the early Holocene, and likely expanded during deforestation associated with the arrival of cultivation to Java. If correct, this finding adds to an increasing number of studies highlighting the impact of human colonization on the distribution and abundance of endemic species. Microsatellite genotyping demonstrated that genetic variation in remnant Java sparrow populations was low, in the middle range of genetic variation observed for other endangered species. Levels of diversity among contemporary populations did not differ from historic samples. In addition, significant structuring was found among remnant but not historic populations, implying recent fragmentation and limited current inter-population movement. Therefore, it is likely that while recent. 6.
(9) population declines have, as yet, had limited impact on genetic diversity, they have had a significant impact on levels of interpopulation gene flow. Stochastic PVA modelling suggested that, under a best case scenario, Java sparrows would be able to recover. Sensitivity analysis revealed that the PVA models were most sensitive to mortality and fecundity schedules. However, the results highlighted that further field studies of these parameters are necessary to gain a more realistic assessment of the potential fate of the Java sparrow over both the short and longer term. PVA also suggested that if the current level of trapping continues Java sparrow will become extinct within a very short period of time. Given that terminating trapping seems an unlikely short-term management option, these findings highlight the immediate need to formulate a trapping/harvesting strategy that minimizes the risk of extinction. The implications of the results of this research are as follows: 1. It is proposed that the conservation status of Java sparrow to be transferred from Vulnerable to Endangered (A2a,b,d; E). This research also provides a more robust, high quality data set that can be used for conservation status assessment. 2. Trapping remains the main threatening process and must be reduced before other conservation measures can be effective. The use of captive bred and/or introduced birds should be encouraged to meet market demands. Further population studies on introduced populations (e.g. in Kalimantan) are a necessity to develop the sustainable use of these resources. 3. For management purposes the Java sparrow can be considered as a single Management Unit. However, to develop a sound conservation strategy for this species, it is important to take into account the concept of “ecological exchangeability”. For this purpose we need studies of behaviour, life history, and morphology relative to environment. Such studies will allow more meaningful assessment of biologically relevant differentiation among the remnant populations of the Java sparrow. 4. There is also a need for further research on demographic parameters and breeding biology to gain more realistic predictions of population viability. 5. There is a critical short-term need to formulate a trapping/harvesting strategy to minimize the extinction risk. Working thresholds need to be established as a. 7.
(10) short-term management priority and as a basis for more effective and sustainable management strategies over the longer term.. 8.
(11) TABLE OF CONTENTS ACKNOWLEDGEMENTS ........................................................................................................ 4 ABSTRACT ............................................................................................................................. 5 TABLE OF CONTENTS ............................................................................................................ 9 LIST OF TABLES .................................................................................................................... 12 LIST OF FIGURES .................................................................................................................. 14 CHAPTER 1. INTRODUCTION .............................................................................................. 15 1.1. Background to the study........................................................................................15 1.2. Aims ..........................................................................................................................16 1.3. Overview of the study.............................................................................................17 CHAPTER 2. CURRENT POPULATION AND DISTRIBUTION .................................................. 18 2.1. Introduction .............................................................................................................18 2.2. Aims ..........................................................................................................................19 2.3. Methods ...................................................................................................................19 2.3.1. Preliminary surveys .............................................................................................19 2.3.2. Population estimate ..........................................................................................19 2.3.3. Breeding status, phenology and nest sites .....................................................20 2.3.4. Sex determination..............................................................................................21 2.4. Results.......................................................................................................................22 2.4.1. Preliminary surveys .............................................................................................22 2.4.2. Present study.......................................................................................................24 2.5. Discussion .................................................................................................................31 2.5.1. Comparison to pre-2004 surveys ......................................................................31 2.5.2. Population estimate ..........................................................................................33 CHAPTER 3. INTRASPECIFIC PHYLOGEOGRAPHY ............................................................. 35 3.1. Introduction .............................................................................................................35 3.2. Aims ..........................................................................................................................36 3.3. Methods ...................................................................................................................36 3.3.1. Population sampled ..........................................................................................36 3.3.2. DNA extraction...................................................................................................37 3.3.3. Polymerase chain reaction and sequencing.................................................38 3.3.4. Statistical analysis...............................................................................................38 3.4. Results.......................................................................................................................42 3.4.1. Mitochondrial DNA variation ............................................................................42 3.4.2. Historical demography......................................................................................45 3.4.3. Time of expansion ..............................................................................................46 3.4.4. Genetic diversity and population structure....................................................47 3.5. Discussion .................................................................................................................49. 9.
(12) 3.5.1. Molecular diversity .............................................................................................49 3.5.2. Historical demography......................................................................................50 3.5.3. Implication ..........................................................................................................52 CHAPTER 4. MICROSATELLITE VARIATION AND POPULATION STRUCTURE....................... 53 4.1. Introduction .............................................................................................................53 4.2 Aims ...........................................................................................................................53 4.3. Methods ...................................................................................................................54 4.3.1. Sampling .............................................................................................................54 4.3.2. Microsatellite typing ..........................................................................................54 4.4. Results.......................................................................................................................58 4.4.1. Genetic diversity ................................................................................................58 4.4.2. Hardy-Wienberg and linkage equilibrium tests ..............................................60 4.4.3. Inbreeding coefficient ......................................................................................61 4.4.4. Population differentiation .................................................................................62 4.4.5. Isolation by distance..........................................................................................62 4.4.6. Population bottleneck.......................................................................................62 4.4.7. Migration assessment ........................................................................................63 4.5. Discussion .................................................................................................................64 4.5.1. Genetic diversity ................................................................................................64 4.5.2. Genetic structure ...............................................................................................65 4.5.3. Migration .............................................................................................................66 CHAPTER 5. THREATS ASSESSMENT .................................................................................... 68 5.1. Introduction .............................................................................................................68 5.2. Aims ..........................................................................................................................69 5.3. Methods ...................................................................................................................69 5.3.1. Market survey .....................................................................................................69 5.3.2. Avian malaria assay ..........................................................................................70 5.4. Results.......................................................................................................................72 5.4.1. Trapping ..............................................................................................................72 5.4.2. Market survey .....................................................................................................73 5.4.2. Detection of avian malaria ..............................................................................75 5.5. Discussion .................................................................................................................76 5.5.1. Trapping and trading ........................................................................................76 5.5.2. High prevalence of avian malaria infection ..................................................78 5.5.3. Other threats.......................................................................................................79 5.5.4. Implications.........................................................................................................80 CHAPTER 6. POPULATION VIABILITY ANALYSIS................................................................. 82 6.1. Introduction .............................................................................................................82 6.2. Aims ..........................................................................................................................83 6.3. Methods ...................................................................................................................83 6.3.1. Data.....................................................................................................................84 6.3.2. Modelling scenario ............................................................................................88 6.4. Results.......................................................................................................................90 6.4.1. Sensitivity analysis...............................................................................................90 6.4.2. Effect of inbreeding depression .......................................................................92 6.4.3. Effect of trapping...............................................................................................93. 10.
(13) 6.5. Discussion .................................................................................................................96 CHAPTER 7. GENERAL DISCUSSION ................................................................................. 100 7.1. Current distribution and abundance ..................................................................100 7.2. Population fragmentation and genetic differentiation ....................................101 7.3. Limited genetic variation .....................................................................................102 7.4. Current and Potential Threats ..............................................................................103 7.5. Population viability................................................................................................104 7.6. Conservation Status ..............................................................................................105 7.7. Conclusion .............................................................................................................106 REFERENCES...................................................................................................................... 109 APPENDICES ..................................................................................................................... 118. 11.
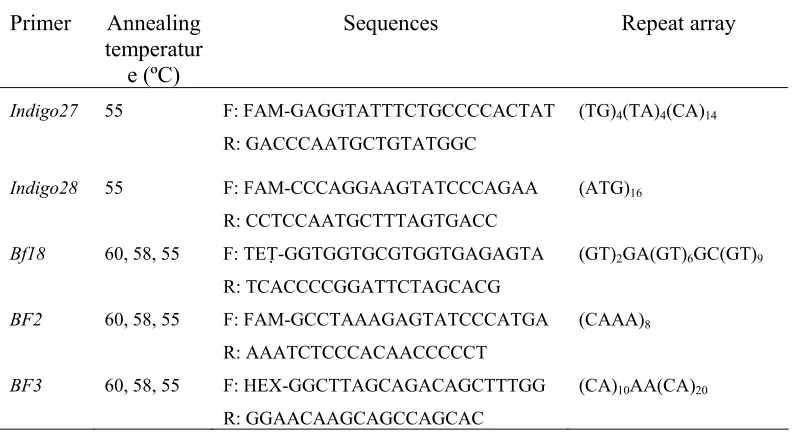
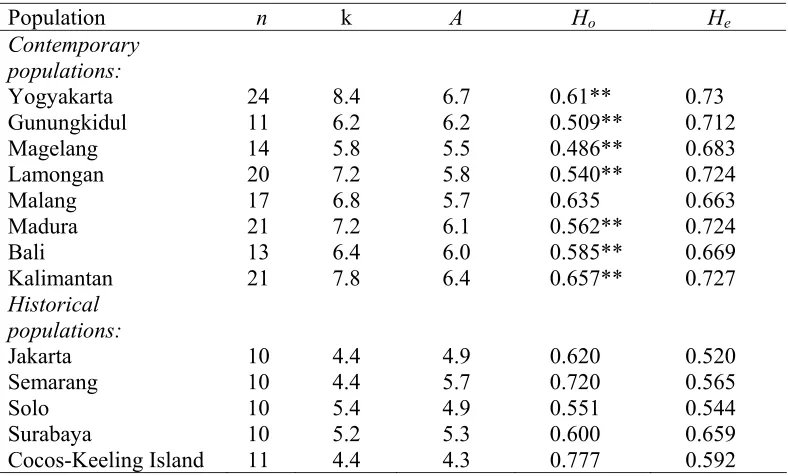
(14) LIST OF TABLES Table 1. Breeding time of the Java sparrow in the study sites ...................................... 31 Table 2.Variability and geographical distribution of DNA control region (Part 1 and 2) sequences of contemporary Java sparrow populations .............................................. 43 Table 3. Neutrality and other statistical tests for detecting historical demography using mtDNA control region sequences ......................................................................... 45 Table 4. The estimated divergence time from mtDNA control region sequences ...... 47 Table 5. Genetic variation of contemporary Java sparrow populations revealed from mtDNA control region sequences ................................................................................... 47 Table 6. Genetic variation of contemporary and historical Java sparrow populations on Java Island revealed from mtDNA control region sequences ................................ 48 Table 7. Analysis of Molecular Variance results for the Java sparrow for mtDNA....... 49 Table 8. Pairwise Fst (below diagonal) and P (above diagonal) values...................... 49 Table 9. The primers used to amplify the Java sparrow................................................. 55 Table 10. Microsatellite diversity indices of the Java sparrow ...................................... 59 Table 11. P values of linkage equilibrium test between loci across populations ........ 60 Table 12. FIS values for each locus by population.......................................................... 61 Table 13. Pair-wise values of FST among the Java sparrow populations (below diagonal), and values (above diagonal) between all pairs of populations (contemporary: 1-8; historical: 9-13; bold : not significantly different, p ≥ 0.05) ......... 64 Table 14. Departures from mutation-drift equilibrium in the Java sparrow populations (The P=values are for Wilcoxon sign-rank (one-tailed) tests for the heterozygote excess (He>Heq), and are shown for expected distribution of heterozygosity estimated under IAM, TPM and SMM............................................................................... 63 Table 15. Migration rates (m) among Java sparrow populations. Standard deviations for all distributions were < 0.05. ........................................................................................ 64 Table 16. The sites of the bird markets survey (N = the number of shops providing the Java sparrow for sale) ...................................................................................................... 70 Table 17. Number of birds caught in 2004 as specified by bird trappers..................... 72 Table 18. The numbers of the Java sparrow for sale in the markets and their provenance ....................................................................................................................... 73 Table 19. Haplotypes of avian malaria found in the blood of the Java sparrow ........ 76. 12.
(15) Table 20. The probability of dispersal (%) among the populations from source populations (rows) to recipient populations (columns)................................................. 87 Table 21. Input data for sensitivity analysis of this study ................................................ 89 Table 22. The scenarios for the sensitivity analysis for the Java sparrow ..................... 90 Table 23. Sensitivity analysis – effects of changes in input parameters on model outcomes ........................................................................................................................... 91 Table 24. The impact of inbreeding depression on the probability of extinction of the remnant populations of Java sparrow under six different scenarios............................ 94 Table.25. Sensitivity analysis on of the level of trapping................................................ 96. 13.
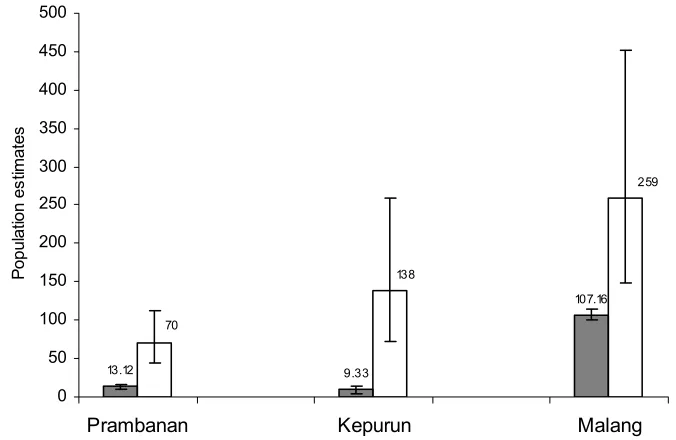
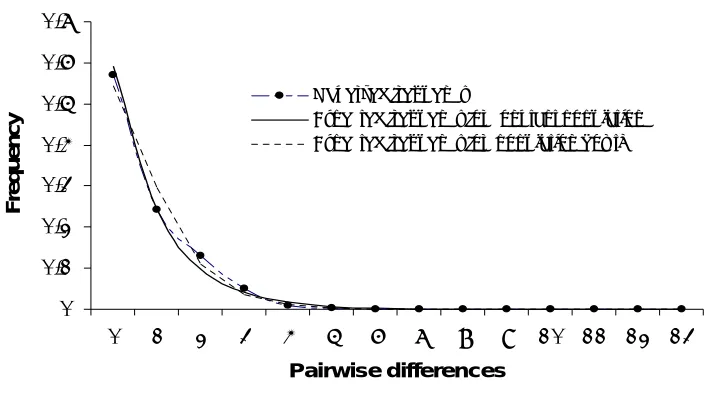
(16) LIST OF FIGURES Figure 1. The distribution of study sites: 1. Magelang, 2. Kepurun, 3. Prambanan, 4. Purosani, 5. Gua Maria Tritis, 6. Gua Mandung, 7. Gupakwarak,, 8, Jhotak, 9. Sugio, Lumajang, 10. Ujung Pangkah, 11. Dadapan, Babat, and 12. Malang.... 23 Figure 2. Population estimates of at each study sites based on roosting counts. (Black bar: 2004 counts; white bar: 2005 counts) .................................................. 25 Figure 3. The estimated numbers of the Java sparrow obtained using two different methods: direct roosting counts (grey bar; ± 2SE) and mark-recapture (white bar; ± CL 95%) ........................................................................................................... 25 Figure 4. Sample sites for mtDNA analysis (sample sizes shown in brackets) Historical populations: 1. Jakarta (8), 2. Semarang (7), 3. Solo (7), 4. Surabaya (7). Contemporary populations: 5. Magelang (12), 6. Yogyakarta (21), 7. Gunungkidul (11), 8. Gresik (18), 9. Malang (10), 10. Madura (21), 11. Bali (11) 41 Figure 5. Parsimony network for mtDNA control region Java sparrow sequences (a) contemporary populations only; (b) historical (black) and contemporary (white) population combined. ............................................................................................. 44 Figure 6. Mismatch distribution for Java sparrow populations in its natural range: Java Madura, and Bali. Black dots indicate observed values and white dots expected values under a sudden expansion growth model. .............................. 46 Figure 7. Correlation between inbreeding coefficient and population size of four Java sparrow populations ................................................................................................ 61 Figure 8. The provenance of the wild birds offered in the bird markets: a. overall data, b. East Java, and c. central Java. Grey area is imported birds, and white area is local birds.................................................................................................................. 74 Figure 9. Map of the market survey and the trafficking of the Java sparrow .............. 75 Figure 10. The effect of the level of mortality rates (1) and fecundity (2) on the population growth (±SE) of the Java sparrow population..................................... 91 Figure 11. The effect of dispersion on the population growth (±SE) of local populations and metapopulation ................................................................................................ 92 Figure 12. The impact of inbreeding depression (LE=12.3) on the population growth (±SE) of the population model under the baseline scenario on the remnant populations of Java sparrow. Grey bar = without inbreeding depression (LE=0), white bar = with inbreeding depression (LE=12.3) ................................................. 93 Figure 13. The impact of trapping on the population growth (±SE) of Java sparrow .. 95 Figure 14. The impact of trapping on probability of extinction within 100 years......... 95. 14.
(17) CHAPTER 1. INTRODUCTION 1.1. Background to the study The problem of how to conserve small and declining populations is currently receiving considerable attention in the ecological literature, particularly through the theoretical development of conservation biology and its application to endangered species conservation. However, undermining these developments is the fact that even basic information on the biology-ecology of most endangered species is extremely limited. For example, reviewing BirdLife International’s database (2006) revealed that the quality of data currently being used to classify most endangered bird species is poor. This observation is valid not only for endangered species that are rare, elusive, or living in remote areas, but also for species which occur in more accessible habitat (i.e. cultivated areas), such as the Java sparrow (Padda oryzivora). The Java sparrow is a bird species endemic to the Indonesian islands of Java and Bali (MacKinnon and Phillipps 1993; Balen 1997), that has also been introduced widely from South-east Asia to other areas, such as the Christmas, Cocos-Keeling and Hawaiian Islands (Long 1981; Islam 1997). The species was formerly common in cultivated areas in Java and Bali, but over the last three decades populations have declined dramatically and become highly fragmented because of trapping for aviculture (MacKinnon and Phillipps 1993; Balen 1997). As a consequence, the Java sparrow has been listed as Vulnerable (A2b,d; A3b,d; C1) within its natural range (IUCN 2006). This assessment is based on population size and trend criteria derived from poor quality data detailed in BirdLife International (2006). More recent studies have been undertaken to assess whether population declines are continuing. Unfortunately, these studies applied rapid assessment methods that did not include replicate counts at each site (Laudisensius et al. 2000; Muchtar and Nurwatha 2001). Therefore, despite the baseline data obtained, they provide no associated estimate of error and the current demographic trends for Java sparrow populations throughout Java and Bali are unknown. As well as the demographic problems associated with small populations sizes faced by a species such as the Java sparrow, very little is known about the genetic. 15.
(18) consequences of population declines and fragmentation at this scale. Theoretically, population declines such as this increase extinction risk due to both the loss of genetic variation and associated increases in the level of inbreeding. For this reason, a common goal of many endangered species conservation programs is the maintenance of genetic variation. However, such goals are often set without a clear understanding of either the genetic/evolutionary history, or future potential trajectory of an endangered species. Understanding or assessing how to best manage the genetic resources of a species both within and among small fragmented populations, while simultaneously maintaining demographic viability, is a complex task that requires the integration of a number of quite distinct but complementary data sets. Data are required on current demography and trends, contemporary connectivity as well as historical demographics, threats, behaviour, morphology, physiology, and biotic interaction. At present few comprehensive empirical data sets exist that can be used to develop and test either species-specific management options or general models of integrated management.. 1.2. Aims Based on the background above, the aims of this study were to: 1. assess the current population status, 2. assess the level of threat, 3. assess the historical demographic processes, 4. assess the connectivity among the remnants populations and the genetic diversity, 5. analyse the population viability, for Java sparrow throughout its natural range in Java and Bali Work undertaken in this project will allow the development of a comprehensive integrated management program to be tested in ongoing research, as well as to develop general models of how data sets can be integrated to develop such management options.. 16.
(19) 1.3. Overview of the study Given the limited reliability of existing data on population sizes and demographic trends for the Java sparrow, I first conducted an extensive survey followed by an intensive census to assess the current distribution and abundance of remnant populations of Java sparrow in Central and East Java (Chapter 2). The following chapters (Chapter 3 and 4) then build up an appropriate research method for assessing genetic variation and population genetic structuring of the Java sparrow. Chapter 3 highlights the use of mitochondrial DNA (mtDNA) data to reveal historical demographic and evolutionary processes. Chapter 4 describes the use of multi-loci microsatellite genotyping to establish the effects of population declines and fragmentation on genetic variation and recent connectivity among the remnant populations. Chapter 5 reports the main finding on current threats to the Java sparrow, particularly the threat it faces from the aviculture and wild-bird trade. This chapter also describes the potential threat from avian malaria, which was assayed using PCR based analysis. Based on these findings and other published data, population modelling was then used to simulate future demography and to assess the population viability of the Java sparrow (Chapter 6). Chapter 7 integrates the findings from previous chapters and provides further detailed discussion of management alternatives along with implications for the conservation of the Java sparrow. Future research directions and needs are also discussed.. 17.
(20) CHAPTER 2. CURRENT POPULATION AND DISTRIBUTION. 2.1. Introduction The historical data available on the Java sparrow within its native range is largely limited to distribution and habitat records (Appendix 1). In the early 1990s, van Balen (1997) comprehensively assessed existing locality records for the Java sparrow in Java and Bali. BirdLife International (2001) extended this assessment and further included the species’ non-native range in Indonesia. To supplement these data more in-depth studies have been done since 1998: YPAL (Yayasan Pribumi Alam Lestari) surveyed the Java sparrow distribution in Java and Bali (Muchtar and Nurwatha 2001), and at a finer scale field surveys were carried out in Magelang (Anonymous 2003), Yogyakarta (Laudisensius et al. 2000) and Bali (Surata 2000). As expected these studies found that the remaining populations were small and highly fragmented (Appendix 1 & 2). However, most of these studies applied rapid assessment methods with no repeated counts at each site. Therefore, despite the baseline data obtained, they provide no associated estimate of error. I undertook preliminary surveys in mid 2003 that aimed to locate populations for use in further detailed ecological and demographic studies. These surveys found that most previously identified populations no longer persisted at sites where they were originally observed (pers. obs. 2003; Nurwatha, pers. comm. 2003; Surata, pers. comm. 2003). These findings severely undermine the potential validity of published status and distributional data for this species and strongly suggest that further rapid decline may have occurred. This, combined with the fact that the Java sparrow continues to be in high demand on the Indonesian bird market, one of the main causes of their original decline, means that updating our knowledge of remnant populations using reliable methods is an essential and important conservation priority for this species.. 18.
(21) 2.2. Aims This chapter reports the findings of detailed population surveys in Central and East Java during the 2004 and 2005 breeding seasons. The population surveys aim to establish the current distribution and abundance of the remnant Java sparrow populations, in particular in Central and East Java. Additional life history information was also obtained for each population. These data included breeding status, phenology and nesting site locations/characteristics.. 2.3. Methods 2.3.1. Preliminary surveys During May – July 2003, preliminary (presence/absence) surveys were undertaken at all roosting or nesting sites in Central and East Java where the Java sparrow had previously been recorded. At each site surveys for the presence of Java sparrow were done once or twice per day, in the morning (6:00 - 9:00) and/or afternoon (15:00 – 18:00). Surveys were repeated two to three times at each site. In addition, interviews with local people, temples guard officers and local birdwatchers were conducted to obtain secondary data on the persistence of the Java sparrow at each location during the previous one to two years. Moreover, bird market surveys in Yogyakarta, Surabaya and Malang, and further interviews with bird trappers were used to identify other potential remnant populations that had not been recorded previously. Nine potential new sites were identified from these sources and included in the presence/absence surveys. Following these initial surveys, detailed population censuses were carried out at all sites where the presence of the Java sparrow was confirmed. In addition, data on breeding status, phenology and nest site selection were obtained where possible.. 2.3.2. Population estimate In order to estimate remnant population sizes, detailed censuses were carried out during the 2004 and 2005 breeding seasons. Where possible two independent census methods were applied per location: direct counts at staging sites, and mark-. 19.
(22) recapture methods. In general, direct counts were carried out as each population of birds left their staging site and moved to roosting sites at approximately the time of adzan Maghrib (the Moslem call to evening praying), within a half hour of dusk each day. Census methodology varied slightly between locations. These variations are outlined in the results section. Mark-recapture methods were impracticable at some sites and so this method was only applied in Kepurun, Prambanan and Malang. The capture techniques used were mist-netting (Malang) and double-clap trapping (Prambanan and Kepurun). The mist-net was set up using 5 m metal poles on the roof top of the third floor of a Malang regency office (ca. 20 m) across the route of birds returning to a roosting tree (Hymenaea courbaril, ca. 27 m height). The double-clap trap was set up on the ground around a paddy area where the birds were expected to land for feeding. Live decoy birds were used to attract flocks into the trap area. Prior to release, all trapped birds were banded for individual recognition using combinations of colour rings. Population estimates from the direct counts were derived using descriptive statistics (mean and standard error from replicated counts). To estimate the relative abundance at each site, independent population estimates were obtained during the breeding (December – August) and post-breeding (September – November) Seasons. The length of the breeding season was based on data we obtained from Java sparrow populations in Pambanan and Malang during this study, and differs slightly from previous reports (review in Balen 1997; BirdLifeInternational 2001). Since the recapture rate was very low, with no recaptures occurring in Malang and Kepurun, mark-recapture population estimates were made using the resight method with the EcoMath program (Krebs 1999). Assumptions associated with this methodology are that each population is closed, that there is equal probability of capture among marked and unmarked individuals and that sampling is random (Bibby et al. 2000).. 2.3.3. Breeding status, phenology and nest sites Nest site characteristics were documented for all known nests. Unfortunately, detailed data on reproductive output per nest could not be obtained, as most nests were inaccessible. Therefore, breeding cycle assessments for each nest were carried out by linking behavioural observations of adults and juveniles to breeding cycles in. 20.
(23) captive birds. The behavioural clues used related to aspects of nest-building and courtship activity, nest occupancy periods, and the occurrence of young birds. These were compared to the published breeding cycle data as follows: incubation period 13-14 days, nestling period ~21 days (Restall 1996). Fledglings differ from adults in having a pale dull brown and grey plumage, and dark beak for the first 4-5 months after fledging (Restall 1996; Salem 2005).. 2.3.4. Sex determination Java sparrow sexes have monomorphic plumage, so it is hard to determine an individual’s sex without having the bird in hand. However, males usually have more massive bills than females. In the breeding period, male and female birds are also slightly different. Male birds have brighter red eyelid colour and the bases of their beaks are more swollen. Molecular sexing was applied to determine the sex of the chicks (see below). Molecular sexing followed the protocol developed by Fridolfsson and Ellegren (1999). This method makes use of the presence and absence of a sexdependent DNA fragment, e.g. W chromosome in birds. PCR produces two different size products in females and one in males. 25 ul PCR reactions consisted of 10-20 ng of DNA; 10x PCR Buffer (200mM Tris-HCl (pH 8.4); 500mM KCl); 2.0mM MgCl2; 5 pmol of each primer; 0.15 mM of each dATP, dTTP, dCTTP, dGTP and 1 unit of Tag polymerase (Life Technology). PCRs were run using the following cycle conditions: 94C for 90 sec; 30 cycles for 45s at 50C, 30s at 72C, 30s at 94C; and 60s 50C,. and. 5. m. at. 72C.. The. primers. used. were. 2550F. (5’-. GTTACTGATTCGTCTACGAGA – 3’) and 2718R (5’- ATTGAAATGATCCAGT GCTTG -3’). The sex ratios in each Java sparrow population were determined using both the adult and fledgling birds that were caught during trapping. Chi-square goodness of fit (X2) was used to test whether the observed sex ratios deviated from the expected sex ratio of 1: 1.. 21.
(24) 2.4. Results 2.4.1. Preliminary surveys During the preliminary (presence/absence) surveys across Central and East Java in 2003, Prambanan (Yogyakarta) and Malang (site 61 & 75, Appendix 1) were confirmed as the only previously identified nesting locations where birds were still regularly observed. Bird market surveys in Yogyakarta/Gunungkidul, Surabaya and Malang, and further interviews with bird trappers indicated other potential remnant populations existed that had not been recorded previously. Nine potential new sites were identified from these sources; however at only four of these sites was the presence of Java sparrow confirmed (Figure 1).. 22.
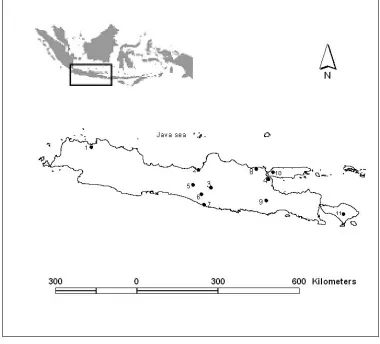
(25) Figure 1. The distribution of study sites: 1. Magelang, 2. Kepurun, 3. Prambanan, 4. Purosani, 5. Gua Maria Tritis, 6. Gua Mandung, 7. Gupakwarak,, 8, Jhotak, 9. Sugio, Lumajang, 10. Ujung Pangkah, 11. Dadapan, Babat, and 12. Malang. 23.
(26) 2.4.2. Present study 2.4.2.1. Population estimates A total of nine extant populations were identified. These were located in village/rice field areas (Magelang, Kepurun), a temple complex/rice field (Prambanan), woodlands on limestone hills (Gunungkidul: three populations, Gresik), and in an urban area (Malang, Purosani), all at between 200 - 265 m a.s.l. Population estimates at each site based on roost counts ranged between 4.5 (± 1.21) and 126.3 (± 3.16) individuals (Figure 2), while those based on mark-recapture data ranged between 70 (44 - 112) and 259 (148 – 452). Where estimates were obtained using both methods, roost counts provided consistently smaller numbers per site (Figure 3), on average 0.22 of the other count result. The total maximum population estimate of Java sparrows across all sampling sites in Central and East Java did not exceed 1000 birds. Details for estimates at each site are described below (Section 2.4.2.2).. 24.
(27) 140. 120. Mean numbers (+/- 1SE). 100. 80. 60. 40. 20. 0. Prambanan. Purosani. Kepurun. Magelang. Jothak. Malang. Figure 2. Population estimates of at each study sites based on roosting counts. (Black bar: 2004 counts; white bar: 2005 counts). 500 450. Population estimates. 400 350 300. 259. 250 200 138. 150. 107.16. 100 50. 70. 13.12. 9.33. 0. Prambanan. Kepurun. Malang. Figure 3. The estimated numbers of the Java sparrow obtained using two different methods: direct roosting counts (grey bar; ± 2SE) and mark-recapture (white bar; ± CL 95%). 25.
(28) 2.4.2.2. Site-specific accounts a. Prambanan The study area is situated in the largest temple compound dedicated to Shiva in Indonesia. At the site there are three main temples: Siwa, Brahma, and Wisnu, and three smaller temples, Nandi, Angsa and Garuda. The height of these stone temples ranges between 24.4 m (Angsa) and 46.5 m (Siwa). The Java sparrow used the temples as nesting and roosting sites, particularly Siwa and Brahma (Aji 1999; Laudisensius et al. 2000). During this study restoration was being undertaken at Siwa which caused birds to move to, and utilise, other temples. Direct counts were implemented monthly in November and December 2004 or two-weekly from May to September 2004 and from January to December 2005. The counts were made when the birds moved from a Casuarina (Casuarina junghuhniana) ‘staging roost’ tree to a kapok (Ceiba pentandra) roost tree, ca. 100m south-east of the nesting sites in the temples. Assuming that all the Java sparrow nesting in the temples were using the kapok tree as their night roost, the number of nesting birds observed suggested that there could be birds nesting in other sites outside the temples complex that also used the roost tree. The average number of birds estimated from direct counts in the Prambanan temples complex during each breeding season were 13.12 (± 1.23, n =8 ) in 2004 and 25.4 (± 2.68, n = 8 ) in 2005. Twenty birds were marked and released from April to August 2004. Only one marked bird was re-caught. However, during subsequent observations from August to December 2004 in the temple complex, nine marked and 156 unmarked birds were sighted. The frequency of resighting of specific marked individuals ranged from 1 to 8. Using the resight estimation formula (Krebs 1999), the total Java sparrow population within the temple complex was estimated at 70, with 95% confidence limits (CL) from 44 to 112. b. Purosani Purosani is located at the centre of Yogyakarta city. The Java sparrow was encountered under the roof of the seventh floor of the hotel Melia Purosani. The first encounter was reported by a local birdwatcher (Lim, pers comm.) in December 2004, when he observed 6 birds. Since then, I conducted five counts during March - April 2005 and a further 5 counts during November - December 2005. The total average. 26.
(29) number of Java sparrow encountered was 11.66 ± 1.11 (n=6). I also recorded two juvenile birds in April 2005. The Java sparrow used a gap beneath the eaves of the hotel for nesting. There are some Casuarina trees (Cassuarina junghuniana) growing around 5 meters from the nest sites. The trees are a suspected ‘staging roost’ used by birds en route to other roost sites. From this “staging roost’ birds disperse to elsewhere across the city. To date, I have not located the night roosting sites of this population. c. Kepurun Kepurun is a typical village in a rural area of Java, located in the southeastern foothills of Mt Merapi. At this site the Java sparrow were observed in rice fields with Albizzia falcataria trees growing on dikes (galengan) surrounding the fields. Birds appeared to use these trees as both roosting and nesting sites. However, only one nesting tree could be clearly identified at the site. In this tree birds were observed nesting in old woodpecker holes. A census was conducted using the encounter rate method. I walked along the dikes and counted all birds encountered during 2 hours in the morning (7.00- 9.00) or in the afternoon (15.30-17.30). Censuses were undertaken in July, November and December 2004, and in February and March 2005. During 2004, maximum estimates of 15 birds with an average of 9.3 ± 2.84 (95%) per survey were obtained. In 2005 only six birds were encountered during one survey. Thirty birds were marked and released from July to September 2004. Only three birds were resighted since then. Using a resight estimation model (Krebs 1999), the total Java sparrow population estimate for this site was 138 (73 – 259; CL=95%). d. Magelang The roost and nest sites of the Java sparrow at this location were situated at the ‘Istiqomah’ mosque in the Panca Arga military residential complex. The mosque is a typical small Indonesian mosque, a pyramidal-roof building with a dome on its top. The total height of the mosque is around 15 m. The plants growing in the mosque’s yard are Pine (Pinus merkusii), and Turi (Sesbania grandiflora). Paddy fields are found near the residential complex.. 27.
(30) At this site direct counts were carried out at two-week intervals from July to December 2004, and monthly from January to December 2005. The total population during the 2004 breeding season averaged 17.25±1.25 (n = 4), while during the 2005 breeding season it averaged 6.58±0.65 (n = 12). During this study two active nests that were established on plastic lining inside the roof of the mosque were found on August 2004. The first nest contained three new hatchlings and the other four hatchlings and three eggs. Nests and unhatched eggs of Eurasian tree sparrow were also found in the ceiling. Also, in the rafters of the ceiling were found two dead Java sparrow chicks and eggshell. In September 2005 the mosque officers “harvested” 22 chicks from four different nests. Fortunately, in December 2005, they agreed to release the birds following blood sampling and ringing by us. However, up until February 2006, none of the released birds were resighted in the mosques. e. Gunungkidul karst This area is the western part (60%) of the Gunung Sewu karst region. It covers more than 1300 km2 and comprises over 10,000 cone hills (Haryono and Day 2004). Since the 1970s this area has been known as the principal region supplying the Java sparrow to the bird markets in Yogyakarta and surroundings (pers. obs.). The use of Gelatik (= Java sparrow) in the names of two sites in Gunungkidul, namely Pulau Gelatik (Gelatik Island) and Gua Gelatik (Gelatik Cave), likely highlights the previous abundance of the birds in this region. However, during a previous study in 1999, only a small number of birds were found across eight localities in this karst area (Appendix 2) (Laudisensius et al. 2000). In 2003, a second survey by us failed to confirm the presence of the Java sparrow at these locations. However, four new sites were identified: Jothak, Gupak Warak, Gua Maria Tritis and Gua Mandung. During the 2003 survey I encountered 20, 13, 5 and 7 Java sparrow at these locations respectively. Unfortunately, during the follow-up intensive census period from September 2004 to February 2005, Jothak was the only site where the Java sparrow was consistently encountered. I obtained further bird sightings only once at Gua Maria, 3 birds in September; twice at Gua Mandung, 7 and 3 birds in September and February respectively, and not at all at Gupak Warak. Since the distance between Gua Maria and Gua Mandung is only 1.7 km, I considered the Java sparrow present in these two sites as one population. 28.
(31) Using roost counts the breeding population of the Java sparrow at Jhotak was estimated at 25.66 (± 4.25, n= 3) with a maximum of 34 birds. The post-breeding population was estimated at 31.5 (± 2.5, n= 2) with a maximum of 34 birds. At this site the birds used crevices in the wall of a sink-hole cave (luweng) as nesting sites and occupied Lantana camara bushes at the edge of the top of the cave entrance as a ‘staging’ roosting site. To date, I have not located the night roosting site(s) of this population. f. Malang This site is the Malang county office complex, which consists of seven 2-4 storey buildings. Adult and juvenile birds were observed to roost on buildings and/or in tanjung (Mimusops elengi) and flamboyan (Delonix regia) trees in this area. These trees appeared to serve as ‘staging’ trees to the night roosting in a Hymenaea courbari tree. Direct counts were carried out as birds moved between the staging and night roosts at 17:20 to 17:45 each night during the adzan Maghrib (the Moslem call to evening prayer). Similar counts were performed once or twice per month from February 2004 to December 2005. The total average number of birds encountered during the 2004 breeding season was 107.16 (± 3.76, n=12); and in the 2005 breeding period the average was 126 (± 3.16, n=13). During the day I also found adults and juveniles roosting and/or nesting in the tanjung tree and under the roof of the fourth floor of the main building. The number of birds encountered during the day was less than the afternoon counts, with the maximum being 36 birds. Twenty-four birds were marked and released from March to July 2004. However, none of the marked birds were re-caught. During subsequent observations from August to December 2004, 9 marked and 167 unmarked birds were sighted. The resighting frequency for individual marked birds range from 1 to 3. Using the resight estimation formula (Krebs 1999), the total Java sparrow population at Malang was estimated at 259 (44 – 112; CL 95%). g. Lumajang and Gresik Information obtained from bird trappers suggested that Dadapan was the most recent site where they had caught birds. However, three surveys at this site in 29.
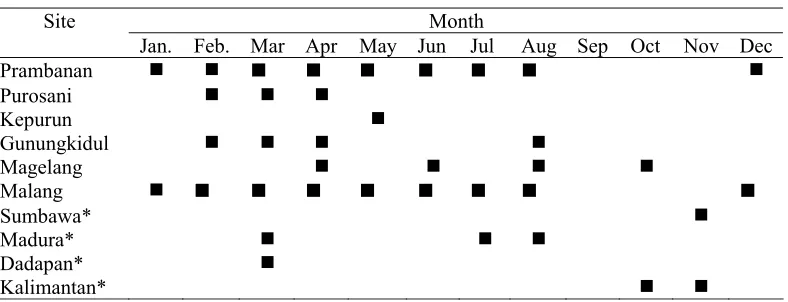
(32) October and December 2004 and March 2005 did not encounter any Java sparrow. This was also true for Sugio which was surveyed four times from October 2004 to March 2005. Meanwhile, at Ujung Pangkah, and Gresik, 4 of 8 surveys encountered the Java sparrow. One bird was observed in both October 2004 and March 2005 and six birds in April and June 2005. I suspected that these birds used limestone caves in the region as nesting sites. 2.4.2.3. Breeding Table 1 provides observed and/or estimated breeding periods for the Java sparrow at each study site. Previous reviews found that within its natural range the Java sparrow breeds during extended periods from February to August (BirdLifeInternational 2001). However, Table 2.4 shows that at the present study sites breeding extends for even longer periods, particularly in Prambanan and Malang, where breeding birds were observed in all months except September to November. In Gunungkidul breeding occurs during the periods when either rice paddies (February – April) or gaplek cassava (August) are harvested. At other sites breeding is also sporadic and so may be related to the abundance of locally available resources. The nest sites used by individual Java sparrow seemed to encompass almost any protected nesting hollow and varied according to location. They included gaps beneath the eaves of buildings (Malang, Purosani and Magelang), under a parabola antenna (Malang), holes among the stone slots of the Prambanan temples, crevices in limestone caves (Gunungkidul and Gresik) and nesting cavities in trees (Prambanan and Kepurun). Java sparrows were observed occupying barbet’s nest holes in Randu Alas (Gossampinus sp.) in Prambanan and attacking a woodpecker in a fight for a nest hole in an albizia tree (Sumiyar, pers.com., 2004) in Kepurun. In general, nests were of an untidy and loose construction with the material used varying from fresh and dried grass, to plastic rope, and small plastic sheets from cigarette boxes. During this study only 4 clutches were observed, two in Prambanan and two in Magelang. Clutches ranged from 4 to 6 eggs (Prambanan), and 4 to 7 eggs (Magelang), with an average of 5.5±0.91 (n=4). However, the number of fledglings encountered per nest was generally smaller, ranging from 2 to 6 birds (Malang). I observed a group of 12 juveniles associated with a single paired adult in Malang, but. 30.
(33) it is likely these juveniles came from different clutches. During this study I also recorded three and four dead nestlings, at Magelang and Pambanan respectively. All were below nest sites, suggesting that they had fallen for unknown reasons. Table 1. Breeding time of the Java sparrow in the study sites Site Jan. . Feb. Mar Apr . Month May Jun Jul. Aug Sep Prambanan Purosani Kepurun Gunungkidul Magelang Malang Sumbawa* Madura* Dadapan* Kalimantan* Note: * base on the finding of young birds in bird markets in Surabaya. Oct. Nov Dec . . . . 2.4.2.3. Sex ratio Given that the sex of the birds could not be assessed at a distance, e.g. during bird counts, the sexes of the Java sparrow were assessed using wild-catch birds and samples collected from the bird markets. A total of 66 adult birds were sexed, 29 females and 37 males. Molecular sexing of 20 juvenile birds resulted in 12 females and 8 males. Sex ratios for either adult or juvenile Java sparrow did not deviate from 1:1 (X2 = 0.97; P= 0.32 and X2 = 0.80; P= 0.37, respectively).. 2.5. Discussion 2.5.1. Comparison to pre-2004 surveys While previous studies were primarily designed to identify the distribution of the Java sparrow rather than to estimate abundance, population estimates were reported. As expected, most of these studies appeared to produce underestimates of population sizes, due to poor or inappropriate counting methods. Muchtar and Nurwantha (2001) reported only 109 birds at 63 sites during their study across the islands of Java and Bali, while in the Yogyakarta region during a January-February. 31.
(34) survey in 1999, Laudensius et al. (2000) found 125 Java sparrows in 21 sites. A better population estimate was reported for Prambanan and Magelang populations (Anonymous 2003), in which replicated counts were conducted at nesting and/or roosting sites. My current survey covered about half the region examined during previous studies (Aji 1999; Imansyah et al. 1999; Laudisensius et al. 2000; Muchtar and Nurwatha 2001; Anonymous 2003). However, the survey program was more intensive and applied more robust counting methods. For this reason, it is expected that the estimates obtained are more reliable and are appropriate for identifying the recent status of the Java sparrow. In total, the presence of Java sparrows was confirmed at 10 sites in this study, compared to 24 sites in previous studies (Laudisensius et al. 2000; Muchtar and Nurwatha 2001). In central Java only 2 of 21 previously occupied sites were still extant, but 6 new sites were located. Meanwhile in east Java only 2 occupied sites were recorded, compared to 3 known previously. One new site, however, was confirmed. I also found that Java sparrows were no longer present in other temple precincts in Yogyakarta, where nesting had previously been reported,. Temples at these sites did not appear to have holes or gaps among the stone appropriate for nesting. Interviews with temple guardian staff supported this observation. This study found that the Java sparrow still occupied nesting and/or roosting sites at Prambanan and Malang, but not feeding sites at these locations. However, two new feeding sites were observed at Kepurun and Gresik. This finding suggests that the presence of Java sparrows at specific feeding sites may be short-lived or intermittent. There are three possible explanations for this phenomenon. Firstly, Java sparrows may move over wide areas with their presence in a specific location only corresponding to a short term local abundance of food resources (Restall 1996). Secondly, it is possible that birds are always present at each site, but that small population sizes make it difficult to consistently observe them with current sampling methods. Thirdly, populations may become locally extinct because of high intensity trapping in these feeding sites (see below). Except for the population at Purosani, all new positive location records resulted from information gathered from trappers. These sites were considered ‘traditional’ trapping sites, suggesting that the birds have been in these locations for. 32.
(35) long periods of time. All trappers interviewed complained about the increasing rarity of Java sparrows over the last 10 years, suggesting a decline at trapping sites over this period. The Purosani nesting site occurs at a relatively new hotel, built in 1994. It is likely that this was a relatively new nesting colony that has moved from another site or originated from dispersing immatures.. 2.5.2. Population estimate Total population estimates of the Java sparrow in Central and East Java using point counts ranged from 137 to 209 (2004) and from 121 to 204 (2005). Using mark-recapture estimates for three sites resulted in population estimates ranging from 299 to 889 (2004). This gives a total population of Java sparrows within the surveyed area of no greater than ~1000 individuals. I believe that this result is the best estimate of the number and distribution of remnant Java sparrow populations obtained to date. If this pattern is consistent across other regions, then Java sparrow populations within the species natural range remain very small and fragmented. However, our findings also imply that other small populations may exist that are still to be found if similar intensive surveys are undertaken in other areas. More recently, other new locality records have been reported in the area surrounding Yogyakarta (e.g. Imogiri and Keraton; Kurniandaru & Wardani, pers. comm 2006) and in Semarang and Purwodadi (Sigid, pers.comm, 2006). For this reason, I believe that the total Java sparrow population in Indonesia is likely to be at the lower end of the range from 2500 – 10000 individuals, that is currently used to classify the species as ‘Vulnerable’ (BirdLifeInternational 2006). Each count method used in this study resulted in substantially different estimates. Here, I briefly discuss the advantages and disadvantages of each method. For direct roost counts, locating Java sparrow roosting and/or nesting sites is the key factor in estimating population size. This study found that there was a staging site/tree associated with each nesting site. In addition the roosting site may or may not be close to the staging site. Birds left the staging site to roost at approximately the time of Adzan Maghrib, within a half hour of dusk each day. Therefore counting the birds at this time and in this location produces a consistent and repeatable. 33.
(36) comparative estimate of the local population. Failure to locate all staging sites, however, will produce underestimate of population size for the studied areas. In addition there were potential sources of bias in this method. Firstly, low light intensity at dusk may produce observer error and secondly, the occurrence of other species in the flying-flocks. This phenomenon was a particular problem in relatively big colonies. In Malang I found small mix-species flocks that included Oriental White-eye (Zosterops palbebrosa). Other finch species (Lonchura punctulata) were also found in the staging trees in Prambanan and Malang, but these species were not mixed with Java sparrow. Mark-recapture provided much larger population estimates, ranging from 2 to 10 times greater than the roosting/point counts, but this method also produced much wider confidence limits. This was because of the use of Bowden’s resight estimator which does not apply restrictive assumptions regarding the equal sightability of the sampled birds (Krebs 1999). In addition to more variable estimates, this method also required significantly more time and resources. For the latter reason, even though estimates using mark recapture suggest that roost counts produce consistent and significant underestimates of the total population at any given site, we consider roost counts to be the preferred census method for any future population monitoring program for the Java sparrow. This is because, once appropriate roosting locations have been identified, roost counts allow cost effective and relatively precise comparative estimates to be obtained over time at individual locations. Such counts can then be scaled to absolute population estimates by combining them with intensive mark-recapture methods at appropriate intervals. The findings of this study confirmed that remnant Java sparrow populations currently consist of very few individuals and that the distribution of these remnants is also highly fragmented. Therefore, levels of genetic diversity in the Java sparrow may also have deteriorated and become spatially structured across these remnants. This possibility is further examined in Chapter 4.. 34.
(37) CHAPTER 3. INTRASPECIFIC PHYLOGEOGRAPHY. 3.1. Introduction Long-term global climate fluctuations are widely believed to be the major historical process influencing the genetic variation of natural populations (Hewitt 2000). Numerous studies of temperate birds across a range of habitat types provide evidence of low genetic diversity due to population bottlenecking in glacial refugia, followed by rapid post-glacial (recent) population expansions (e.g. Zink and Dittman 1993; Merila et al. 1997; Fry and Zink 1998; Pestano et al. 2000). Similar patterns are also evident among tropical seabirds (Peck and Congdon 2004) and some tropical forest species (Brook et al. 1997; Bowie and Fjeldsa 2004) not directly impacted by ice sheets. However, this is not the case for all tropical forest birds. For example, the phylogenetic history of the upland forest superspecies Xiphorhynchus spixii/elegans was created by interactions among geology, sea level changes, and hydrology (Aleixo 2004). A lack of appropriate studies means that virtually nothing is known of the potential impact of these same phenomena on tropical open woodland or savannah species. During the last glacial maximum of the Pleistocene (about 18 ky BP), sea level was ~120 meters below present levels. In Southeast Asia this resulted in Sumatra, Borneo and Java being connected to the Asian mainland, forming Sundaland (Heaney 1991). The paleoclimate in Java at this time was cooler and drier, with these conditions resulting in the expansion of seasonal forest and savannah (Kazuko Urushibara-Yoshino 1997). However, about 18 - 9 ky BP (Whitten et al. 1997), or 5 – 10 ky BP (Kazuko Urushibara-Yoshino 1997), the climate became warm and wet, allowing rainforest to develop and expand (Kazuko UrushibaraYoshino 1997). The consequences of this change for woodland and savannah species in Java are unknown.. 35.
(38) 3.2. Aims Effective conservation planning for the Java sparrow requires information on current levels of population fragmentation and inter-colony gene flow, as well as on the possible genetic consequences of the rapid decline in numbers over the last 30 40 years. Before any of these more recent genetic processes can be interpreted in detail, it is necessary to have a clear understanding of the influence of historical processes on Java sparrow genetic diversity over geological time scales. To this end, I used variation in mtDNA control region sequences to analyse intraspecific phylogeography for the Java sparrow. Understanding the phylogenetic history of this species not only provides valuable information that can be used to examine factors influencing current levels and patterns of genetic variation in this threatened species, but also allows us to establish and compare the potential influence of historic glacial cycles on this tropical woodland species to the known effects of these phenomena on other non-woodland taxa elsewhere in the world.. 3.3. Methods 3.3.1. Population sampled In total 104 DNA Java sparrow samples from throughout the species natural range, including Java (n=72), Madura (n=21), and Bali (n=11), were sequenced. An introduced population from Kalimantan (n=11) was also included in this study. Samples from wild populations were obtained using mist-nets or clap trap nets during population studies in 2004 and 2005 (Figure 2). Whole blood samples were collected from each individual by clipping toe nails. Blood samples were then stored in Queen’s lyses buffer at 4oC (Seutin et al. 1991). Mr. Sang Putu Kaler Surata kindly provided an additional 11 total DNA samples from birds caught in Bali. In addition, 29 foot-skin samples were obtained from historical museum specimens collected at 4 sites across Java during the period 1932-1941, prior to any perceived decline (Figure 4). For comparative purposes, samples were also obtained from an introduced population from the Cocos-Keeling Islands (Appendix 3).. 36.
(39) 3.3.2. DNA extraction Whole blood and tissue from foot pads were used as starting material for DNA extractions. For blood samples, approximately 45 µl blood/Queen’s Lysis sample was extracted with a standard phenol-chloroform extraction protocol (Bruford et al. 1998) or using the DNeasy® Tissue Kit (Qiagen Pty Ltd). In the first protocol, samples were digested with proteinase K (10-40 mg/mL) in an extraction buffer at 37˚C overnight. Purification of DNA was carried out with one extraction with phenol:chloroform:isoamyl alcohol (24:24:1) wash and one extraction with chloroform-isoamyl alcohol (24:1) wash. Precipitation of DNA was done with 2 volumes of absolute ethanol, followed by a washing step in 70% ethanol. DNA was then resuspended in TE buffer (10 mM Tris, 1mM EDTA, pH 7.2). Meanwhile, the second protocol followed the recommended protocol for animal blood (Qiagen Pty Ltd). For tissue, approximately 1- 2 mg of footpad was ground using a micro-pestle in a 1.5 microlitre (μl) microfuge tube. DNA extraction was carried out with the DNeasy® Tissue Kit (Qiagen Pty Ltd), following feather extraction protocol. Specific care was taken with the museum samples in order to prevent cross-contamination with DNA obtained from blood samples. All museum specimens were extracted at a different time under a UV laminar flow unit, using a different set of reagents, pipettes and other equipment from those used for DNA extraction from blood samples. The quality of DNA products was then validated with electrophoresis, by loading 5 μl of resuspended DNA along with 5 μl of x 1 TA buffer and 2 μl of loading dye (Bromophenol Blue) onto a 2 % agrose gel. Ethidium bromide (EtBr) was included in the gels to visualise the DNA. Gels were run in x1 TBE buffer at 45 MA for approximately 25 minutes. DNA was detected using ultraviolet light (GelDoc 1000 image system, BIORAD). The Hoefer® DyNa Quant® Fluorometer was used to measure the average quantity of DNA product from the above protocols.. 37.
(40) 3.3.3. Polymerase chain reaction and sequencing The polymerase chain reaction (PCR) was used to amplify a 450 base fragment of the mtDNA control region, spanning parts of domain I and II. Initially, the primers FireC1F1 (5’- TTTTCCTHNTGACTTTTAGGGTATG –3’) and FinchC1R1 (5’ – GGGATGGTCCTGAAGTTACAAC – 3’) (Sorenson and Payne 2001) were used, but amplified poorly. For this reason a species-specific internal forward primer GJ1F (5’ – GGGTATGTACAAAATGCATCGCA – 3’) was designed and paired with FinchC1R1. Because DNA extracts from museum specimens were of poorer quality, only a smaller portion of the same region could be sequenced that did not include approximately the first 70 bp. This was done using two sets of species-specific primers that amplified a 180 bp and 165 bp fragment respectively with an ~10 bp overlap: GJ2F (5’ GGCACATTTTTGCTTCAGGT -3’) and GJ2R (5’- TAACCAGGTCCTCTGGCTTG -3’) for the first fragment and JS3F (5’- CTAGGGTTGGGTGCAGTAGAAAA – 3’) and FinchC1R1 for the second. Each PCR was carried out in a 25 µl reaction volume containing 10x PCR Buffer (10mM Tris-HCL (pH 8.4), 50mM KCl), 2.5mM MgCl2, 20pmol of each primer, 0.8μg/μl of bovine serum albumin, 0.1 mM of each dATP, dTTP, dCTP, dGTP and 1 unit of Taq polymerase (Promega). Thermocycling conditions were as follows: initial denaturing steps of 95º C - 90s, 35 cycles denaturing at 95º C - 30s, annealing at 55º C - 60 s, extension at 72º C- 90s, and a final extension step of 72º C – 7m. The same cycling conditions were used for museum samples, except that they were repeated for 50 cycles. Double strand PCR products were purified by ethanol precipitation or spin column purification (Ultra Clean Tm, MO BIO Inc), prior to cycle sequenced using DYEnamic ET Dye Terminator Kit (MegaBACE). Sequencing products were purified and screened using MegaBACE™ DNA Analysis Systems at the Genetic Analysis Facility, James Cook University, Townsville.. 3.3.4. Statistical analysis 3.3.4.1. Historical demography Sequences were aligned and edited by eye using Proseq version. 2.9 (Filatov 2002). The evolutionary association between haplotypes was reconstructed using a median-joining network (Bandelt et al. 1999), performed in program Network 4.112. 38.
Figure

+7


Related documents