Survey: Other Learner Responsive
and Personal and Community
Development Learning Report
colleagues at LSC who worked on the research for all their help and assistance; thanks are also due to all the survey respondents who gave up their time to take part.
Department for Business, Innovation and Skills
1 Victoria Street
London SW1H 0ET
www.bis.gov.uk
BIS Research Paper number 23
Contents
Introduction………. 4
Background……… 4
Sampling………. 4
Sample profile………... 5
Multivariate analysis………..6
Interpretation of data………. 6
Report structure………. 6
Summary and implications………. 8
Other LR learners……….. 8
PCDL learners………10
Implications………. 12
Satisfaction and advocacy………13
Satisfaction with learning experience and advocacy………13
Reasons for satisfaction or dissatisfaction……….14
Satisfaction with the teaching and the provider……….15
Advocating the provider……….16
Performance on key drivers………..19
Quality of teaching……….20
Decline in the proportion extremely satisfied overall………21
Needs and expectations……….. 21
Early leavers………..30
Who left early………. 30
Reasons for leaving early……….31
Satisfaction and advocacy……… 34
Satisfaction with learning experience………. 34
Reasons for satisfaction or dissatisfaction……… 35
Satisfaction with the teaching and the provider……… 36
Advocating the provider……… 37
Performance on key drivers………. 39
Quality of teaching……….40
Decline in the proportion extremely satisfied overall and with quality of teaching ………...41
Needs and expectations……….. 41
Introduction
Background
This report presents the findings for 2,000 learners undertaking non-accredited personal and community development learning (PCDL) and 1,856 learners undertaking adult learning
provisions1 (referred as “Other Learner Responsiveness (LR) learners” throughout the report).
These learners were surveyed as part of the National Learner Satisfaction Survey (NLSS) 2009, which was conducted by Ipsos MORI Social Research Institute and commissioned by the Learning and Skills Council (LSC) which included around 25,000 learners in total. In April 2010, the LSC was superseded by the Skills Funding Agency and the Young People’s Learning Agency (YPLA) with its research function transferring to the Department for Business, Innovation and Skills (BIS). The NLSS is a large tracking survey of then LSC-funded learners aged 16 and over. The NLSS provides a wealth of data on learners’ satisfaction with their learning experience over time, including detailed information on three key aspects of the learner journey: initial choice and information; support during learning; and benefits of participation. There have been six national surveys since 2001 (annually between 2001 and 2004, 2007 and 2009).
Sampling
The NLSS covers learners in further education (FE), Apprenticeships, other learner responsiveness (LR) provisions, non-accredited personal and community development learning (PCDL), Skills for Jobs (SFJ) and Employability Skills programme (ESP) learning.
Sample profile
Table 1 shows the demographic profile of both other LR and PCDL learners. As can be seen, learners are predominantly female. Almost all are aged 19 or over (the majority are aged 25 or over). Around one in six other LR learners are from black and minority ethnic (BME) groups, considerably higher than the proportions in PCDL.
Four in five other LR learners are working towards qualifications at Entry Level and Levels 1 and 2; the corresponding figure for PCDL learners is substantially lower - 54 per cent. As would be expected, a significant minority of PCDL learners are undertaking learning that does not lead to a qualification.
Table 1: Sample demographic profile
Other LR (weighted) PCDL (unweighted)
(Unweighted Base: all respondents)
(1,856) %
(2,000) %
Gender
Male 30 23
Female 70 77
Age
16–18 9 1
19+ 91 97
Refused * 2
Ethnicity
White 81 93
BME 18 5
Refused * 1
Not known 1 0
Disability 12 11
Learning difficulty 10 5
Current level of learning
Entry and Level 1 51 35
Level 2 31 12
Level 3 13 7
Level 4 or 5 or higher
1 4
No level/Don’t know 4 32% (No level)
Multivariate analysis
In addition to standard analysis of the data, multiple regression analysis (also known as key driver analysis – KDA) was used to examine the relative importance of a range of factors in explaining overall satisfaction with the learning experience for other LR learners. This analysis was not undertaken for PCDL learners because the representativeness of this sample is unknown – there is no population profile data.
Interpretation of data
It should be remembered that a sample and not the entire population of learners has been interviewed. Consequently, all results are subject to sampling tolerances, which means that not
all differences are statistically significant. This report comments only on findings that are
statistically significant.
Where percentages do not sum to 100, this is due to computer rounding, the exclusion of ‘don’t know’ categories, or multiple answers. An asterisk (*) denotes values above zero but less than 0.5 per cent.
In this report, reference is made to ‘combined scores’. This is where we combine ‘extremely’, ‘very’ and ‘fairly’, or ‘strongly’ and ‘tend to’ scores. The report also makes reference to ‘net’ figures. This represents the balance of opinion on attitudinal questions. In the case of a ‘net satisfaction’ figure, this represents the percentage satisfied with a particular issue, less the percentage dissatisfied. For example, if an aspect of learning records 40 per cent satisfied and 25 per cent dissatisfied, the ‘net satisfaction’ figure is +15 points.
Combined and net scores are calculated using the true value of the scores before they are rounded. This can result in a small discrepancy (usually one percentage point) between the combined score and the sum of the rounded scores it relates to.
This report also makes reference to mean scores for questions where learners were asked to rank an aspect of their course or provider on a scale of 1 to 10. The mean score is compiled by adding the scores provided by all learners and dividing it by the number of learners answering the question.
Report structure
This report begins with a summary of key findings and implications for both Other LR learners and PCDL learners, followed by two chapters (one for each learner type) presenting the key findings across eight key sections:
Satisfaction with learning experience and advocacy;
Information, advice and support;
Personalisation, learner involvement and provider responsiveness;
Attitudes to learning and perceived benefits of learning; and
Early leavers.
In addition to this report, separate reports are also available for Apprenticeships, FE learners, learners on Skills for Jobs and ESP programmes, learners with learning difficulties and/or disabilities, young learners and adult learners. There is also an overall summary report, as well as a detailed technical report.
Summary and implications
Other LR learners
Satisfaction with the learning experience remains very high
Other LR learners are overwhelming satisfied with their learning experience: 91 per cent are satisfied with the overall experience and a similar percentage – 90 per cent – are satisfied with the quality of teaching.
These high satisfaction levels have been relatively stable since 2001 though, this year, there has
been a decline in learners who are extremely satisfied with their overall learning experience
(from 31 per cent to 19 per cent), reversing the gradual increase witnessed in previous years. This trend, however, has been observed across all learner groups and is not unique to Other LR learners.
Other LR learners remain strong advocates of their providers: 77 per cent say they would speak highly of their provider, including 33 per cent who would do so without being asked. These findings are in line with the 2007 survey.
Quality of teaching is a key driver of satisfaction
Learners’ satisfaction with the learning experience is closely linked to providers’ responsiveness to learners (that is, listening to, and acting on, learners’ views) and the extent to which learners feel their expectations have been exceeded.
These factors are also closely linked to advocacy (that is, learners’ willingness to speak highly of their provider to others), as is the personal relationship learners have with staff.
Providers’ performance on key drivers of satisfaction is rated highly by learners
In line with the high satisfaction level observed for quality of teaching, learners are equally positive about tutors’ and teachers’ performance on a number of specific measures including: their ability to make the subject interesting; their management of learners; and their ability to understand learners and different learning styles (all three aspects attracted a mean score of between 8.2 and 8.5 out of 10).
Two in five learners say they had experienced problems during their course. This represents a significant decline compared with 2007 when 54 per cent reported encountering problems. The most commonly cited problems are unchanged and relate to balancing course commitments with other commitments at home and/or at work.
Furthermore, 15 per cent of Other LR learners say that there was additional support that would have helped them which they did not receive. More support from, and time with, tutors and financial support were highest in demand (mentioned by one in seven each).
Over half of learners consider their provider to be good at supporting learners with learning difficulties and/or disabilities (59 per cent) or religious requirements (54 per cent), though a significant minority felt the latter was not applicable to them.
Nearly all learners rate the information they were given when choosing their course as good (88 per cent). They are similarly positive about the information they received on enrolment - the most positive ratings relate to the information they were given about course content (87 per cent) and the standard of work expected of them (82 per cent).
Learners are also positive about how providers interact with them with the vast majority reporting that they were treated with respect (96 per cent).
Furthermore, the majority of learners feel that providers are responsive to learners with 75 per cent reporting that providers are good at listening to learners’ views. Slightly fewer - 65 per cent – rate providers as good in terms of acting on learners’ views (this particular aspect is closely linked to high satisfaction levels).
The course has had a positive impact on attitudes to learning
Half of Other LR learners (51 per cent) recall feeling positive about education on leaving school. A quarter say they were negative (24 per cent) and one in five were indifferent (21 per cent). However, 81 per cent now say they feel more positive about learning than when they began the course.
Learners also report a number of personal and job-related benefits. For example, 86 per cent say they are now more confident in their ability to learn, 77 per cent say the course has equipped them with skills they can use for a job and 70 per cent feel more confident socially. Overall, learners are more likely to report all of these benefits compared with 2007.
The proportion of early leavers, and reasons for leaving early, have remained similar to previous years
Eight per cent of Other LR learners interviewed say they left their course without completing. One in five (19 per cent) left early due to health-related reasons and one in seven each found it difficult balancing their course commitments with family and/or work commitments (15 per cent and 14 per cent respectively). Learners aged 16-18 are slightly more likely to leave early than older learners.
As would be expected, learners who left their course early are most likely to express dissatisfaction with their learning experience (15 per cent compared with 5 per cent overall).
Around two in five early leavers say that they sought support from their tutor when they were considering leaving the course (43 per cent) and half were offered support at this time (48%).
However, two in five (40%) early leavers neither seek nor were they offered support.
PCDL learners
Satisfaction with the learning experience among PCDL learners remains very high
Learners express high levels of satisfaction with their learning experience, with over nine in ten satisfied. The same level of satisfaction is reported for quality of teaching (93 per cent in both cases)
Overall, satisfaction levels have been high and relatively stable since 2001. However, between
2007 and 2009 there has been a fall in the proportion of learners who are extremely satisfied
with their learning experience, and with the quality of teaching (by 17 and 3 percentage points, respectively), reversing a gradual increase in previous years. This pattern has been observed across all learner groups and is not unique to PCDL learners.
Nevertheless, advocacy level remains high with four in five PCDL learners saying that they would speak highly of their provider (80 per cent; it was 79 per cent in 2007), including 38 per
cent who would do this withoutbeing asked.
Providers’ performance on key drivers of satisfaction is rated highly by PCDL learners
One in seven learners (15 per cent) feels they would have benefited from receiving additional help or support. Financial support was most commonly mentioned (18 per cent) followed by support from tutors (16 per cent).
Furthermore, two in five (39 per cent) say they experienced problems during their course (a similar level to 2007 - 41 per cent). The most commonly mentioned problems are managing to balance course and home commitments (14 per cent) and maintaining personal motivation (12 per cent).
Most learners (85 per cent) say that the information they were given when choosing their course was good, as was the information they were given upon enrolment. Learners felt most informed about the content of the course (87 per cent) and the standard expected of them (73 per cent). They felt less informed about the overall pass/success rate for learners (43 per cent), and how the course might equip them with skills to use in a job (37 per cent).
High ratings are also given for the level of respect shown to learners (96 per cent) and how good providers are at listening to learners’ views (65 per cent). Learners are slightly less likely to say that providers are good at acting on their views (54 per cent) but a substantial proportion of PCDL learners do not feel that these issues apply to their course.
Attitudes, and benefits, of learning are overwhelmingly positive
Approaching two-thirds of PCDL learners (63 per cent) say they felt positive about education when they left school. One in five (19 per cent) say they generally felt negative while 15 per cent were indifferent. However, seven in ten (71 per cent) say they now feel more positive about learning than when they started the course.
PCDL learners also feel they have gained a number of benefits from the learning.
Three-quarters (75 per cent) say they are now more confident in their ability to learn and 69 per cent feel that the course has benefited their health and well-being. These findings are broadly in line with the 2007 survey.
Looking to the future, 64 per cent of PCDL learners say that they are very likely to do another course in the next three years which is in line with the 2007 finding (63 per cent). Just 11 per cent say they are unlikely to do so.
The proportion of early leavers, and reasons for leaving early, have remained similar to previous years
Three-quarters of early leavers did not seek support from tutors when thinking about leaving the course (76 per cent). Three in ten, however, reported that they were offered support (30 per cent). The majority (58 per cent) say that there is nothing their tutor could have done to help them stay on the course.
Implications
For both PCDL and Other LR learners, overall satisfaction with their learning experience is high and at similar levels to those in previous years of the survey. However, the proportions who are extremely satisfied have fallen, after a gradual increase in recent years, and so has unprompted
advocacy toward providers among PCDL learners. Learners’ overall assessment of their
course, and their rating of individual aspects, remain very positive, so there are no clear reasons for this change. This decline may be linked to expectations: many learners feel that the course has met (rather than exceeded) their expectations despite rating their learning experience highly,
or did not know what to expect. Finding ways to manage – and where possible exceed
-expectations may help to increase the group of learners who are extremely satisfied.
The quality of teaching is an important driver of satisfaction, as is the ability of staff to show respect to learners and act upon their views. This indicates that staff needs to have a range of skills (in addition to teaching) and providers also need to engage fully with learners on a personal level throughout the learning programme.
Satisfaction and advocacy
Other LR Learners
This section looks at Other LR learners’ satisfaction with their learning experience and the factors that are closely associated with high satisfaction levels. It also looks at what makes some learners more willing to speak highly of their providers.
Satisfaction with learning experience and advocacy
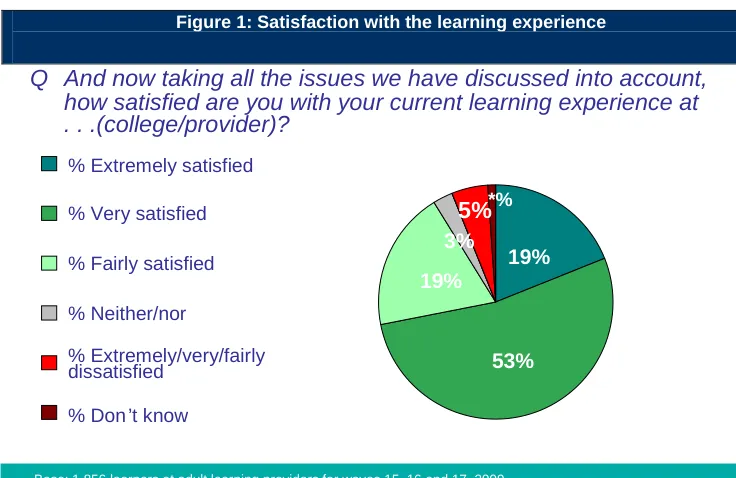
The vast majority of Other LR learners - 91 per cent – are satisfied with their learning experience (Figure 1), rising to 94 per cent among learners undertaking Entry and Level 1 qualifications.
Learners aged 19 or over are more likely to beextremely orverysatisfied (74 per cent compared
[image:13.595.104.472.350.589.2]with 63 per cent of 16-18 year olds). This is encouraging given the older age profile of Other LR learners. Satisfaction levels are comparable with those observed among learners in FE (91 per cent of learners in FE are satisfied with their learning experience).
Figure 1: Satisfaction with the learning experience
40 19%
19%
53% *%
5% 7%
3%
Q And now taking all the issues we have discussed into account, how satisfied are you with your current learning experience at . . .(college/provider)?
% Extremely satisfied % Very satisfied
Base: 1,856 learners at adult learning providers for waves 15, 16 and 17, 2009 % Fairly satisfied
% Neither/nor
% Extremely/very/fairly dissatisfied
% Don ’t know
*%
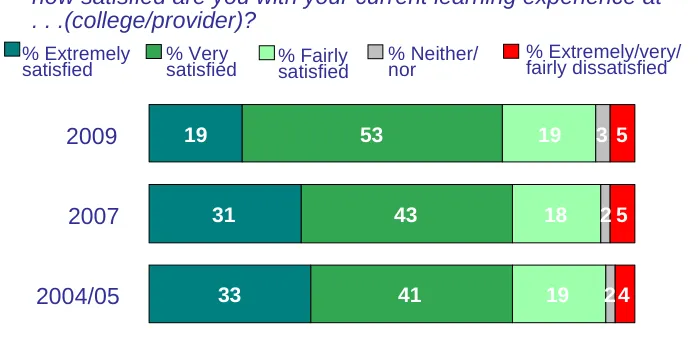
Figure 2: Trends in satisfaction with the learning experience 41 19 31 33 53 43 41 18 19 3 2 5 5 4 19 2 2009 2004/05 % Extremely
satisfied % Verysatisfied % Fairlysatisfied
% Neither/
nor % Extremely/very/fairly dissatisfied
Base: Learners at adult learning providers, 1,856 in waves 15, 1 6 and 17, 2009; 1,706 for waves 12, 13 and 14, 2007; and 1,731 for waves 9,10 and 11, 2004/05.
2007
Q And now taking all the issues we have discussed into account, how satisfied are you with your current learning experience at . . .(college/provider)?
Reasons for satisfaction or dissatisfaction
Learners were asked why they were satisfied or dissatisfied with the learning experience. Among those who were satisfied, the key reasons relate to the quality of the tutors or the course content (Figure 3).
Figure 3: Reasons for satisfaction with the learning experience
42 45% 38% 22% 22% 11% 11% 11% 8% 7% Top mentions
Base: 1,699 learners at adult learning providers who are satisfied with their learning experience for waves 15,16 and 17, 2009
Q You said you were extremely/very/fairly satisfied, what is the main reason for this?
Tutors are good/they make it easy/interesting for us/ help us
A good course/learnt a lot/enjoyed it/up to expectations
They were very helpful/always ready to help/get all the help I need
Gives me what I wanted/the experience/qualification
Like the place/the college/good working environment Enjoy the subjects/areas covered/interested in what I do
They were very friendly/welcoming
I’m pleased with my progress/doing better than expected
[image:14.595.116.477.573.752.2]Just five per cent of learners expressed dissatisfaction with their learning experience. The most commonly cited reasons were: the course was disappointing and not what they’d expected (35 per cent); the course was badly run/organised (31 per cent); tutors had poor attitudes and were unsupportive (25 per cent); and communication was poor (24 per cent).
Satisfaction with the teaching and the provider
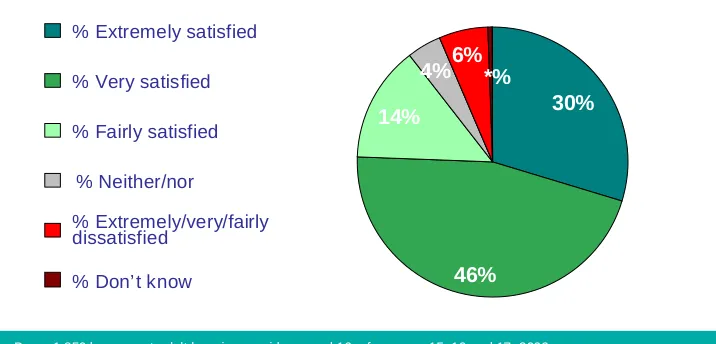
[image:15.595.112.470.328.500.2]As would be expected, learners’ satisfaction with the quality of teaching follows a similar pattern: nine in ten Other LR learners say they are satisfied (Figure 4) which is, again, comparable with the high satisfaction levels observed among learners in FE (89 per cent).
Figure 4: Satisfaction with quality of teaching
53 30%
46% 14%
4%6%*%
Q Overall, how satisfied are you with the quality of the teaching/ training at . . .?
% Neither/nor
Base: 1,856 learners at adult learning providers aged 16+ for waves 15, 16 and 17, 2009 % Extremely satisfied
% Very satisfied % Fairly satisfied
% Extremely/very/fairly dissatisfied
% Don’ t know
As with satisfaction with the learning experience, learners undertaking Entry and Level 1 qualifications are more likely than average to be satisfied with the quality of teaching (92 per cent).
Older learners, aged 25 plus, are slightly more likely than average to beextremely satisfied with the quality of teaching (32 per cent compared with 30 per cent overall), as are those studying Information and Communication Technology (37 per cent).
As might be expected, early leavers are least satisfied with teaching quality (73 per cent).
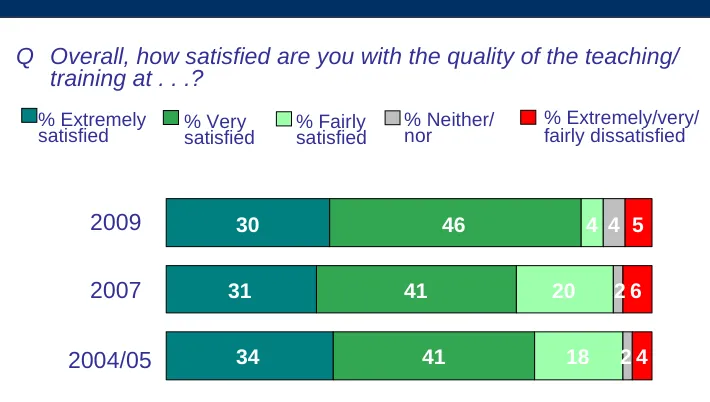
Figure 5: Trends in satisfaction with the quality of teaching 51 30 31 34 46 41 41 20 18 4 2 5 6 4 4 2 2007 2004/05
Q Overall, how satisfied are you with the quality of the teaching/ training at . . .?
% Extremely
satisfied % Verysatisfied % Fairlysatisfied
% Neither/
nor % Extremely/very/fairly dissatisfied
Base: learners at adult learning providers, 1,856 for waves 15, 16 and 17, 2009; 1,706 for waves 12, 13 and 14, 2007; and 1,731 for waves 9, 10 and 11, 2004/05.
2009
Advocating the provider
A third of Other LR learners say that they would speak highly of their provider without being asked (33 per cent), while a slightly higher proportion would speak highly if asked (44 per cent). Only five per cent would be critical of their provider (Figure 6). These findings are slightly more positive than the findings among FE learners, where 29 per cent would speak highly of their provider without being asked and 45 per cent would speak highly if asked.
Figure 6: Advocating the provider
45
Q Which of these statements best describes the way you would speak of . . . (college/provider) in their capacity as a training provider? 33% 44% 16% 4% 1% 2%
I would speak highly of them without being asked
I would speak highly of them if somebody asked me about them I would be neutral about them
I would be critical of them if somebody asked me about them
I would be critical of them without being asked
Don’t know
[image:16.595.124.431.556.720.2]Early leavers are significantly less likely than average to advocate their provider (63 per cent compared with 78 per cent overall) and more likely to be critical (10 per cent).
Learners aged 25 plus are more likely to be advocates than those aged 16-19 (79 per cent compared with 72 per cent). Learners undertaking qualifications at Level 2 or below are also more likely than average to advocate (79 per cent).
These findings are in line with NLSS 2007 and as also observed then, the most positive views are among those studying Information and Communication Technology (83 per cent are likely to speak highly of their provider).
Key drivers of satisfaction and advocacy
Regression analysis was undertaken to determine the factors most commonly associated with high satisfaction and advocacy. Figures 7-8 present the results of the multivariate analysis for Other LR learners, showing the relative importance of various aspects. The factors highlighted in green are those that have a positive relationship with learner satisfaction; factors in red signify a negative relationship. The model for overall satisfaction demonstrates a ‘fit’ (R2 value) of 57 per cent – this is the percentage of the variation in levels of satisfaction with the learning experience that can be ‘explained’ by the included factors. (It is not possible to identify causal
relationships using this type of model, however, only correlations.) Statistically, this is seen to be a good ‘fit’ model. The ‘fit’ for advocacy is much lower (37 per cent), indicating that it is less easy to explain variations in attitudes towards advocacy than it is in overall satisfaction.
Figure 7: Key drivers of overall satisfaction
49
23%
18%
Satisf act ion wit h learning experience
57% of variat ion in responses is explained by
model
• Rat e t eacher/tutor well on making subject interest ing
• Reason for satisf act ion: tutors are good
• Reason f or sat isfact ion: a good course • Provider good at acting on learner views
2 1%
8%
30%
Base: 1,856 learners aged 16+ from Other LR, Wave 1, 2009.
• Given good inf ormat ion when choosing course • Course is bet ter than expect ed
As noted above, the regression analysis for advocacy has a weaker fit than the model for overall satisfaction – 37 per cent of variations in learner advocacy can be explained by the factors included in Figure 8 compared with 57 per cent for satisfaction (Figure 7). However it is clear that, among Other LR learners, the relationship with provider staff is key – having staff who listens to, and acts on, learners’ views and relate well to learners are key factors in explaining high advocacy levels. Meeting and exceeding learner needs and expectations is also important as is tutors’ ability to manage groups of learners and understand how learners like to learn.
Figure 8: Key drivers of advocacy
48
57%
• Reason f or sat isfact ion: like the place
15%
Advocacy of provider
37% of variat ion in responses is explained by
model
• Provider good at listening t o student views • Provider good at acting on student views • Rate teachers/tutors well on how relat e t o learner as
person
• Rate teacher/t ut or well on managing group of learners • Rat e teachers/t ut ors well on how underst and how learner
likes t o learn
• Agree learning programme is meeting needs
• Course is bet ter than expect ed 22%
5%
[image:18.595.102.481.516.745.2]Performance on key drivers
This chapter examines providers’ performance on the key drivers of satisfaction. Table 2
summarises Other LR learners’ ratings for these key drivers (the table shows all items that account for 10 per cent or more of each model’s overall impact). The figures in the table show either the percentage rating each item positively or the mean score out of 10 (a higher score indicating a more positive rating).
Table 2: Performance on key drivers – summary
(Base varies by question) Other LR learners
Overall assessment
Learning programme is meeting my needs 90%
Experience was better than expected 34%
Course gives me the experience/qualification I wanted/needed 22%
Support
Good support provided on course 91%
Staff helpful in first few weeks 94%
Tutors/teachers
Satisfied with quality 90%
Make subject interesting/ enjoyable (mean) 8.5
Tutors set clear target/ goals (Mean) 8.1
Tutors mange the group well (mean) 8.4
Understand learner(s) and how they like to learn (mean) 8.2
Course content
A good course/learned a lot/enjoyed it/up to expectations 38%
Informed about course content 96%
Career
Good advice on next steps 63%
Agree that course will help move forward in career 65%
Relationship
Provider good at listening to views 75%
Provider good at acting on views 65%
Tutors relate to learner(s) as a person (mean) 8.7
Staff good at showing respect 96%
Quality of teaching
As indicated, learners express high levels of satisfaction with the quality of teaching on their course, and this is an important driver of overall satisfaction. In this section, we look at specific aspects of teaching.
Asked to give a rating between 1 (very poor) and 10 (excellent), learners generally give high ratings for teachers or tutors making the subject interesting or enjoyable for them, with a mean score of 8.54.
Those aged 19 or over give higher ratings than learners aged 16-18.
Decline in the proportion extremely satisfied overall
While overall satisfaction with the learning experience has remained high and in line with that
observed in the 2007 survey, there has been a decline in learners who are extremely satisfied,
from 31 per cent in 2007 to 19 per cent this year.
This decline, however, needs to be seen in the context of the high levels of satisfaction overall, and in the stable trends in the proportion who are satisfied.
Needs and expectations
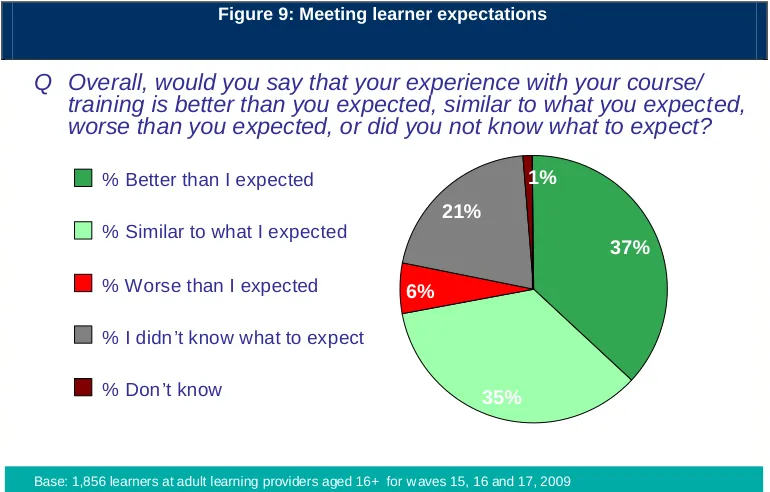
[image:21.595.97.482.387.633.2]The 2009 survey includes a new question to understand the relationship between learners’ actual experience and their prior expectations. Overall, the majority of learners feel that their expectations have at least been met. Almost two in five went further to say that the course exceeded their expectations (37 per cent). However, one in five admitted to not knowing what to expect (see Figure 10).
Figure 9: Meeting learner expectations
8 % Worse than I expected
% I didn ’t know what to expect % Don ’t know
% Better than I expected % Similar to what I expected
Q Overall, would you say that your experience with your course/ training is better than you expected, similar to what you expected, worse than you expected, or did you not know what to expect?
37%
35% 6%
21%
1%
Base: 1,856 learners at adult learning providers aged 16+ for w aves 15, 16 and 17, 2009
Those studying Business administration, Management and Professional courses are most likely
to say their course was worse than expected (15 per cent compared with six per cent overall)2
but a high proportion of these learners also did not know what to expect (28 per cent).
Nine in ten learners (90 per cent) say that their learning programme met their needs (Figure 11), with 59 per cent strongly agreeing – these findings are in line with 2007.
Figure 10: Meeting learners’ needs
60 59
60
31
30
3
3 3 3
3 3
Q Can you tell me how strongly you agree or disagree with the following statement: my learning programme is meeting my needs.
2007 2009
% Strongly
agree % Tend toagree % Neither/nor % Tend todisagree disagree% Strongly
Base: 1,856 learners at adult learning providers aged 16+ for waves 15, 16 and 17, 2009; 1,706 in 2007
Information, advice and support
While the majority of learners (84 per cent) were happy with the level of support they received, 15 per cent felt they needed additional help or support and that this was not provided to them (Figure 12). Those aged 25 plus are more likely to say there was more support needed (16 per cent) as are those studying the Business Administration, Management and Professional courses
(28 per cent)3 – as mentioned previously, those studying this course were also more likely to
Figure 11: Is more support needed?
62 Base: 1,690 learners at adult learning providers aged 16+, except early leavers, in waves 15, 16 and 17, 2009
% No
% Don ’t know % Yes
Q Is there any support that would have helped/help you with your course/training that you did not receive/currently do not get?
15%
84% 2%
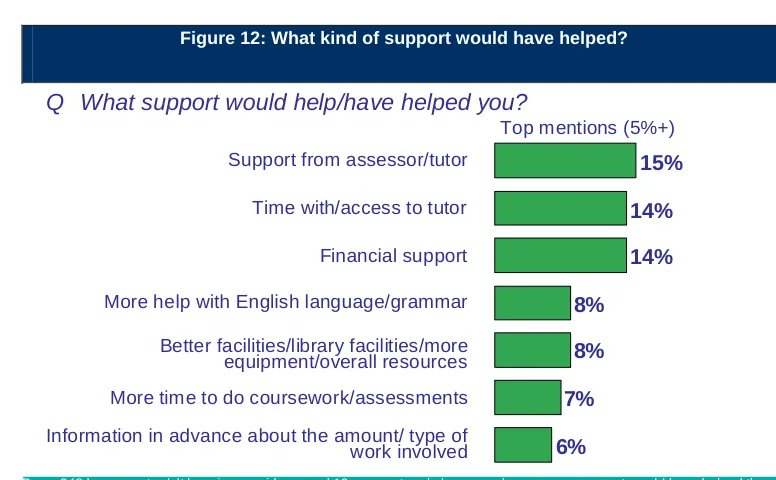
Support from, and time with, assessor and/or tutor and financial assistance were most commonly mentioned by learners wanting additional support (Figure 12).
Figure 12: What kind of support would have helped?
66 15%
14%
14%
8%
8%
7%
6%
Top mentions (5%+)
Q What support would help/have helped you?
Support from assessor/tutor
Base: 248 learners at adult learning providers aged 16+, except early leavers, who say more support would have helped them for waves 15, 16 and 17, 2009
Time with/access to tutor Financial support
More time to do coursework/assessments Better facilities/library facilities/more equipment/overall resources
Information in advance about the amount/ type of work involved More help with English language/grammar
Two in five learners also reported that they had experienced at least one of the problems listed in Figure 13 during their course. This represents a significant decline from 2007 when 54 per cent reported encountering difficulties during their course.
As can also be seen in Figure 13, the percentage of learners reporting different problems have
Figure 13: Problems encountered during the course
61
Q Since you started the course have you had any problems with any of the following?
14% 11% 11% 10% 8% 22% 18% 18% 20% 16% 2009 2007
Managing to keep up with the standard of work required
Base: 613 learners at adult learning providers aged 16+, all wav e 16, 2009; 536 in 2007
Maintaining your personal motivation Managing to fit course commitments in with other commitments at home
Managing to fit course commitments in with other commitments at work
Dealing with money pressures
Top mentions in 2009
Three in five learners describe their provider as good at supporting learners with learning difficulties and/or disabilities, rising to 78 per cent among learners with a learning difficulty or disability. However, a third was unable to comment or said it did not apply to them (Figure 14).
Half of learners rate their provider as good at providing support for needs relating to religion, faith or beliefs.
Figure 14: Provider support for learners with learning disabilities and/or needs related
to religion/faith/beliefs 62 36 28 23 22 3 22 23 4 21 23 13
Q And for each of the following aspects of your learning
experience, please tell me how good or bad each of them is.
How well . . . (provider) supports learners with learning difficulties or disabilities
How good is the support provided for any particular needs relating to your religion, faith or beliefs
Base: 613 learners at adult learning providers aged 16+, in wave 16, 2 009 % Not good but
not bad
% Bad % Very
good
% Good % Very Bad % Does
not apply
Approaching nine in ten learners (87 per cent) say that the information they were given when
they were choosing their course was good. Just 3 per cent think that they were given
information that was bad (Figure 15).
Figure 15: Information given when choosing course
10 Base: 631 learners at adult learning providers aged 16+, at wave 15, 2009
% Not good but not bad % Bad
% Very bad % Very good % Good
Q How good was the information you were given when you were choosing your course/learning/training programme? Was it…
47% 41%
7%3% 2%
% This does not apply
Learners are positive about the information they received on enrolment. They felt most informed about the content of the course (87 per cent) and the standard of work expected of them (82 per cent), but felt less informed on how to access financial support when learning (56 per cent) and the overall pass rate of learners taking their course (59 per cent), as shown in Figure 16.
Figure 16: Information received on enrolment
56 59 72 77 81 82 87 10 13 14 14 14 27 25 14 6 12 7 5 2 1 7 5 3 2 2
% Not very/at all well informed % Very/Quite well
informed
Q Now I would like to ask you a few questions about how informed you felt about the course/ training at the time you signed up for it.
Types and timing of exams and/or assessments
% Not
applicable % Don’t know
Content of the course – topics covered
Amount of work expected of you in your own time
How the course/training would help you gain skills to use in a job The standard of work expected of you
How to access financial support whilst learning/training Overall pass/success rate for learners at [provider name]
others to say they feel well informed about how to access financial support whilst learning (76 per cent compared with 51 per cent).
Personalisation, leaver involvement and provider responsiveness
Learners are extremely positive about the respect shown to them by staff, with almost all respondents rating this aspect as good (96 per cent) and over two thirds rating it as very good (68 per cent).
Learners aged 25 plus are more likely to rate the respect shown by staff as very good compared with those aged 16-18. Those with learning difficulties and/or disabilities are also more likely to describe the level of respect shown by staff as very good (77 per cent).
Figure 17: Respect shown by staff
11
Q Please tell me how good or bad is the respect staff show to you/respect training staff show to you.
Base: 1,856 learners at adult learning providers aged 16+ for waves 15, 16 and 17, 2009 % Not good but not bad
% Bad % Very bad % Very good % Good
68% 28%
2%1% 1%
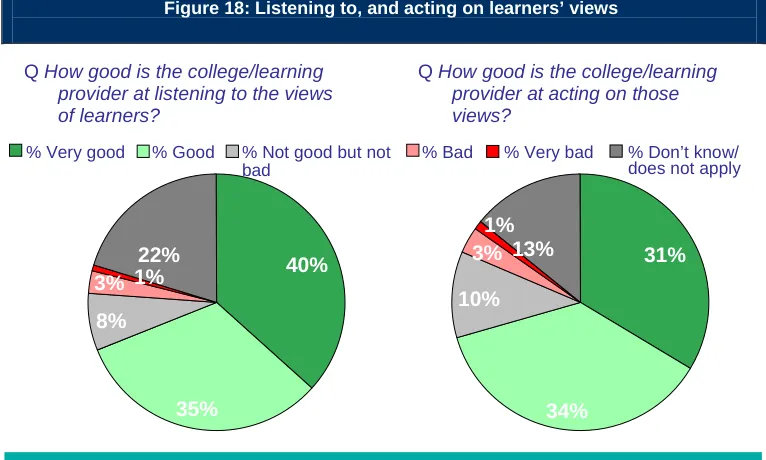
Three-quarters of learners say that their learning provider was good at listening to the views of learners, while just four per cent think that this was done badly (Figure 18).
Younger learners, aged 16-18, are more likely than average to say their provider is good at
listening to learners’ views, as are those with learning difficulties and/or disabilities.
Learners are less likely to say that providers are good atacting on learners’ views (65 per cent
Figure 18: Listening to, and acting on learners’ views
68 31%
34% 10%
3% 1% 1%
13% 40%
35% 8%
3% 1% 22%
QHow good is the college/learning provider at listening to the views of learners?
Base: 1,856 learners at adult learning providers, aged 16+ for w aves 15, 16 and 17, 2009
QHow good is the college/learning provider at acting on those views?
% Not good but not bad
% Bad
% Very good % Good % Very bad % Don’t know/ does not apply
Again, younger learners, aged 16-18, are more likely to rate their providers as good on this measure, as are those with learning difficulties and/or disabilities.
Attitudes to learning and benefits of learning
Learners were asked to reflect on their attitudes towards education when they left school: half reported feeling generally positive about education, a quarter say they had negative feelings and one in five were indifferent (Figure 19).
However, 81 per cent say they now have positive feelings about learning, representing a
significant shift in views.
Figure 19: Feelings about learning upon leaving school
51%
24% 21%
4%
% Had generally positive feelings about education
Q Thinking back to when you left school would you say that you . . .?
[image:27.595.136.427.616.760.2]Male learners and those aged 16-18 are more likely than average to cite an indifference to education when they left school. By contrast, Asian learners are more likely to display positive views towards education.
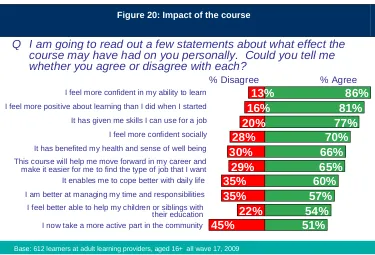
The majority of learners are able to indicate ways in which their course has impacted on them personally. Learners are most likely to agree that they feel more confident in their ability to learn (86 per cent) and that they feel more positive about learning than when they started the course (81 per cent). Over three-quarters (77 per cent) also feel that their course has given them skills they can use for a job. Learners aged 16-18 tend to be more likely to agree than average.
[image:28.595.105.480.321.576.2]Learners are less likely to agree that the course has led them to take a more active role in community activities or improved their ability to manage their time and responsibilities. Learners undertaking Level 2 qualifications are more likely than average to disagree that their course has benefited them in these ways.
Figure 20: Impact of the course
74 16% 20% 28% 30% 29% 35% 35% 22% 45% 86% 81% 77% 70% 66% 65% 60% 57% 54% 51% 13%
Q I am going to read out a few statements about what effect the course may have had on you personally. Could you tell me whether you agree or disagree with each?
% Disagree % Agree
This course will help me move forward in my career and make it easier for me to find the type of job that I want
Base: 612 learners at adult learning providers, aged 16+ all wave 17, 2009
I feel better able to help my children or siblings with their education It has given me skills I can use for a job
I feel more confident socially I feel more confident in my ability to learn
I am better at managing my time and responsibilities I feel more positive about learning than I did when I started
It enables me to cope better with daily life It has benefited my health and sense of well being
I now take a more active part in the community
Learners are generally more likely to agree with the statements in Figure 20 now than in 2007. They are particularly more likely to agree now that they take a more active part in the community (up 10 percentage points), that the course has benefited their health and sense of well-being (up nine percentage points), and that they feel more confident socially (up six percentage points).
The only measure on which learners are less likely to agree now is that they are better at managing time and responsibilities, down two percentage points from 2007.
Those most likely to undertake further learning are women, learners aged 25 plus and learners currently undertaking a Level 2 or below.
Figure 21: Likelihood of undertaking further learning
75 61
64
68
25
23
24 6
3 4
5
3 4
3
2 5
% Fairly unlikely
% Don’t know % Very
unlikely % Very
likely
% Fairly likely
Q How likely will you be to undertake further learning in the future (say in the next 3 years)?
2007
2004/05
Base: 1,856 learners at adult learning providers, 1,706 for waves 12, 13 and 14 (2007) and 1,731 for waves 9, 10 and 11 (2004/05).
Early leavers
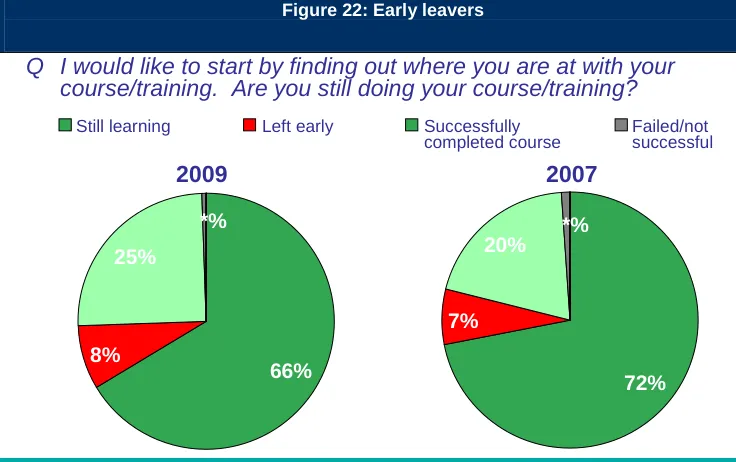
This section focuses on early leavers who make up eight per cent of Other LR learners interviewed.
Who left early
[image:30.595.108.476.324.555.2]In total, eight per cent of Other LR learners had (at the time of the interview) left their course early (Figure 22), which is in line with findings from 2007. Two-thirds were still on the course at the time of the interview, while 25 per cent had completed the course. However, it should be noted that these figures should not be used to derive completion rates as the survey is not designed for this purpose; rather these are monitored by the Individualised Learner Records (ILR) database.
Figure 22: Early leavers
74 72%
7%
20% *%
66% 8%
25%
*%
2009 2007
Q I would like to start by finding out where you are at with your course/training. Are you still doing your course/training?
Base: 1,856 other LR learners aged 16+ for waves 15, 16 and 17, 2009; 1,706 other LR learners for waves 12, 13 and 14.
Successfully completed course
Still learning Left early Failed/not
successful
Table 3: Demographic profile of early leavers (weighted)
All Other LR
(1,856)
%
Other LR Early Leavers
(163) %
(Unweighted base in brackets: all respondents)
Gender
Male 30 29
Female 70 71
Age
16–18 9 16
19+ 91 85
Refused * 0
Ethnicity
White 81 82
BME 18 14
Refused * 0
Not known 1 4
Disability 12 12
Learning difficulty 10 13
Reasons for leaving early
Figure 23: Reasons for leaving early
13
19% 15% 14% 13% 11% 11% 5% 5% 5%
Top mentions
Q You said that you have left the course early. What do you consider were the main reasons for leaving early?
Wrong course for me
Base: 163 early leavers from adult learning providers aged 16+, waves 15, 16 and 17, 2009 Tutor poor/problems with teaching quality
Difficult to combine with family or other commitments Health reasons
Difficult to combine with work commitments
Personal issues (illness of a family member/ bereavement)
Work too difficult Financial reasons Got a job
Compared with 2007, learners are now more likely to mention health problems and/or home and work commitments as reasons for leaving prior completion.
Over two in five Other LR learners who left their course earlysought support from their tutors to help them stay on, postpone or change their course (Figure 24). Seven in ten of these learners say they were offered support.
Almost half of early leavers were also offered support by their tutors, though 51 per cent were
not. Early leavers aged 16-19 are more likely than average to say that they were offered support which is encouraging as learners in this age group are more likely leave prior completion.
Two in five (40%) early leavers did not seek nor were they offered support.
Figure 24: Sought or offered support
Q And when you were thinking about leaving the course…
43%
48% 56%
51%
1%
2%
Yes No Did you seek support from your teachers
or tutors to help you stay on the course, postpone the course, or change to another course?
Did your teachers or tutors offer support to help you stay on the course, postpone the course or change to another course?
[image:32.595.109.489.547.770.2]Satisfaction and advocacy
PCDL Learners
This section looks at PCDL learners’ satisfaction with their learning experience and the factors that are closely associated with high satisfaction levels. It also looks at what makes some PCDL learners more willing to speak highly of their providers.
Satisfaction with learning experience
The vast majority of PCDL learners - 93 per cent - are satisfied with their learning experience (Figure 25).
Figure 25: Satisfaction with the learning experience
3 20%
19% 2%6%
54%
Q And now taking all the issues we have discussed into account, how satisfied are you with your current learning experience at . . .(college/provider)?
% Extremely satisfied % Very satisfied
Base: 2,000 PDCL learners aged 16+ for waves 15, 16 and 17, 2009 % Fairly satisfied
% Neither/nor
% Extremely/very/fairly dissatisfied
% Don’t know
*%
Overall satisfaction levels are in line with those reported in the 2007 survey (Figure 26) and have remained stable since the first NLSS in 2001 although, this year, there has been a decrease in
the proportion saying that they are extremely satisfied.This trend has been observed across all
Figure 26: Trends in satisfaction with the learning experience 4 20 37 39 54 42 40 14 15 2 2 6 5 4 19 2 2009
Q And now taking all the issues we have discussed into account, how satisfied are you with your current learning experience at . . .(college/provider)?
2004/05 % Extremely
satisfied % Verysatisfied % Fairlysatisfied % Neither/nor % Extremely/very/fairly dissatisfied
Base: PCDL learners, 2,000 for waves 15, 16 and 17, 2009; 3,821 for waves 13 and 14, 2007; and 1,880 for waves 10 and 11, 2004/0 5.
2007
Reasons for satisfaction or dissatisfaction
Learners who are satisfied with the learning experience cite a wide range of reasons for feeling positive, with quality of tutors and course content most commonly mentioned (Figure 27)
Figure 27: Reasons for satisfaction with learning experience
5 43% 38% 26% 16% 14% 12% 12% 8% 6% 6% Top mentions
Base: 1,850 PCDL learners aged 16+ who are satisfied with their learning experience, waves 15, 16, and 17, 2009.
Q You said you were extremely/very/fairly satisfied, what is the m ain reason for this?
It's well run/ well organised Good group of learners/ work well together/ help each other They were very friendly/ welcoming I'm pleased with my progress/ doing better than expected Social life is good/ met lots of people/ good fun Enjoy the subjects/ areas covered/ interested in what I do They were very helpful/ always ready to help/ get all the help I need
similar proportion (29 per cent) say the course was disappointing and not what they had expected. A quarter (26 per cent) felt the course was badly run or organised and 19 per cent were unhappy because they did not get the help they needed.
Satisfaction with the teaching and the provider
[image:36.595.103.496.240.480.2]Learners’ satisfaction with the quality of teaching shows a similar pattern to the findings for overall satisfaction: 93 per cent of PCDL learners are satisfied with the quality of teaching or training on their course (Figure 28).
Figure 28: Satisfaction with the quality of teaching
10 35%
45% 13%
2%5% *%
Q Overall, how satisfied are you with the quality of the teaching/ training at . . .?
% Neither/nor
Base: 2,000 PCDL learners aged 16+ for waves 15, 16 and 17, 2009. % Extremely satisfied
% Very satisfied % Fairly satisfied
% Extremely/very/fairly dissatisfied
% Don’t know
Learners undertaking qualifications at Level 4 or higher are most satisfied with the teaching quality (99 per cent). As might be expected, early leavers are least satisfied (68 per cent).
Figure 29: Trends in satisfaction with the quality of teaching
11 35
38
41
45
41
39
14
14 2
2 5
5
3 13
2
2009
2004/05
Q Overall, how satisfied are you with the quality of the teaching/ training at . . .?
% Extremely
satisfied % Verysatisfied % Fairlysatisfied % Neither/nor % Extremely/very/fairly dissatisfied
Base: PCDL learners, 2,000 for waves 15, 16 and 17 (2009); 3,821 for waves 13 and 14 (2007) and 3,770 for waves 10 and 11 (2004/05).
2007
Advocating the provider
Almost two in five PCDL learners say that they would speak highly of their provider without
[image:37.595.110.493.86.304.2]being asked (38 per cent), while a slightly higher proportion would speak highly if asked (42 per cent). Just four per cent would be critical of their provider (Figure 30).
Figure 30: Advocating the provider
6
Q Which of these statements best describes the way you would speak of . . . (college/provider) in their capacity as a trainin g provider?
38%
42%
14%
3%
1%
2%
I would speak highly of them without being asked
I would speak highly of them if somebody asked me about them I would be neutral about them
I would be critical of them if somebody asked me about them
I would be critical of them without being asked
Don’t know
Base: 2,000 PCDL learners, waves 15, 16 and 17, 2009.
Figure 31: Trends in advocating the provider
7
2007
38
43
42
36
14
14 4 1
1 2
1 3 2009
Q Which of these statements best describes the way you would speak of . . . (college/provider) in their capacity as a trainin g provider?
% I would speak highly of them without being asked
% I would be neutral about them % I would
speak highly of them if somebody asked me about them
% I would be critical of them if somebody asked me about them
% I would be critical of them without being asked
% Don’t know
Base: 2,000 PCDL learners aged 16+ for waves 15, 16 and 17, 200 9; 3,821 learners for waves 13 and 14, 2007.
Performance on key drivers
Key Driver Analysis (KDA) was not conducted for PCDL learners because the data for this group can not be weighted due to a lack of reliable population profile. Therefore, this chapter examines PCDL learners’ ratings for the key drivers that were identified by the FE learners’ KDA (see Table 4 for a summary of ratings). Figures in the table show either the percentage rating each item positively or the mean score out of 10 (a higher score indicating a more positive rating).
Table 4: Performance on key drivers – summary
(Base varies by question) PCDL
Overall assessment
Learning programme is meeting my needs 90%
Experience was better than expected 34%
Course gives me the experience/qualification I wanted/needed 26%
Support
Good support provided on course 88%
Staff helpful in first few weeks 91%
Tutors/teachers
Satisfied with quality 93%
Make subject interesting/ enjoyable (mean) 8.7
Tutors set clear target/ goals (mean) 8.1
Tutors mange the group well (mean) 8.5
Understand learner(s) and how they like to learn (mean) 8.3
Course content
A good course/learned a lot/enjoyed it/up to expectations 38%
Informed about course content 92%
Career
Good advice on next steps 56%
Agree that course will help move forward in career 31%
Relationship
Provider good at listening to views 65%
Provider good at acting on views 54%
Tutors relate to learner(s) as a person (mean) 8.7
Staff good at showing respect 96%
Quality of teaching
As indicated above, learners express high levels of satisfaction with the quality of teaching on
their course and this is an important driver of overall satisfaction. This section focuses on
specific aspects of teaching.
As with other aspects of teaching, a high rating is given for managing the group of learners (8.53).
Decline in the proportion extremely satisfied overall and with quality of
teaching
While overall satisfaction level has remained similar to that in the 2007 NLSS, there has been a
significant decline in the proportion of PCDL learners who are extremely satisfied (a decline of
17 percentage points). There has also been a small decrease in the proportion extremely
satisfied with the quality of teaching (by three percentage points), as shown in Figure 32. These declines mirror the decline in unprompted advocacy, highlighted in the previous section.
Figure 32: Percentages of learners extremely satisfied with the learning
experience/quality of teaching
14
20%
35% 37%
38%
Q And now taking all the issues we have discussed into account, how satisfied are you with your current learning experience at … Q Overall, how satisfied or dissatisfied are you with the quality of
teaching/training at…
2007 2009
% extremely satisfied
Base: 2,000 PDCL learners aged 16+, 2009; and 3,821, 2007. Learning experience
Quality of teaching
2007 2009
These findings also need to be seen in the context of the high levels of satisfaction overall, and in the stable trends in the proportion who are satisfied.
Needs and expectations
A new question was included in the 2009 survey to better understand learners’ expectations. Over three-quarters of learners feel that their expectations have at least been met including a
third saying the course exceeded their expectations (34 per cent). However, 16 per cent
admitted to not knowing what to expect (Figure 33).
Learners undertaking qualifications at Level 4 or higher are more likely than average to say that
the course met their expectations (55 per cent), while early leavers, unsurprisingly, are most
[image:42.595.117.486.156.382.2]likely to say that the course wasworse than expected (27 per cent).
Figure 33: Learner expectations
16 % Worse than I expected
% I didn ’t know what to expect % Don ’t know
% Better than I expected % Similar to what I expected
Q Overall, would you say that your experience with your course/ training is better than you expected, similar to what you expected, worse than you expected, or did you not know what to expect?
34%
44% 6%
16% *%
Base: 2,000 PCDL learners aged 16+ for waves 15, 16 and 17, 2009
Nine in ten PCDL learners (90 per cent) say that their learning programme met their needs, with two thirds (64 per cent) expressing strong agreement (Figure 34). These findings are in line with 2007.
Figure 34: Meeting learners’ needs
17 64
64
26
26 3
2 4 31 4 31
Q Can you tell me how strongly you agree or disagree with the following statement?
“My learning programme is meeting my needs”.
2007 2009
% Strongly agree
% Neither/nor % Tend to
agree
% Tend to disagree
% Strongly disagree
[image:42.595.104.457.476.681.2]Information, advice and support
Over four in five learners (84 per cent) do not feel there was any support or help they needed that they did not receive, while 15 per cent disagree (Figure 35). Learners undertaking qualifications at Level 3 or higher are more likely to say they needed additional support or help (22 per cent), as are learners with a learning difficulty and/or disability (23 per cent).
Figure 35: Any support that would have helped?
19 Base: 1,868 PCDL learners aged 16+ who did not leave the course early for waves 15, 16 and 17, 2009
% No
% Don’ t know % Yes
Q Is there any support that would have helped / help you with your course / training that you did not receive / currently do not get?
15%
84%
Financial support and support from, and time with, tutors and teachers were most commonly cited by learners wanting additional help or support.
Figure 36: What support would have helped?
18%
16%
14%
11%
6%
5%
Top mentions (5%+)
Q What support would help/have helped you?
Support from assessor/tutor
Base: 286 PCDL learners (excluding early leavers) aged 16+ who s ay more support would have helped them for waves 15, Time with/access to tutor
Financial support
Better teaching/work materials
Information in advance about the amount/ type of work involved
reported problems are balancing course and home commitments (14 per cent), maintaining personal motivation (12 per cent), and keeping up with the standard of work required (10 per cent).
Figure 37: Problems encountered during the course
21
Q Since you started the course have you had any problems with any of the following?
14%
12%
10%
9%
6%
5%
15%
16%
14%
10%
7%
6%
2009 2007
Managing to keep up with the standard of work required
Base: 655 PCDL learners aged 16+ all wave 16, 2009; 1,907, 2007.
Maintaining your personal motivation Managing to fit course commitments in with other commitments at home
Managing to fit course commitments in with other commitments at work
Dealing with money pressures
Travel to college/training centre
Top mentions in 2009
There has, however, been a decline in the percentage of learners experiencing problems maintaining personal motivation (down to 12 per cent from 16 per cent) and keeping up with the standard of work required (down to 10 per cent from 14 per cent).
With regard to how well PCDL learners perceive their provider to support learners with learning difficulties and/or disabilities, only a minority are able to offer an opinion: 44 per cent rate their provider as good and one per cent bad (Figure 38). One in five say that this doesn’t apply (22 per cent) and three in ten (31 per cent) are unable to comment.
Among those with learning or other disabilities, the proportion rating their provider as good on this measure increases to 61 per cent.4
Figure 38: Provider support for learners with learning difficulties and/or disabilities
and needs related to religion/faith/beliefs
22
% Not good but not bad
27
14
16
16 2
22
38
31
29 21*
% Bad % Very
good % Good
Q And for each of the following aspects of your learning
experience, please tell me how good or bad each of them is.
How well . . . (provider) supports learners with learning difficulties or disabilities
How good is the support provided for any particular needs relating to your religion, faith or beliefs
% Very Bad
Base: 655 PDCL learners aged 16+, all in wave 16, 2009
% Does
not apply % Don’tknow
The majority of learners (85 per cent) say that the information they were given when they were choosing their course was good. Only 2 per cent think that they were given bad information (Figure 39).
Figure 39: Information given when choosing course
1 Base: 686 PCDL learners aged 16+ on wave 15 in 2009
% Not good but not bad % Bad
% Very bad % Very good % Good
Q How good was the information you were given when you were choosing your course/learning/training programme? Was it…
40%
45% 9%
2% 1%
3%
% This does not apply
course are more likely than average to say they felt well informed about how to access financial support (67 per cent compared with 44 per cent overall).
Figure 40: Information given upon enrolment
25 87 73 71 48 44 43 37 10 12 14 8 21 10 21 2 10 10 33 24 33 29 1 11 11 13 14
% Not very/at all well informed % Very/Quite well
informed
Q Now I would like to ask you a few questions about how informed you felt about the course/ training at the time you signed up for it.
Base: 686 PCDL learners aged 16+, all wave 15, 2009
Types and timing of exams and/or assessments
% Not
applicable % Don’t know
Content of the course – topics covered
Amount of work expected of you in your own time
How the course/training would help you gain skills to use in a job The standard of work expected of you
How to access financial support whilst learning/training
Overall pass/success rate for learners
6 5
The vast majority of learners (92 per cent) say that they felt well informed about the content of their course after their induction. This is in line with the findings from 2007 (91 per cent).
Figure 41: Information about course content
25 % Not very
well informed 68 68 25 24 32 2 4 % Not at all well informed % Very well
informed % Quite wellinformed
Q Please say whether you felt very well informed, quite well infor med, not very well informed or not at all informed after induction?
2007
Base: 655 PCDL learners aged 16+ all wave 16, 2009; 10,593 in 2007.
“The content of the course, what subjects you would cover ”
Personalisation, leaver involvement and provider responsiveness
[image:47.595.113.452.197.403.2]Learners are extremely positive about the respect shown to them by staff, with almost all saying it was good (96 per cent) including 74 per cent rating it asverygood (74 per cent).
Figure 42: Respect shown by staff to learners
28
Q Please tell me how good or bad is the respect staff show to you/respect training staff show to you
Base: 2,000 PCDL learners aged 16+ for waves 15, 16 and 17, 2009. % Not good but not bad
% Bad % Very bad % Very good % Good
74% 23%
2% 1%
% This does not apply/Don’t know
Two thirds (65 per cent) of PCDL learners say that their learning provider was good at listening to the views of learners, while 5 per cent disagree (Figure 43). Over half say that providers are good at acting on their views (54 per cent).
PCDL learners undertaking Level 2 or below and learners with learning difficulties and/or disabilities are most likely to rate their provider positively on both aspects.
Figure 43: Listening to, and acting on learners’ views
25%
29% 4%
1% 1%
30% 34%
9% 4% 1%
21%
Q How good is the college/learning provider at listening to the views of learners?
% Not good but not
bad % Bad
% Very good % Good % Very bad
Q How good is the college/learning provider at acting on those views?
[image:47.595.104.477.561.767.2]