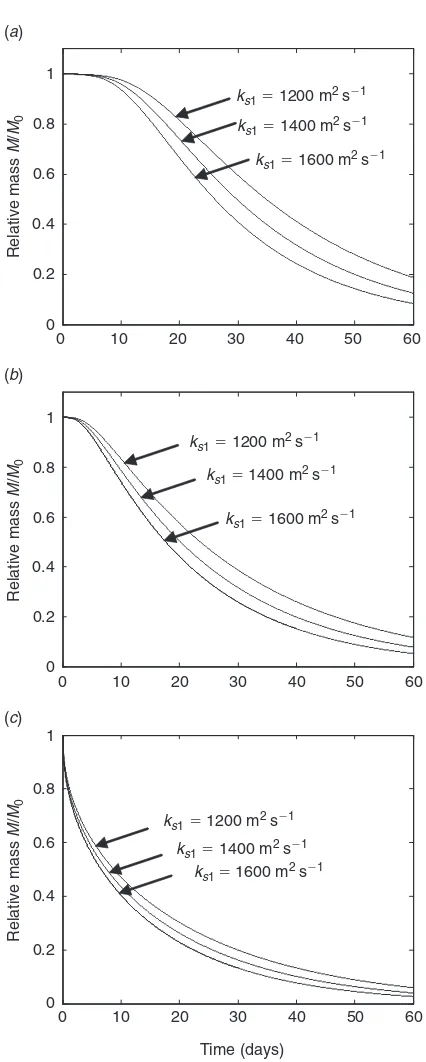
Flushing time of solutes and pollutants in the central Great Barrier Reef lagoon, Australia
Full text
Figure


Related documents
Table-2: Effect of Deglycyrrhinated licorice (DGL) on time taken to reach reward chamber (TRC) by rats using Hebb-William
In this paper, we report that the severe cassava mosaic disease associated with synergism between the Cameroon strain of ACMV (ACMV-[CM]) and East African cassava mosaic Cam-
Multiple Indian Researchers (Albin Mathew, Sabitha Nayak, 2010; Vandana K 2012) conducted a randomized control study to assess the effectiveness of ambulation versus birthing
hangs, der auch fUr ein Fachstudium oder filr eine qualifizierte Berufsausbildung eine unabdingbare Voraussetzung darstellt.. Die folgenden Hinweise sollen den Lesern eine
Keywords: Process improvement frameworks, IT Infrastructure Library, ITIL, Control objectives for information and related technology, CobiT, Capability Maturity Model
These results corre- lated with the in vitro binding assays, suggesting that while PCBP2 could interact with stem-loop IV RNA to form an RNP complex that was necessary to
As illustrated in Fig. 1 a, b, qRT-PCR results demonstrated that miR-22 expression was dramatically lower and sirt1 mRNA was markedly higher in breast cancer cell lines MCF-7 and


