International Journal of Innovative Technology and Exploring Engineering (IJITEE) ISSN: 2278-3075, Volume-8 Issue-12, October, 2019
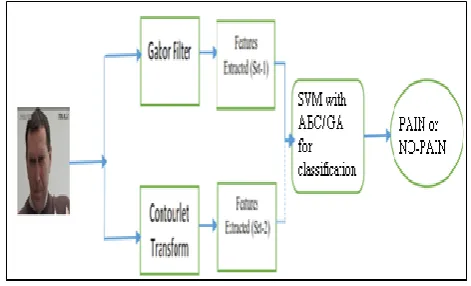
Abstract—This paper highlights automatic pain expression recognition from facial images of pain. This technique is frequently used in healthcare applications. The research detects the pain expression by an effective recognition method. It is based on the concepts of fusion of contourlet transform with Gabor transform for feature extraction, and classification of expressions by using SVM. The ABC algorithm and GA is implemented for optimizing SVM parameters. In order to authenticate the precision and stoutness of the system, a number of experiments have been done on two databases namely UNBC shoulder pain database and IFD-CEERI database. It's provided throughout the simulation techniques. The suggested strategy is actually effective in recognition of pain expression in terms of accuracy.
Keywords: ABC-SVM, GA-SVM, Face detection, Contourlet transform, Pain detection, Gabor filter
I. INTRODUCTION
The automated recognition of facial expresion remains as one of the difficult task in the area of highly effective computing hitherto. Certainly, facial expression [1-3] is referred as the largely important, instinctive, and instantaneous method accepted by humans to communicate, express and exchange intentions, emotions, and thoughts.The physical or mental sickness of a person is best expressed in terminology of pain expression.It's extremely hard to create a reliable assessment of pain and after that organize the same in a clinical environment. Among the most broadly used methods is actually patient self report to measure up pain. The reason: it's ideal. It neither calls for switching to complex technology, neither does it necessitate any outstanding skills. Nevertheless, self report is actually self limiting and can't be used on substantial set of populations, like young children that are young, people with limited mental capabilities, patients facing issues in communication and speech, and those that need assisted breathing. Numerous researchers [4,5] have attempted in the past to deal with these shortcomings and attain a continuous unbiased assessment of pain using investigative approaches. Nevertheless, the above mentioned procedures have mostly been dragged down owing to the point that, frequently they're not found congruent with alternative verifications of pain, besides being extremely invasive and constricting to the patient.
Revised Manuscript Received on August 05, 2019.
A.K. Saini,Department of Electronics & Communication Engineering, The ICFAI University, Jaipur, Rajasthan, India.
AtanenduSekharMandal,CSIR-Central Electronics Engineering Research Institute, Pilani, Jhunjhunu, Rajasthan, India
R.K. Sharma, Department of Electronics & Communication Engineering, NIT, Kurukshetra, Haryana, India
Alternatively, a possible approach can be using facial actions to code pain, nearly equivalent to the “faces of pain” approach. Many features have been drawn from faces such as FACS [6-8], PCA [9, 10], AAM model [11, 12] and Gabor wavelet. Today, Countless methods have been applied to recognize pain. Majority of the prevalent automated facial appearance detection techniques largely rely on two important measures: facial characteristic withdrawal and categorization. However, the categorization result mainly depends on facial characteristic removal techniques, which should reflect human insight about images.
This work has proposed two new hybrid facial expression recognition approaches. These are the fusion of contourlet (CT) and Gabor transformation for feature extraction and classification of pain by ABC-SVM [13, 14] and GA-SVM [15]. Minh N. Dow and Wetterly [16] invented the contourlet transform, a 2-dimensional transformation method for image representation. The CT is stimulated by the human visual method and the Curvelet make over, which can take into custody different stretched shapes and smoothness of the contour of images in different directions. The SVM kernel- parameter optimization has been done using ABC [18] and GA separately to improve the accuracy of recognition. In order to recognize pain expressions of facial images taken from the various expression data base, the anticipated concept is employed to get precise and meaningful results.
The organization of the paper is as follows: Section 2 consists of brief discussion about the CT and Gabor transform. The section 3 describes with the proposed method and Section 4 represents the experimental result. Section 5 represents the brief conclusion of the research.
II. CONTOURLET AND GABOR TRANSFORM 2.1 Contourlet Transform
Do MN and Vetterli M. Contourlets, [17] introduced CT a directional multi resolution image representation program that has anisotropy and directionality, by virtue of its capability to represent smooth contours in a number of directions of an impression. In this particular channel bank (Figure 1), initially, the Laplacian Pyramid (LP) can be put to use to determine the point dissection of the picture succeeding the directional filter bank (DFB) in straight structures. In order to add anomalies, the above program comes about an image development which utilizes essential
A Hybrid Pain Detection Technique using SVM
Parameter Optimization and Contourlet-Gabor
Transform Feature Fusion
Transform Feature Fusion
[image:2.595.310.554.51.231.2]components as form servings, and appropriately it's termed as contourlet transform.
Figure 1: The contourlet filter bank
In the following part, we are going to discuss Multi resolution analysis which is even more categorised into the following categories:
2.1.1 Multi-scale
This refers to a multi-resolution analysis for the LP, like the one for wavelets. It's assumed that orthogonal screens had been used for the LP in the contourlet filter bank with down sampling by two in each dimension (which results in
𝑁 = 𝑑𝑖𝑎𝑔𝑜𝑛𝑎𝑙𝑚𝑎𝑡𝑟𝑖𝑥 (2, 2) = 2 0
0 2 as appeared in
Figure2).
Under particular regularity circumstances, unique scaling function𝜙(𝑡) ∈ 𝑳2(𝑹2 satisfy the equation (1):
√2∅(𝑡) = 2 n∈z2g n ∅(2t − n) (1)
For the low-pass synthesis filter Q, the impulse response is 𝑞[𝑛]. Let
∅𝑖,𝑛 = 2−𝑖∅ 𝑡−2𝑖𝑛
2𝑖 , 𝑖 ∈ 𝑍, 𝑛 ∈ 𝑍
2 (2)
At that point the family {∅𝑖,𝑛}𝑛𝜖 𝑍2 is an ortho-normal cause for an approximation sub-space 𝑈𝑖at the range2𝑖. Furthermore, {𝑈𝑖}𝑖𝜖𝑍 provides a preparation of multi resolution established subspaces where. . 𝑈2, ⊂ 𝑈1⊂ 𝑈0,⊂
𝑈−1⊂ 𝑈−2… where 𝑈𝑖is linked with a uniform grid of intervals2𝑖× 2𝑖, through that the image approximation will be completed at a scale of2𝑖. Therefore, the difference images exists in a sub-space 𝑋𝑖 which is the orthogonal counterpart of 𝑈𝑖in𝑈𝑖−1, or𝑈𝑖−1 = 𝑈𝑖⊕ 𝑋𝑖
Figure 2:Laplacian Pyramid Method
It is understood [framing pyramids] that𝑏[𝑛]with 𝑎[𝑛]in Figure2 begins from a separate filter bank channel with the
similar sampling
matrix𝑁 = 𝑑𝑖𝑎𝑔𝑜𝑛𝑎𝑙𝑚𝑎𝑡𝑟𝑖𝑥 (2,2).ᴪ(𝑗 )(𝑡) is described as below:
ᴪ(𝑗 ) 𝑡 = 2 𝑒
𝑗 𝑛 ∅(2𝑡 − 𝑛)
𝑛∈𝑍2 (3) The impulse reaction of the high pass synthesis filter
𝐸𝑗(Z) is ej[n].Now ᴪ(𝑗 ) 𝑡 in eq.(3),would be ᴪ𝑖,𝑛 𝑗 𝑡 =
2−𝑖ᴪ 𝑗 𝑡−2𝑖𝑛
𝑖 , 𝑖𝜖𝑍, 𝑛𝜖𝑍
2. Subsequently, for scale2𝑖, {
ᴪ𝑖,𝑛 𝑗 }
0
j
3
,𝑛𝜖𝑍2 is rigid frame for 𝑊𝑖.For all thescales, {{ᴪ𝑖,𝑛 𝑗 }𝑖𝜖𝑍,,
0
j
3
,𝑛𝜖𝑍2is a rigid frame for𝐿2(𝑅2). In the above mentioned cases, the frame bounds are nearby to1. As 𝑊𝑖 is generated by four kernel functions equivalent to multi-wavelets), commonly it is not a shift-invariant sub-space. However, a shift-shift-invariant subspace is
simulated by converting 𝜇𝑖,2𝑛+𝑓 𝑡 = ᴪ𝑖,𝑛
𝑗 𝑡 , 0 ≤ 𝑗 ≤ 3; 𝑓 𝑖 are the coset symbolize for down sampling by 2 in each dimension, i.e. 𝑓0= (0,0)𝑇, 𝑓1= (1,0)𝑇, 𝑓2= (0,1)𝑇, 𝑓3=
(1,1)𝑇. Considering this characterization, the family
{𝜇𝑖,𝑛}𝑛𝜖 𝑍2 related to a uniform grid of intervals2𝑖−1×
2𝑖−1 on 𝑅2 enlarges a rigid frame for 𝑊 𝑖[17].
2.1.2Multidirectional
By taking into account of multi-rate identities, as in Figure 3, the equivalent directional analysis filters are
𝐸𝑘(𝑙), 0 ≤ 𝑘 ≤ 2𝑙and the directional synthesis filters a r e𝐷𝑘(𝑙), 0 ≤ 𝑘 ≤ 2𝑙. Subsequently, the linked entire
sampling matrix𝑆𝑘(𝑙)in the diagonal states is mentioned below.
𝑆𝑘 𝑖 = 𝑑𝑖𝑎𝑔𝑜𝑛𝑎𝑙(2
𝑙−1, 2), for 0 ≤ k < 2𝑙−1
𝑑𝑖𝑎𝑔𝑜𝑛𝑎𝑙(2, 2𝑙−1), for 2𝑙−1≤ k < 2𝑙 (4)
[image:2.595.55.288.70.307.2]International Journal of Innovative Technology and Exploring Engineering (IJITEE) ISSN: 2278-3075, Volume-8 Issue-12, October, 2019
[image:3.595.55.289.92.263.2]The design of the directional subspaces 𝑊𝑗 ,𝑘(𝑙)is produced by the usage of orthogonal filters in DFB executed on the difference image. The same has been shown in Figure 3:
Figure 3: The multi-channel DFB 2.2 The Gabor filter method
In view of the fact that, feature extractions for facial recognitions through Gabor filters [20,21] provides good results, Gabor waveform oriented feature extraction method is executed here. The relation of two dimensional Gabor kernels is mentioned below.
𝑊 𝑥, 𝑦, 𝜃, 𝜆, 𝜑, 𝜎, 𝛾 = 𝑒𝑥𝑝 −𝑥
′ 2+ 𝛾2𝑦′ 2
2𝜎2 cos 2𝜋
𝑥′
𝜆 + 𝜑
𝑥′ = 𝑥𝑐𝑜𝑠 θ + 𝑦 sin(𝜃)
𝑦′= 𝑥𝑠𝑖𝑛 θ + 𝑦 cos(𝜃) (6)
In the equation 6 represents the location of a light impulse with standard notations.
Let 𝒙 = [ 𝑥′ 𝑦′ ]𝑇 be the image coordinates.
Then, the impulse response of a Gabor filter g(x) is to be expressed as given below:
𝑔𝑚𝑛 𝑥 = 1 2𝜋𝑎𝑛𝑏𝑛𝑒
−12𝑥𝑇𝐴𝑚𝑛𝑥𝑒𝑗𝑘0𝑚𝑛𝑇 𝑥 (7)
Here, the matrix A represents the bandwidth and reference selection point of the filter.
𝐴𝑚𝑛 =
𝑐𝑜𝑠∅𝑚 −𝑠𝑖𝑛∅𝑚
𝑠𝑖𝑛∅𝑚 𝑐𝑜𝑠∅𝑚
𝑎𝑛−2 0
0 𝑏𝑛−2
𝑐𝑜𝑠∅𝑚 𝑠𝑖𝑛∅𝑚
−𝑠𝑖𝑛∅𝑚 𝑐𝑜𝑠∅𝑚
(8)
If the direction of modulation frequency vector remains akin to that of one of the envelopes axes, with
𝑘0𝑚𝑛 = 𝑘0𝑛
𝑐𝑜𝑠∅𝑚
𝑠𝑖𝑛∅𝑚
(9)
The transfer function G (k) of a Gabor filter is expressed by equation (10)
𝐺𝑚𝑛 𝑘 = 𝑒−1/2(𝑘−𝑘0𝑚𝑛) 𝑇(𝐴
𝑚𝑛 −1)𝑇(𝐾−𝐾
0𝑚𝑛) (10) where 𝑘 = [𝑘1 𝑘2] T is the spatial frequency. If the expression of equation of modulation frequencies are given by equation (11)
𝑘0𝑛 = 𝜋
2𝑛 +1; 𝑛 ∈ 0 … 𝑁 − 1 (11)
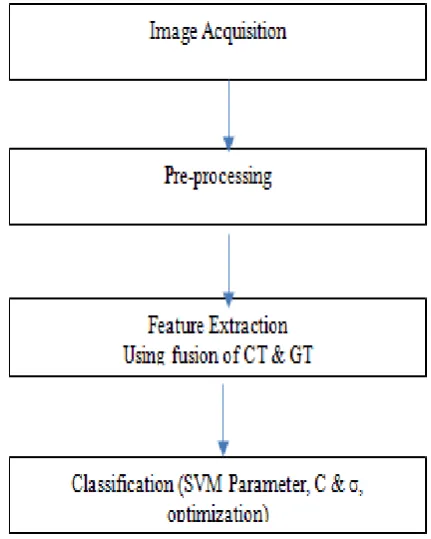
III. PROPOSED METHOD FOR PAIN RECOGNITION
The proposed technique has three key modules for pain expression recognition. They are:
face recognition and image normalisation
feature extraction and
Expression Classification
3.1 Face Detection and image normalisation:
It's important to point out that Viola Jones visage recognition algorithm was applied for the item recognition as it provides the competitive face detection rates in real time. After completion of face detection, the necessary component was extracted using the cropping of the picture, therefore removing undesired component of the facial skin.
3.2 Feature Extraction
In the proposed technique of ours, we've extracted 2 sets of characteristics from the pictures, Figure 4, by working with contourlet transform and Gabor Filter as mentioned in subsequent sections.
3.2.1 Feature Extraction using Gabor Filter
The very first set of options, Fg, from the pictures had been extracted making use of the Gabor filters as per eq.(6). We're doing block averaging. Gabor filter highlights edges just in a particular direction and majority of picture has very low intensity. Then when we average blocks, blocks with no edges remains almost identical, whereas blocks with edges change the typical to greater intensity and that highlights particular features. Those characteristics are actually selected for the classification. Total 512 features, set one, were selected from the specified picture for the different parameters of Gabor filter as per equation (6)
3.2.2 Feature Extraction using CT
For feature extraction, set 2, FCT, as denoted in Figure 3,
In the changed domain, each pre-processed image is decoposed using the Contourlet transform to a level of 4. The majority related texture data is divided because of iterated low pass filtering, hence the data is possessed within the directional sub-band of the scale. It has been measured that the picture is dissected into 21 directions at 1st level, 22 at the 2nd level, 23 at the 3rd level and 24 at the 4th level. Therefore, we attain 30 i.e. (21+22+23+24) directional sub bands for every image.
[image:3.595.313.549.524.667.2]Transform Feature Fusion
Four levels of contour transformation are used to transform each facial expression as LP and DFB with the image PKVA filter.
Levels of 4, 3, 2 and 1 are raised in reverse order. The pre-processed image is decomposed in 24 directions at 1st level, 23 at 2nd level, 22 at 3rd level and 21 at 4th level. Total quantity of 30 i.e. (24+23+22+21) directional sub-bands for each image are obtained. We extracted the set of features in FCT by calculating a 16 bin histogram for each sub-band. The total features 496 derived by means of CT are mentioned below (Figure 5):
FCT = [(24+23+22+21) x16 or (21+22+23+24) x 16] +[1x16];
with one feature for whole image = [(30 x 16) or (30 x 16)] +16 = 496
The features, Fg& FCT, were scaled down as mentioned
below:
𝐹𝑔 = (𝐹𝑔− 𝑚𝑖𝑛(𝐹𝑔)) ./ (𝑚𝑎𝑥(𝐹𝑔) − 𝑚𝑖𝑛(𝐹𝑔)) (12)
𝐹𝐶𝑇 = (𝐹𝐶𝑇− 𝑚𝑖𝑛(𝐹𝐶𝑇)) ./ (𝑚𝑎𝑥(𝐹𝐶𝑇) − 𝑚𝑖𝑛(𝐹𝐶𝑇)) (13) Fg& FCT are joined together as mentioned below:
The fusion function F= { Fg,FCT} (14)
The total features extracted from the images, F, using these two methods, provided into the SVM classifier to classify the pain reactions.
3.3Classification Techniques
After getting the features from the fusion of CT and GT, the classification techniques applied using SVM. Different kernels have been used and results were calculated with and without optimization of SVM parameters as mentioned in figure 5.
3.3.1 SVM without optimization
Support vector machines [19] are binary classifiers and has good ability to control and implement on high dimensional data and are wide-ranging taken into application for feature classification, believes a training data set {(𝑥1, 𝑦1), (𝑥2, 𝑦2), . . . , (𝑥𝑛, 𝑦𝑛)}, where 𝑥𝑖 are the vectorized training images and 𝑦𝑖 ∈ {−1, +1} are the labels to which each image can be allocated to.
SVM tries to create a hyper plane, wTz − b = 0 which best divides the data points (by more difference) in which w is
[image:4.595.317.533.272.542.2]usual to the hyper plane and b is the prejudice and 𝑏 | 𝑤 |is the vertical distance between the hyper plane to the margin .The highest margin hyper-plane are traced by algorithm to calculate linearly divisible types. This will be done by minimizing the objective function of equation (15).
F(x) = 1 2w
Tx (15)
yi(wT xi+ b) ≥ 1 ∀i
For non-linear SVMs, sticking to the selected kernels, the Lagrangian is made the most of as shown below:
𝑚𝑎𝑥𝑎𝐿𝐷𝑢𝑎𝑙 = 𝑎𝑖−
1 2
𝑙
𝑖=1
𝑎𝑖𝑎𝑗𝑦𝑖𝑦𝑗 𝑙
𝑖,𝑗 =1
𝑥𝑖. 𝑥𝑗
Subject to0 ≤ 𝑎𝑗 ≤ 𝐶
𝑎𝐽 𝑗𝑦𝑗 = 0
(16)
To calculate the optimal hyper-plane, a dual Lagrangian𝐿𝐷𝑢𝑎𝑙 should be maximized as per the nonnegative αi mentioned as per the given parameters. To
calculate the optimal hyper-plane, a dual Lagrangian The penalty factor 𝐶is calculated by the user.
The Polynomial kernel is:
𝑘 𝑥𝑖, 𝑥𝑗 = 1 + 𝑥𝑖′𝑥𝑗 𝑃
(17)
Gaussian (RBF) kernel: k (𝑥𝑖 ,𝑥𝑗) = exp
𝑥𝑖−𝑥𝑗 2
2𝜎2 (18)
Subject to 𝛼𝑖 ≥ 0,𝑖 = 1, … … 𝑖,
𝛼𝑖 𝐼
𝑖=1 𝑦𝑖 = 0, (19)
In Eq. (18), σ2
denotes the variance of the Gaussian kernel.
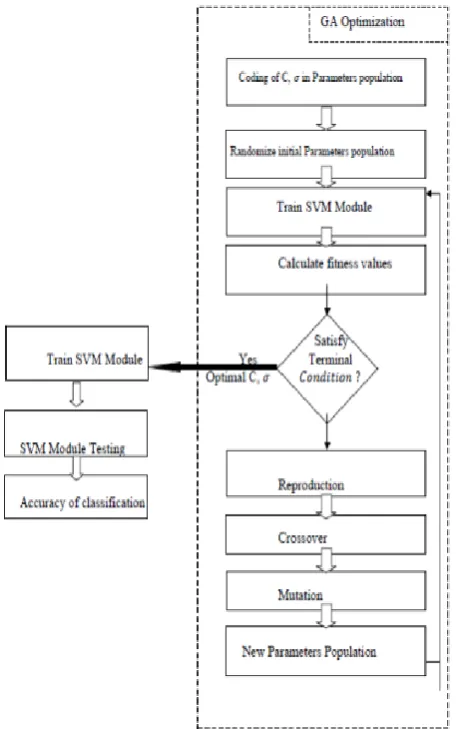
3.3.2 Parameter Optimization of SVM using ABC and GA SVM parameters can be optimized using various algorithms for classification of expressions. Here in this paper, we have used GA-SVM and ABC method to optimize the parameters as mentioned in the figure 5. We have considered linear, Gaussian and polynomial kernel.
Figure 5: SVM parameter optimization A brief description about the optimization techniques, which we have used, is given below:
International Journal of Innovative Technology and Exploring Engineering (IJITEE) ISSN: 2278-3075, Volume-8 Issue-12, October, 2019
Figure 6: GA-SVM parameter optimization process B. In ABC algorithm [18], the following three groups of the colony of artificial bees are there::engaged bees, observers and scouts. The initial 50% of the colony comprises the engaged simulated bees and the next half incorporates the observers. When we take into consideration each and every food resource, the finding is that we have only one engaged bee. We may also say that the overall engaged bees are equivalent to the total number of food resources in the region of the hive. Those engaged bee whose food supply have been discarded by the bees, the same gets converted into a scout.
In ABC algorithm, the arrangement of a food resource depicts a probable explanation to the optimization issues and the elixir quantity of a food resource matches up to the worth (fitness) of the connected clarification. The figure of the engaged bees or the observer bees is equivalent to the number of resolutions in the populace. At the initial move, the ABC creates an indiscriminately strewn preliminary populace P (G ).
A simulated observer bee prefers a food resource relying on the probability value linked with that food resource, 𝑝𝑖, designed by the following expression (20):
𝑝𝑖 = 𝑓𝑖𝑡𝑖
𝑓𝑖𝑡𝑛 𝑆𝑁
𝑛 =1 (20)
Where 𝒇𝒊𝒕𝒊 is the suitability value of the answer i which is comparative to the elixir amount of the food resource in the situation i and SN is the number of food resources which is equivalent to the number of engaged bees (BN).
𝑣𝑖𝑗 = 𝑥𝑖𝑗 + ∅𝑖𝑗(𝑥𝑖𝑗 − 𝑥𝑘𝑗) (21) where, k Ɛ {1, 2,..., SN} and j Ɛ {1, 2,...,D} are arbitrarily selected indexes. However, k is evaluated arbitrarily, it has to be dissimilar from i. ∅𝑖𝑗 is an arbitrary number between [-1, 1]. It is in command of the creation of neighbour food resources roughly𝑥𝑖𝑗and symbolizes the relationship of two food locations optically by a bee.
Comprehensive Pseudo –code of the ABC algorithm is as follows:
1. Initializing the populace of answers 𝑥𝑖𝑗, i =
1……SN, j = 1…..D 2. Assess the populace 3. No of cycle = 1 4. Replicate
5. Create fresh explanation V I,j for the engaged bees
by means of (21) and assess them 6. Apply the greedy choice process
7. Work out the probability values P i,j for the
resolutions xi,j by (20)
8. Generate the fresh solutions V i,j for the observers
from the solutions xi,j selected on the basis of pi,j and
estimate them
9. Applying the greedy selection method
10. Establish the deserted solution for the scout, of exists, and substitute it with a fresh arbitrarily created solution x i,j [].
11. Learn by heart the paramount solution accomplished hitherto
12. Cycle = Cycle + 1
13. In anticipation of cycle = MCN
IV. DATABASE FOR THE VERIFICATION The proposed methodology is implemented on following two datasets:
Transform Feature Fusion
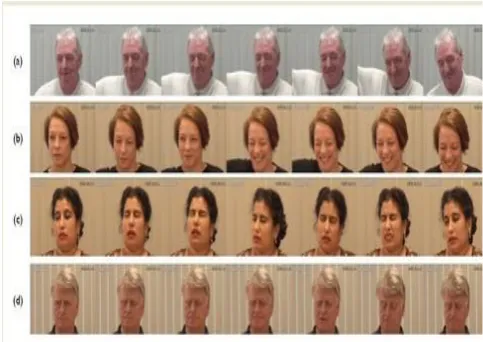
Figure 7 : Examples of some of sequences from the -McMaster Shoulder Pain Expression Archive Database
4.2 The Indian Face Database – CEERI (IFD-CEERI) has been built at the Perception and Cognition Engineering Lab in the IC Design Group of CEERI-Pilani. It has 259 persons (192 males and 67 females) in the age groups of 0-17, 18-29, 30-44, 45-64, and 65-90 years. The dimension of everypicture is 720 x576. For the verification of proposed algorithm, we have taken face images of pain from the database as shown in figure 8.
V. EXPERIMENTS AND RESULTS ANALYSIS Here, after the pre-processing, as per the equation (14), the collective features were implemented to SVM for classification and a comparison was created among the classification accuracy achieved from optimization of SVM parameters using ABC and GA (Table 1 & Table 2). The results reported clearly denote that the collective features are producing good classification accuracy with ABC-SVM as compared to GA-SVM. SVM used here, categorizes Objects in two groups, hence classification is done by One-v/s-One and One-v/s-All both the techniques, which trains classifiers to create a distinction of one expression from another. Various kernels of SVM have various forces on pain recognition rate. We implemented three SVM kernels namely linear, Polynomial and RBF kernels.
[image:6.595.58.295.348.446.2]The performance obtained through various kernels for shoulder pain database is tabulated in Table 1 for combined features, where CT levels used here are (4, 3, 2, 1) as we have better results for these levels [22]. There is an increase in accuracy of recognition when we have applied various parameter optimization techniques on SVM. Figure 9 shows a comparative analysis between various methods applied.
Figure 8: Examples of some of sequences from the -CEERI Expression Database
Table 1: Accuracy using SVM Classifier for levels (4, 3, 2, 1) with parameter optimization techniques (for UNBC shoulder pain database)
Expression
Recognition
Accuracy
(%)
Recognition Accuracy
(%)
Recognition Accuracy (%)
Linear Linear with GA
Linear with ABC
RBF RBF
with GA
RBF with ABC
Polynomi al
Polynomial with GA
Polynomial with ABC
Pain
97.62 97.81 97.94 95.52 96.43 96.54 97.28 97.35 97.48Non-Pain
99 99.23 99.35 100 100 100 100 100 100International Journal of Innovative Technology and Exploring Engineering (IJITEE) ISSN: 2278-3075, Volume-8 Issue-12, October, 2019
Figure 9: Comparison of accuracy achieved using various methods (UNBC Shoulder Pain Database) We have also applied the proposed method on
IFD-CEERI database also and there also we have achieved better
accuracy compared to other techniques as mentioned in table 2 and figure 10.
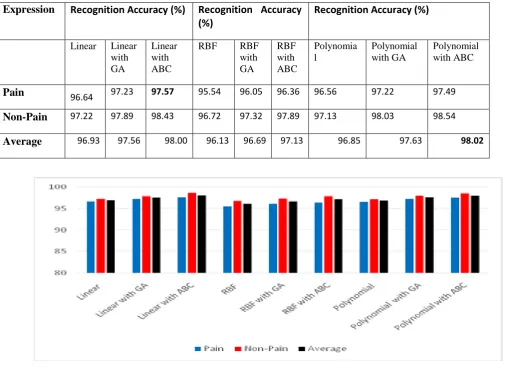
Table 2: Accuracy using SVM Classifier for levels (4, 3, 2, 1) with parameter optimization techniques (IFD-CEERI Database)
Figure 10: Comparison of accuracy achieved using various methods (IFD-CEERI Pain Database)
Expression
Recognition Accuracy (%)
Recognition Accuracy
(%)
Recognition Accuracy (%)
Linear Linear with GA
Linear with ABC
RBF RBF
with GA
RBF with ABC
Polynomia l
Polynomial with GA
Polynomial with ABC
Pain
96.64 97.23 97.57 95.54 96.05 96.36 96.56 97.22 97.49Non-Pain
97.22 97.89 98.43 96.72 97.32 97.89 97.13 98.03 98.54 [image:7.595.54.560.355.723.2]Transform Feature Fusion
We're getting much better outcomes by utilizing the suggested technique through the combined characteristics with polynomial kernel with ABC-SVM, which is also reported in Table 3 for shoulder pain database.
Table 3: Comparison of accuracy of our method with other methods
Method Average Recognition Rate
AAM and SVM [8] 82% accuracy
AAM, SVM [7] 79.66% accuracy
AAM, Log-normal filters and SVM[23]
73% accuracy
DCT, LBP, RVR [24] 92% accuracy
Gabor, PCA,SVM [9] 95.5%
Fusion of CT with GT [22] 98.64% Our Method, Fusion of CT
with GT with SVM parameter optimization
98.74%
To optimize C and σ, we have applied two algorithms namely, Genetic algorithm and Artificial Bee Colony, ABC, algorithm. Therefore, the primary goal of these implementations is to apply these new models to increase the classification accuracy of pain expression recognition. The results obtained from ABC-SVM model are even better than GA-SVM. There is an increase in accuracy as shown in the figure 9 and figure 10. Also the time taken by ABC-SVM is very less compared to GA-ABC-SVM to generate optimized values of SVM parameters.
VI. CONCLUSION
This research introduces a novel technique for pain detection. An unsupervised moment and histogram analysis are integrated in the compact altered field using the contourlet transform. The feature extraction using Gabor and contourlet filters are very fast, correct and extremely towering in terminology of appearance detection. The features extracted from the fusion of CT-GT used for the classification. The proposed GA-SVM and ABC-SVM models, with these combined features, can be automated to determine the optimal values of SVM parameters and exhibits increased classification accuracy in specified datasets. The proposed ABC-based approach has good classification accuracy compared to the Genetic algorithm. This implementation depicts experimental results with the different kernels. The result analysis in a comparative framework demonstrates the better functionality of the suggested strategy compared to other existing techniques.
VII. REFERENCES
1. A.Samal, P.A.Iyengar, “Automatic recognition and
analysis of human faces and facial expressions: a survey”, Pattern Recognition, Volume 25, Issue 1, January 1992, Pages 65-77
2. Leon J.M. Rothkrantz, MajaPantic, “ Automatic Analysis
of Facial Expressions: The State of the Art”, IEEE
Transactions on Pattern Analysis & Machine
Intelligence, December 2000, pp. 1424-1445, vol. 22
3. B. Fasel, JuergenLuettin, “Automatic facial expression
analysis: a survey, Recognition”, Volume, January 2003, Pages 259-275.
4. Littlewort, Bartlett, Lee, “Faces of Pain: Automated
Measurement of Spontaneous Facial Expressions of Genuine and Posed Pain”, ICMI’07, November 12–15, 2007.
5. K.D. Craig, K.M. Prkachin, R.V.E. Grunau, “The facial
expression of pain”, D.C. Turk (Ed.), Handbook of Pain Assessment (2nd ed.), Guilford, New York (2001)
6. P. Ekman, W.V. Friesen, “Facial Action Coding
System”, Consulting Psychologists Press, Palo Alto, CA (1978)
7. Lucey, P., Cohn, J., Prkachin, K., Solomon, P.,
Matthews, I.: Painful data: The UNBC-McMaster shoulder pain expression archive database. In: Int’l Conf. on Automatic Face & Gesture Recognition and Workshops, IEEE (2011) 57–64.
8. Ahmed Bilal Ashraf Simon Lucey Jeffrey F. Cohn,
Tsuhan Chen Zara Ambadar Kenneth M. Prkachin Patricia E. Solomon, “The Painful Face – Pain Expression Recognition Using Active Appearance Models”, Proceedings of the 9th international conference on Multimodal interfaces, pp : 9-14 , 2007.
9. SouravDey, RoyMrinal ,KantiBhowmik, PriyaSaha,
Anjan Kumar Ghosh, “An Approach for Automatic Pain
Detection through Facial Expression”, Procedia Computer Science, 84 ( 2016 ) 99 – 1
10. Le Hoang Thai, Nguyen Do Thai Nguyen and Tran Son.
2011. A Facial Expression Classification System Integrating Canny, Principal Component Analysis and Artificial Neural Network. International Journal of Machine Learning and Computing, Vol. 1, No. 4, October 2011.
11. L. Wang, R. Li, K. Wang, A novel automatic facial
expression recognition method based on aam, Journal of Computers, 9 (3) (2014), pp. 608-617
12. C.P. Sumathi1, T. Santhanam and M. Mahadevi. 2012.
Automatic Facial Expression Analysis A Survey.
International Journal of Computer Science &
Engineering Survey (IJCSES). Vol.3, No.6, December 2012.
13. Xiang-ming Gao,Shi-feng Yang, and San-bo Pan,
“Optimal Parameter Selection for Support Vector Machine Based on Artificial Bee Colony Algorithm: A Case Study of Grid-Connected PV System Power
Prediction”, Computational Intelligence and
Neuroscience
Volume 2017, 14 pages
14. Hala M. Alshamlan, Ghada H. Badr, and Yousef A.
Alohali , “ABC-SVM: Artificial Bee Colony and SVM Method for Microarray Gene Selection and Multi Class Cancer Classification”, International Journal of Machine Learning and Computing, Vol. 6, No. 3, June 2016
15. İlhanİlhan, Gülay Tezel, “A genetic algorithm–support
vector machine method with parameter optimization for
selecting the tag SNPs”, Journal of Biomedical
Informatics, Volume 46, Issue 2, April 2013, Pages
328-340
16. Do MN, Vetterli M., “The Contourlet Transform: An
Efficient Directional Multiresolution Image
Representation”,IEEE Transactions on Image Processing, Volume: 14, Issue: 12, Dec. 2005.
17. Do MN, Vetterli M. Contourlets, “A directional
International Journal of Innovative Technology and Exploring Engineering (IJITEE) ISSN: 2278-3075, Volume-8 Issue-12, October, 2019
18. D. Karaboga, “An Idea Based on Honey Bee Swarm for
Numerical Optimization, Technical Report-TR06”, Erciyes University, Engineering Faculty, Computer Engineering Department 2005
19. Vapnik, Vladimir N."Support-vector
networks" (PDF). Machine Learning. 20 (3): 273–
297,1995
20. JeemoniKalita and Karen Das., “ Recognition of Facial
Expression Using Eigenvector Based Distributed Features and Euclidean Distance Based Decision Making Technique”, (IJACSA) International Journal of Advanced Computer Science and Applications, Vol. 4, No. 2, 2013.
21. Lei Yuan, Forrest Sheng Bao, Guanming Lu,
“Recognition of Neonatal Facial Expressions of Acute Pain Using Boosted Gabor Features”, 20th IEEE International Conference on Tools with Artificial Intelligence, 2008.
22. A.K.Saini, AtanenduSekharMandal, R.K. Sharma, “A
Novel Approach for Pain Detection by Fusion of Contourlet and Gabor Transform Features”, Journal of Advanced Research in Dynamical Control Systems, issue: 10-Special Issue,2018,2308-2315
23. ZakiaHammal, Jeffrey F Cohn, “Automatic detection of
pain intensity”, Conference: Proceedings of the 14th
ACM international conference on Multimodal
interaction, October 2012
24. Sebastian Kaltwang, OgnjenRudovic, MajaPantic,
“Continuous Pain Intensity Estimation From Facial Expressions”, International Symposium on Visual Computing, July 2012
AUTHOR’S DETAIL
Mr. A K Saini is Associate Professor in the department of Electronics & Communication, ICFAI Tech School, The ICFAI University, Jaipur. He received his Master of Technology (M.Tech.) in ECE from MNIT, Jaipur in 2004 and BE from MBM Engineering College, Jodhpur. He is pursuing his PhD from NIT, Kurukshetra and he is in process of submission. He has several publications in national &international journals and conference proceedings to his credit. He has 16 years of research and teaching experience in the area of Computer Architecture, Computer Vision, and Electronics & Communication. Current research interests include Computer Vision and Digital VLSI Design.
Prof.R.K.Sharma, received his M.Tech in electronics and communication engineering and PhD degree in electronics and communication from Kurukshetra University Kurukshetra (through National Institute of Technology Kurukshetra), India in 1993 and 2007, respectively. Currently he is Professor with the Department of Electronics and Communication Engineering, NIT Kurukshetra, India. His main research interests are in the field of low power VLSI design, Voice profiling, Microprocessor and FPGA based systems.