Data set of Zuo and Oerlemans
[image:1.595.165.490.464.778.2](1997a)
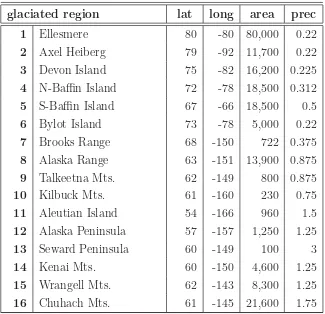
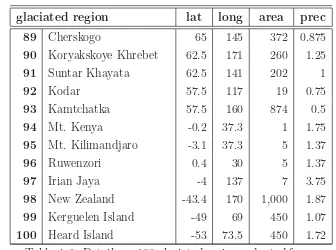
Table A.1 lists details of 100 glaciated regions adopted from Zuo and Oerlemans (1997a) and used in this thesis. In particular, latitude and longitude of the centred locations, the areas (in km2), and the annual precipitation rates (in m w.e. year−1) are given.
glaciated region lat long area prec
1 Ellesmere 80 -80 80,000 0.22
2 Axel Heiberg 79 -92 11,700 0.22
3 Devon Island 75 -82 16,200 0.225
4 N-Baffin Island 72 -78 18,500 0.312
5 S-Baffin Island 67 -66 18,500 0.5
6 Bylot Island 73 -78 5,000 0.22
7 Brooks Range 68 -150 722 0.375
8 Alaska Range 63 -151 13,900 0.875
9 Talkeetna Mts. 62 -149 800 0.875
10 Kilbuck Mts. 61 -160 230 0.75
11 Aleutian Island 54 -166 960 1.5
12 Alaska Peninsula 57 -157 1,250 1.25
13 Seward Peninsula 60 -149 100 3
14 Kenai Mts. 60 -150 4,600 1.25
15 Wrangell Mts. 62 -143 8,300 1.25
glaciated region lat long area prec
17 St. Elias Mts. 61 -141 11,800 1.5
18 Coast Mts. 59 -134 10,500 2.5
19 Stikine River 57 -131 5,070 1.5
20 Yukon Territory 61 -140 10,000 1.5
21 Selwyn Mts. 62.5 -128 600 0.75
22 Rocky Mts. 58 -125 300 0.75
23 Coast Mts. 51 -125 13,500 2.5
24 Olympic Mts. 48 -123 46 4
25 N-Cascades 48.3 -121 266 2.5
26 Mt. Rainer / Adams 46 -122 63 4
27 Rocky Mts. 52 -118 3,000 1
28 Selkirk Mts. 51 -117 1,000 1.5
29 Rocky Mts. 44 -109 74 0.562
30 Sierra Nevada 37 -118 51 1
31 Mexico 19 -97 4 2.5
32 Mexico 19 -98.5 4 1.25
33 Mexico 19 -100 3 1.75
34 S.Nev de Merida 8.5 -71 3 1.5
35 Nev. del Huila 3 -76 19 1.5
36 Nev. del Ruzy / Tolima 4.7 -75.4 24 3
37 Nev. del Cocuy 6.5 -72.3 39 1.25
38 S. Nev de Santa Marta 10.8 -73.6 19 4
39 Ecuador -0.8 -78.2 111 3.5
40 N. Cordilleras -10 -77 873 1.5
41 N. Cordilleras -12 -75.5 258 1
42 S. Cordilleras -15 -73 649 0.813
43 Cordilleras Oriental -15.6 -68 51 1.12
44 Andes, 30-16S -23 -67.5 2,800 0.375
45 Chili -34 -70 743 1.5
46 Mendoza / San Juan -33 -70 1,170 1.5
47 Neuquen -37 -70 156 3.5
48 Chili -43 -72 3,570 3
49 N. Patagonia -47 -73.5 5,720 2
50 S. Patagonia -50 -73.5 16,900 2
51 Tierra del Fuego -54.5 -70.5 2,700 2
53 Vatnajokull 65.5 -17 8,300 4
54 Langjokull 65 -20 953 4
55 Hofsjokull 65.5 -19 925 2.5
56 Myrdalsjokull 63.5 -19 600 4
57 Drangajokull 66 -22 160 2.5
58 Svalbard 79 18 36,600 0.375
59 Franz Josef Land 81 57 13,700 0.312
60 Novaya Zemlya 75 57 23,600 0.5
61 Severnaya Zemlya 79 98 18,300 0.25
62 N. Scandinavia 67.5 17 1,080 2.5
63 S. Norway 61.7 7.4 1,630 4
64 Alps 46 7.5 2,910 2
65 Pyrenees 42.5 0 12 2
66 Bol’shoy Kavkaz 42.5 44 1,340 1.5
67 Turkey 38 43.5 24 1.25
68 Iran 38 46.5 20 0.75
69 Severnity Ural 66 61 800 1
70 Ili + Chu 43 77.5 2,300 1
71 Syrdar’ya / Amudar’ya 38 71 10,700 1
72 Tarim Ba 42 77.5 320 0.75
73 Pakistan/India 36 76 40,000 1.75
74 Nanga Parbat 35.3 74.6 301 1.25
75 Chitral 36.4 72.4 1,350 2
76 Himalaya / Nepal 28 87 12,700 0.75
77 Bhutan 28 90 1,340 0.75
78 Niangtingtanggula 30 89 7,540 1
79 Qilian Shan 39 99 2,380 0.75
80 Altai Shan 47 91 293 0.375
81 Kunlun Shan 36 87 11,600 0.25
82 Tyan Shan 42 80 9,550 1
83 Tanggula Shan 33 91 2,080 0.75
84 Hengduan Shan 28 99 1,460 1
85 Gangdisi Shan 31 82 2,190 0.625
86 Dzungarsky Alatau 45 80 910 1
87 Qiangtang Plateau 34 87 3,190 0.25
glaciated region lat long area prec
89 Cherskogo 65 145 372 0.875
90 Koryakskoye Khrebet 62.5 171 260 1.25
91 Suntar Khayata 62.5 141 202 1
92 Kodar 57.5 117 19 0.75
93 Kamtchatka 57.5 160 874 0.5
94 Mt. Kenya -0.2 37.3 1 1.75
95 Mt. Kilimandjaro -3.1 37.3 5 1.37
96 Ruwenzori 0.4 30 5 1.37
97 Irian Jaya -4 137 7 3.75
98 New Zealand -43.4 170 1,000 1.87
99 Kerguelen Island -49 69 450 1.07
[image:4.595.99.435.105.355.2]100 Heard Island -53 73.5 450 1.72
Supporting material for Chapter 2
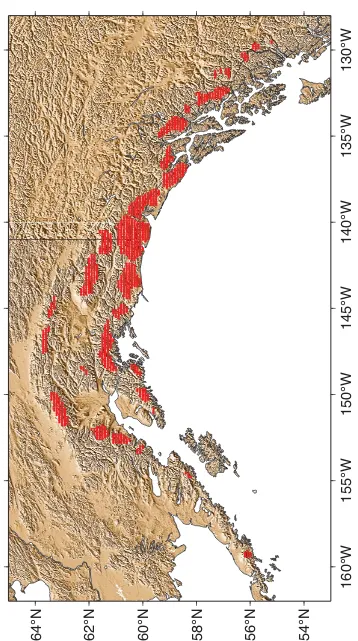
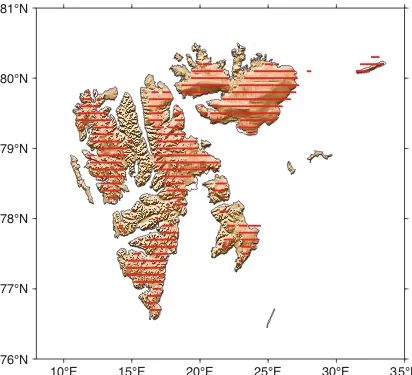
Topographic maps of Alaska and Svalbard
54°N
56°N
58°N
60°N
62°N
64°N
160°W
155°W
150°W
145°W
140°W
135°W
[image:6.595.90.448.108.749.2]130°W
76°N
77°N
78°N
79°N
80°N
81°N
[image:7.595.119.531.243.618.2]10°E
15°E
20°E
25°E
30°E
35°E
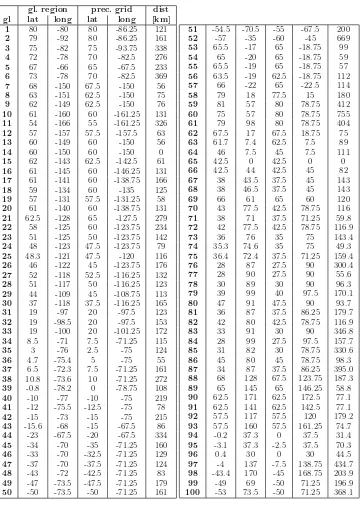
Location of glaciated region and precipitation data
gl. region prec. grid dist gl lat long lat long [km]
1 80 -80 80 -86.25 121
2 79 -92 80 -86.25 161
3 75 -82 75 -93.75 338
4 72 -78 70 -82.5 276
5 67 -66 65 -67.5 233
6 73 -78 70 -82.5 369
7 68 -150 67.5 -150 56 8 63 -151 62.5 -150 75 9 62 -149 62.5 -150 76 10 61 -160 60 -161.25 131 11 54 -166 55 -161.25 326 12 57 -157 57.5 -157.5 63 13 60 -149 60 -150 56 14 60 -150 60 -150 0 15 62 -143 62.5 -142.5 61 16 61 -145 60 -146.25 131 17 61 -141 60 -138.75 166 18 59 -134 60 -135 125 19 57 -131 57.5 -131.25 58 20 61 -140 60 -138.75 131 21 62.5 -128 65 -127.5 279 22 58 -125 60 -123.75 234 23 51 -125 50 -123.75 142 24 48 -123 47.5 -123.75 79 25 48.3 -121 47.5 -120 116 26 46 -122 45 -123.75 176 27 52 -118 52.5 -116.25 132 28 51 -117 50 -116.25 123 29 44 -109 45 -108.75 113 30 37 -118 37.5 -116.25 165
31 19 -97 20 -97.5 123
32 19 -98.5 20 -97.5 153 33 19 -100 20 -101.25 172 34 8.5 -71 7.5 -71.25 115 35 3 -76 2.5 -75 124
36 4.7 -75.4 5 -75 55
37 6.5 -72.3 7.5 -71.25 161 38 10.8 -73.6 10 -71.25 272 39 -0.8 -78.2 0 -78.75 108 40 -10 -77 -10 -75 219 41 -12 -75.5 -12.5 -75 78 42 -15 -73 -15 -75 215 43 -15.6 -68 -15 -67.5 86 44 -23 -67.5 -20 -67.5 334 45 -34 -70 -35 -71.25 160 46 -33 -70 -32.5 -71.25 129 47 -37 -70 -37.5 -71.25 124 48 -43 -72 -42.5 -71.25 83 49 -47 -73.5 -47.5 -71.25 179 50 -50 -73.5 -50 -71.25 161
51 -54.5 -70.5 -55 -67.5 200 52 -57 -35 -60 -45 669 53 65.5 -17 65 -18.75 99
54 65 -20 65 -18.75 59
55 65.5 -19 65 -18.75 57 56 63.5 -19 62.5 -18.75 112
57 66 -22 65 -22.5 114
58 79 18 77.5 15 180
59 81 57 80 78.75 412
60 75 57 80 78.75 755
61 79 98 80 78.75 404
62 67.5 17 67.5 18.75 75 63 61.7 7.4 62.5 7.5 89 64 46 7.5 45 7.5 111 65 42.5 0 42.5 0 0 66 42.5 44 42.5 45 82 67 38 43.5 37.5 45 143 68 38 46.5 37.5 45 143 69 66 61 65 60 120 70 43 77.5 42.5 78.75 116 71 38 71 37.5 71.25 59.8 72 42 77.5 42.5 78.75 116.9
73 36 76 35 75 143.4
74 35.3 74.6 35 75 49.3 75 36.4 72.4 37.5 71.25 159.4
76 28 87 27.5 90 300.4
77 28 90 27.5 90 55.6 78 30 89 30 90 96.3
79 39 99 40 97.5 170.1
80 47 91 47.5 90 93.7 81 36 87 37.5 86.25 179.7 82 42 80 42.5 78.75 116.9
83 33 91 30 90 346.8
84 28 99 27.5 97.5 157.7
85 31 82 30 78.75 330.6
86 45 80 45 78.75 98.3
[image:9.595.121.484.169.674.2]87 34 87 37.5 86.25 395.0 88 68 128 67.5 123.75 187.3 89 65 145 65 146.25 58.8 90 62.5 171 62.5 172.5 77.1 91 62.5 141 62.5 142.5 77.1 92 57.5 117 57.5 120 179.2 93 57.5 160 57.5 161.25 74.7 94 -0.2 37.3 0 37.5 31.4 95 -3.1 37.3 -2.5 37.5 70.3 96 0.4 30 0 30 44.5 97 -4 137 -7.5 138.75 434.7 98 -43.4 170 -45 168.75 203.9 99 -49 69 -50 71.25 196.9 100 -53 73.5 -50 71.25 368.1
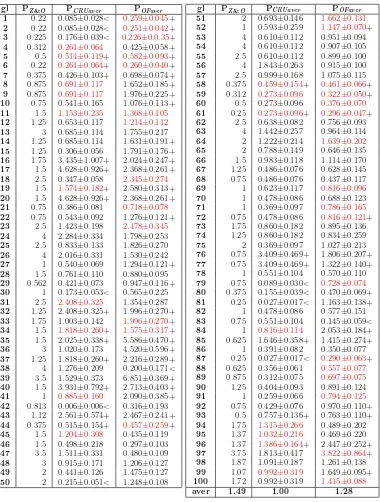
Average
annual
mean
precipitation
of
three
sources
Table B.2 lists average annual precipitation rates of 100 glaciated regions from three sources:
PZ&O data from Zuo and Oerlemans (1997a)
PCRUaver calculated from data of the Climate Research Unit (CRU) POFaver calculated from the data sets provided by Siobhan O’Farrell
gl PZ&O PCRUaver POFaver 1 0.22 0.085±0.028< 0.259±0.045+ 2 0.22 0.085±0.028< 0.251±0.042+ 3 0.225 0.176±0.039< 0.226±0.0.35+ 4 0.312 0.261±0.064 0.425±0.058 + 5 0.5 0.514±0.119+ 0.582±0.093+ 6 0.22 0.261±0.064+ 0.260±0.040+ 7 0.375 0.426±0.103+ 0.698±0.074 + 8 0.875 0.691±0.117 1.652±0.185 + 9 0.875 0.691±0.117 1.976±0.225 + 10 0.75 0.541±0.165 1.076±0.113 + 11 1.5 1.153±0.235 1.368±0.105 12 1.25 0.653±0.117 1.214±0.112 13 3 0.685±0.114 1.755±0.217 14 1.25 0.685±0.114 1.631±0.191 + 15 1.25 0.306±0.056 1.791±0.176 + 16 1.75 3.435±1.007+ 2.024±0.247 + 17 1.5 4.628±0.926+ 2.368±0.261 + 18 2.5 0.347±0.058 2.345±0.274 19 1.5 1.574±0.182+ 2.580±0.313 + 20 1.5 4.628±0.926+ 2.368±0.261 + 21 0.75 0.386±0.081 0.718±0.078 22 0.75 0.543±0.092 1.276±0.121 + 23 2.5 1.423±0.198 2.478±0.345 24 4 2.284±0.334 1.798±0.253 25 2.5 0.833±0.133 1.826±0.270 26 4 2.016±0.331 1.530±0.242 27 1 0.540±0.069 1.294±0.121 + 28 1.5 0.761±0.110 0.880±0.095 29 0.562 0.421±0.073 0.947±0.116 + 30 1 0.173±0.053< 0.565±0.225 31 2.5 2.408±0.325 1.354±0.287 32 1.25 2.408±0.325+ 1.996±0.270 + 33 1.75 1.003±0.142 1.996±0.270+ 34 1.5 1.818±0.260+ 1.575±0.317+ 35 1.5 2.025±0.338+ 5.586±0.470 + 36 3 1.020±0.173 4.520±0.596 + 37 1.25 1.818±0.260+ 2.216±0.289 + 38 4 1.276±0.209 0.200±0.171< 39 3.5 1.529±0.373 6.851±0.369 + 40 1.5 3.931±0.792+ 2.713±0.403 + 41 1 0.885±0.160 2.090±0.385 + 42 0.813 0.006±0.006< 0.316±0.193 43 1.12 2.561±0.574+ 2.467±0.241 + 44 0.375 0.515±0.154+ 0.457±0.259+ 45 1.5 1.204±0.308 0.435±0.119 46 1.5 0.498±0.218 0.297±0.103 47 3.5 1.511±0.331 0.480±0.109 48 3 0.915±0.171 1.206±0.127 49 2 0.441±0.126 1.475±0.127 50 2 0.215±0.051< 1.248±0.108
[image:11.595.123.503.142.644.2]gl PZ&O PCRUaver POFaver 51 2 0.693±0.146 1.662±0.131 52 1 0.593±0.259 1.147±0.070+ 53 4 0.610±0.112 0.951±0.094 54 4 0.610±0.112 0.907±0.105 55 2.5 0.610±0.112 0.899±0.100 56 4 1.843±0.263 0.915±0.100 57 2.5 0.999±0.168 1.075±0.115 58 0.375 0.459±0.154+ 0.461±0.066+ 59 0.312 0.273±0.096 0.322±0.050+ 60 0.5 0.273±0.096 0.376±0.070 61 0.25 0.273±0.096+ 0.296±0.047+ 62 2.5 0.638±0.082 0.756±0.093 63 4 1.442±0.257 0.964±0.114 64 2 1.222±0.214 1.639±0.202 65 2 0.788±0.149 0.646±0.135 66 1.5 0.983±0.118 1.114±0.170 67 1.25 0.486±0.076 0.628±0.145 68 0.75 0.486±0.076 0.437±0.117 69 1 0.623±0.117 0.816±0.096 70 1 0.478±0.086 0.688±0.123 71 1 0.369±0.097 0.786±0.165 72 0.75 0.478±0.086 0.816±0.121+ 73 1.75 0.860±0.182 0.895±0.136 74 1.25 0.860±0.182 0.834±0.259 75 2 0.369±0.097 1.027±0.213 76 0.75 3.409±0.469+ 1.806±0.207+ 77 0.75 3.409±0.469+ 1.322±0.140+ 78 1 0.551±0.104 0.570±0.110 79 0.75 0.089±0.030< 0.728±0.074 80 0.375 0.155±0.039< 0.470±0.069+ 81 0.25 0.027±0.017< 1.163±0.138+ 82 1 0.478±0.086 0.577±0.151 83 0.75 0.551±0.104 0.145±0.059< 84 1 0.816±0.114 2.053±0.184+ 85 0.625 1.646±0.358+ 1.415±0.274+ 86 1 0.391±0.082 0.350±0.077 87 0.25 0.027±0.017< 0.290±0.063+ 88 0.625 0.356±0.061 0.557±0.077 89 0.875 0.312±0.075 0.697±0.075 90 1.25 0.404±0.093 0.891±0.124 91 1 0.259±0.066 0.794±0.125 92 0.75 0.429±0.076 0.970±0.110+ 93 0.5 0.757±0.136+ 0.763±0.110+ 94 1.75 1.315±0.266 0.489±0.202 95 1.37 1.032±0.216 0.469±0.220 96 1.37 1.386±0.164+ 2.447±0.252+ 97 3.75 1.813±0.417 3.822±0.864+ 98 1.87 1.091±0.187 1.261±0.138 99 1.07 0.992±0.319 1.649±0.095+ 100 1.72 0.992±0.319 1.415±0.088 aver 1.49 1.00 1.28
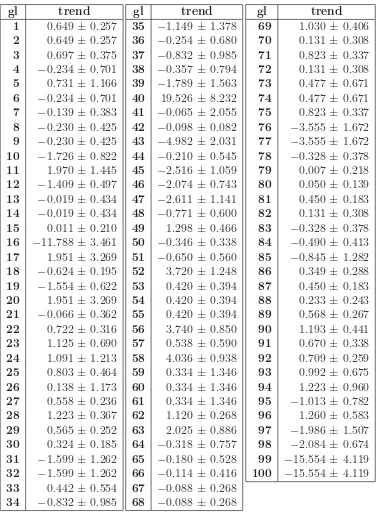
Trends of precipitation data sets
Table B.3 lists linear trends in precipitation of 100 glaciated regions calculated from the data set of the Climate Research Unit, CRU. The time periods vary for each region, not covering time before 1900 or after 1998 at all.
Trends in precipitation of 53 glaciated regions arepositive. Of these: 35 trends are significant at a 1σ level
23 trends are significant at a 2σ level 4 trends are significant at a 3σ level
Trends in precipitation of 47 glaciated regions arenegative. Of these: 23 trends are significant at a 1σ level
11 trends are significant at a 2σ level 5 trends are significant at a 3σ level
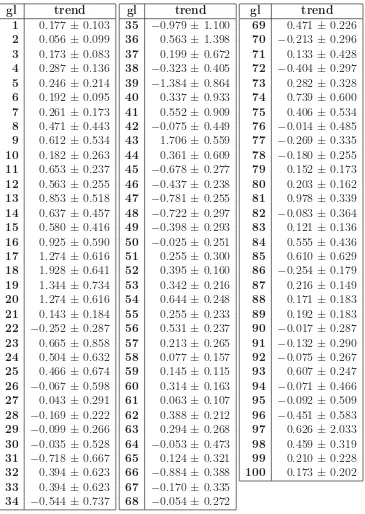
Table B.4 lists precipitation trends of 100 glaciated regions calculated from the data set of SiobhanO’Farrell. Data for the time period 1871-2000 is available and is given on a 1.875o longitude by ∼1.86o latitude grid.
Trends in precipitation of 66 glaciated regions arepositive. Of these: 37 trends are significant at a 1σ level
15 trends are significant at a 2σ level 2 trends are significant at a 3σ level
Trends in precipitation of 34 glaciated regions arenegative. Of these: 10 trends are significant at a 1σ level
gl trend 1 0.649 ±0.257 2 0.649 ±0.257 3 0.697 ±0.375 4 −0.234 ±0.701 5 0.731 ±1.166 6 −0.234 ±0.701 7 −0.139 ±0.383 8 −0.230 ±0.425 9 −0.230 ±0.425 10 −1.726 ±0.822 11 1.970 ±1.445 12 −1.409 ±0.497 13 −0.019 ±0.434 14 −0.019 ±0.434 15 0.011 ±0.210 16 −11.788 ±3.461 17 1.951 ±3.269 18 −0.624 ±0.195 19 −1.554 ±0.622 20 1.951 ±3.269 21 −0.066 ±0.362 22 0.722 ±0.316 23 1.125 ±0.690 24 1.091 ±1.213 25 0.803 ±0.464 26 0.138 ±1.173 27 0.558 ±0.236 28 1.223 ±0.367 29 0.565 ±0.252 30 0.324 ±0.185 31 −1.599 ±1.262 32 −1.599 ±1.262 33 0.442 ±0.554 34 −0.832 ±0.985
gl trend 35 −1.149 ± 1.378 36 −0.254 ± 0.680 37 −0.832 ± 0.985 38 −0.357 ± 0.794 39 −1.789 ± 1.563 40 19.526 ± 8.232 41 −0.065 ± 2.055 42 −0.098 ± 0.082 43 −4.982 ± 2.031 44 −0.210 ± 0.545 45 −2.516 ± 1.059 46 −2.074 ± 0.743 47 −2.611 ± 1.141 48 −0.771 ± 0.600 49 1.298 ± 0.466 50 −0.346 ± 0.338 51 −0.650 ± 0.560 52 3.720 ± 1.248 53 0.420 ± 0.394 54 0.420 ± 0.394 55 0.420 ± 0.394 56 3.740 ± 0.850 57 0.538 ± 0.590 58 4.036 ± 0.938 59 0.334 ± 1.346 60 0.334 ± 1.346 61 0.334 ± 1.346 62 1.120 ± 0.268 63 2.025 ± 0.886 64 −0.318 ± 0.757 65 −0.180 ± 0.528 66 −0.114 ± 0.416 67 −0.088 ± 0.268 68 −0.088 ± 0.268
gl trend
[image:13.595.141.517.162.680.2]69 1.030 ± 0.406 70 0.131 ± 0.308 71 0.823 ± 0.337 72 0.131 ± 0.308 73 0.477 ± 0.671 74 0.477 ± 0.671 75 0.823 ± 0.337 76 −3.555 ± 1.672 77 −3.555 ± 1.672 78 −0.328 ± 0.378 79 0.007 ± 0.218 80 0.050 ± 0.139 81 0.450 ± 0.183 82 0.131 ± 0.308 83 −0.328 ± 0.378 84 −0.490 ± 0.413 85 −0.845 ± 1.282 86 0.349 ± 0.288 87 0.450 ± 0.183 88 0.233 ± 0.243 89 0.568 ± 0.267 90 1.193 ± 0.441 91 0.670 ± 0.338 92 0.709 ± 0.259 93 0.992 ± 0.675 94 1.223 ± 0.960 95 −1.013 ± 0.782 96 1.260 ± 0.583 97 −1.986 ± 1.507 98 −2.084 ± 0.674 99 −15.554 ± 4.119 100 −15.554 ± 4.119
gl trend 1 0.177 ± 0.103 2 0.056 ± 0.099 3 0.173 ± 0.083 4 0.287 ± 0.136 5 0.246 ± 0.214 6 0.192 ± 0.095 7 0.261 ± 0.173 8 0.471 ± 0.443 9 0.612 ± 0.534 10 0.182 ± 0.263 11 0.653 ± 0.237 12 0.563 ± 0.255 13 0.853 ± 0.518 14 0.637 ± 0.457 15 0.580 ± 0.416 16 0.925 ± 0.590 17 1.274 ± 0.616 18 1.928 ± 0.641 19 1.344 ± 0.734 20 1.274 ± 0.616 21 0.143 ± 0.184 22 −0.252 ± 0.287 23 0.665 ± 0.858 24 0.504 ± 0.632 25 0.466 ± 0.674 26 −0.067 ± 0.598 27 0.043 ± 0.291 28 −0.169 ± 0.222 29 −0.099 ± 0.266 30 −0.035 ± 0.528 31 −0.718 ± 0.667 32 0.394 ± 0.623 33 0.394 ± 0.623 34 −0.544 ± 0.737
gl trend 35 −0.979 ± 1.100 36 0.563 ± 1.398 37 0.199 ± 0.672 38 −0.323 ± 0.405 39 −1.384 ± 0.864 40 0.337 ± 0.933 41 0.552 ± 0.909 42 −0.075 ± 0.449 43 1.706 ± 0.559 44 0.361 ± 0.609 45 −0.678 ± 0.277 46 −0.437 ± 0.238 47 −0.781 ± 0.255 48 −0.722 ± 0.297 49 −0.398 ± 0.293 50 −0.025 ± 0.251 51 0.255 ± 0.300 52 0.395 ± 0.160 53 0.342 ± 0.216 54 0.644 ± 0.248 55 0.255 ± 0.233 56 0.531 ± 0.237 57 0.213 ± 0.265 58 0.077 ± 0.157 59 0.145 ± 0.115 60 0.314 ± 0.163 61 0.063 ± 0.107 62 0.388 ± 0.212 63 0.294 ± 0.268 64 −0.053 ± 0.473 65 0.124 ± 0.321 66 −0.884 ± 0.388 67 −0.170 ± 0.335 68 −0.054 ± 0.272
[image:14.595.82.447.163.677.2]gl trend 69 0.471 ± 0.226 70 −0.213 ± 0.296 71 0.133 ± 0.428 72 −0.404 ± 0.297 73 0.282 ± 0.328 74 0.739 ± 0.600 75 0.406 ± 0.534 76 −0.014 ± 0.485 77 −0.269 ± 0.335 78 −0.180 ± 0.255 79 0.152 ± 0.173 80 0.203 ± 0.162 81 0.978 ± 0.339 82 −0.083 ± 0.364 83 0.121 ± 0.136 84 0.555 ± 0.436 85 0.610 ± 0.629 86 −0.254 ± 0.179 87 0.216 ± 0.149 88 0.171 ± 0.183 89 0.192 ± 0.183 90 −0.017 ± 0.287 91 −0.132 ± 0.290 92 −0.075 ± 0.267 93 0.607 ± 0.247 94 −0.071 ± 0.466 95 −0.092 ± 0.509 96 −0.451 ± 0.583 97 0.626 ± 2.033 98 0.459 ± 0.319 99 0.210 ± 0.228 100 0.173 ± 0.202
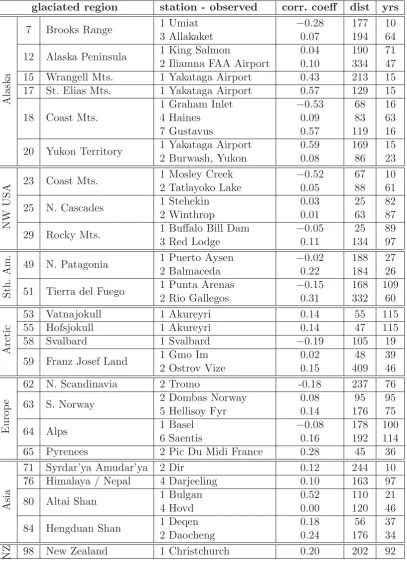
temperature
glaciated region station - observed corr. coeff dist yrs
Alask
a
7 Brooks Range 1 Umiat −0.28 177 10 3 Allakaket 0.07 194 64 12 Alaska Peninsula 1 King Salmon 0.04 190 71 2 Iliamna FAA Airport 0.10 334 47 15 Wrangell Mts. 1 Yakataga Airport 0.43 213 15 17 St. Elias Mts. 1 Yakataga Airport 0.57 129 15 18 Coast Mts.
1 Graham Inlet −0.53 68 16 4 Haines 0.09 83 63 7 Gustavus 0.57 119 16 20 Yukon Territory 1 Yakataga Airport 0.59 169 15 2 Burwash, Yukon 0.08 86 23
NW
USA
23 Coast Mts. 1 Mosley Creek −0.52 67 10 2 Tatlayoko Lake 0.05 88 61 25 N. Cascades 1 Stehekin 0.03 25 82 2 Winthrop 0.01 63 87 29 Rocky Mts. 1 Buffalo Bill Dam −0.05 25 89 3 Red Lodge 0.11 134 97
Sth.
Am. 49 N. Patagonia
1 Puerto Aysen −0.02 188 27 2 Balmaceda 0.22 184 26 51 Tierra del Fuego 1 Punta Arenas −0.15 168 109
2 Rio Gallegos 0.31 332 60
Arctic
53 Vatnajokull 1 Akureyri 0.14 55 115 55 Hofsjokull 1 Akureyri 0.14 47 115 58 Svalbard 1 Svalbard −0.19 105 19 59 Franz Josef Land 1 Gmo Im 0.02 48 39 2 Ostrov Vize 0.15 409 46
Europ
e
62 N. Scandinavia 2 Tromo -0.18 237 76 63 S. Norway 2 Dombas Norway 0.08 95 95 5 Hellisoy Fyr 0.14 176 75 64 Alps 1 Basel −0.08 178 100
6 Saentis 0.16 192 114 65 Pyrenees 2 Pic Du Midi France 0.28 45 36
Asia
71 Syrdar’ya Amudar’ya 2 Dir 0.12 244 10 76 Himalaya / Nepal 4 Darjeeling 0.10 163 97 80 Altai Shan 1 Bulgan 0.52 110 21 4 Hovd 0.00 120 46 84 Hengduan Shan 1 Deqen 0.18 56 37 2 Daocheng 0.24 176 34
[image:16.595.65.473.133.697.2]NZ 98 New Zealand 1 Christchurch 0.20 202 92
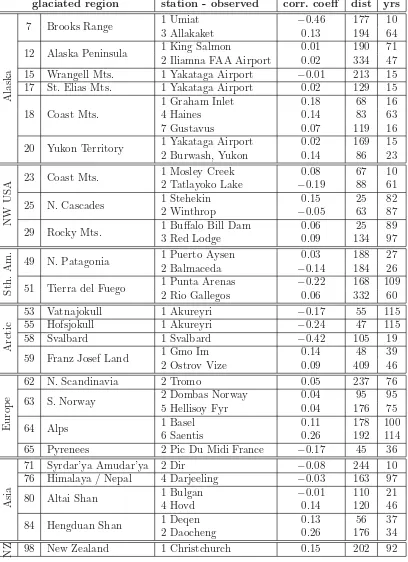
glaciated region station - observed corr. coeff dist yrs
Alask
a
7 Brooks Range 1 Umiat −0.46 177 10 3 Allakaket 0.13 194 64 12 Alaska Peninsula 1 King Salmon 0.01 190 71 2 Iliamna FAA Airport 0.02 334 47 15 Wrangell Mts. 1 Yakataga Airport −0.01 213 15 17 St. Elias Mts. 1 Yakataga Airport 0.02 129 15 18 Coast Mts.
1 Graham Inlet 0.18 68 16 4 Haines 0.14 83 63 7 Gustavus 0.07 119 16 20 Yukon Territory 1 Yakataga Airport 0.02 169 15 2 Burwash, Yukon 0.14 86 23
NW
USA
23 Coast Mts. 1 Mosley Creek 0.08 67 10 2 Tatlayoko Lake −0.19 88 61 25 N. Cascades 1 Stehekin 0.15 25 82 2 Winthrop −0.05 63 87 29 Rocky Mts. 1 Buffalo Bill Dam 0.06 25 89 3 Red Lodge 0.09 134 97
Sth.
Am. 49 N. Patagonia
1 Puerto Aysen 0.03 188 27 2 Balmaceda −0.14 184 26 51 Tierra del Fuego 1 Punta Arenas −0.22 168 109
2 Rio Gallegos 0.06 332 60
Arctic
53 Vatnajokull 1 Akureyri −0.17 55 115 55 Hofsjokull 1 Akureyri −0.24 47 115 58 Svalbard 1 Svalbard −0.42 105 19 59 Franz Josef Land 1 Gmo Im 0.14 48 39 2 Ostrov Vize 0.09 409 46
Europ
e
62 N. Scandinavia 2 Tromo 0.05 237 76 63 S. Norway 2 Dombas Norway 0.04 95 95 5 Hellisoy Fyr 0.04 176 75 64 Alps 1 Basel 0.11 178 100
6 Saentis 0.26 192 114 65 Pyrenees 2 Pic Du Midi France −0.17 45 36
Asia
71 Syrdar’ya Amudar’ya 2 Dir −0.08 244 10 76 Himalaya / Nepal 4 Darjeeling −0.03 163 97 80 Altai Shan 1 Bulgan −0.01 110 21 4 Hovd 0.14 120 46 84 Hengduan Shan 1 Deqen 0.13 56 37 2 Daocheng 0.26 176 34
[image:17.595.121.529.136.698.2]NZ 98 New Zealand 1 Christchurch 0.15 202 92
Linear trends in temperature over the period
1871-1990
Table B.7 lists linear trends in temperature of 100 glaciated regions over the period 1871-1990 using TG and TOF.
Temperature trends based on theGregory data set:
Trends in temperature of 97 glaciated regions are positive. Of those: 92 trends are significant at a 1σ level
58 trends are significant at a 2σ level 33 trends are significant at a 3σ level
Trends in temperature of 3 glaciated regions are negative: Of those: 1 trend is significant at a 1σ level.
Temperature trends based on theO’Farrell data set:
Trends in temperature of 99 glaciated regions are positive. Of those: 90 trends are significant at a 1σ level
83 trends are significant at a 2σ level 64 trends are significant at a 3σ level
2 0.0080±0.0040 0.0091 ±0.0022
3 0.0031±0.0029 0.0097 ±0.0027
4 0.0032±0.0027 0.0100 ±0.0027
5 −0.0017±0.0033 0.0064 ±0.0033
6 0.0032±0.0027 0.0088 ±0.0032
7 0.0105±0.0025 0.0073 ±0.0034
8 0.0041±0.0023 0.0071 ±0.0038
9 0.0041±0.0023 0.0066 ±0.0033
10 0.0103±0.0048 0.0033 ±0.0038
11 0.0063±0.0026 0.0011 ±0.0013
12 0.0051±0.0031 0.0024 ±0.0017
13 0.0044±0.0041 0.0058 ±0.0030
14 0.0044±0.0041 0.0054 ±0.0030
15 0.0043±0.0022 0.0068 ±0.0029
16 0.0046±0.0045 0.0067 ±0.0030
17 0.0041±0.0034 0.0066 ±0.0028
18 0.0038±0.0024 0.0068 ±0.0027
19 0.0059±0.0022 0.0059 ±0.0023
20 0.0039±0.0026 0.0066 ±0.0028
21 0.0051±0.0021 0.0077 ±0.0024
22 0.0051±0.0022 0.0070 ±0.0022
23 0.0012±0.0015 0.0061 ±0.0019
24 0.0022±0.0015 0.0054 ±0.0015
25 0.0032±0.0022 0.0061 ±0.0016
26 0.0018±0.0014 0.0060 ±0.0015
27 0.0026±0.0016 0.0083 ±0.0017
28 0.0016±0.0014 0.0081 ±0.0016
29 0.0032±0.0021 0.0087 ±0.0015
30 0.0020±0.0022 0.0076 ±0.0018
31 0.0038±0.0019 0.0092 ±0.0017
32 0.0038±0.0019 0.0085 ±0.0015
33 0.0065±0.0014 0.0085 ±0.0015
34 0.0063±0.0015 0.0098 ±0.0021
35 0.0063±0.0012 0.0068 ±0.0016
36 0.0056±0.0012 0.0075 ±0.0016
37 0.0063±0.0015 0.0089 ±0.0019
38 0.0076±0.0023 0.0084 ±0.0018
39 0.0057±0.0013 0.0067 ±0.0014
40 0.0055±0.0034 0.0083 ±0.0021
41 0.0058±0.0012 0.0069 ±0.0018
42 0.0068±0.0012 0.0087 ±0.0021
43 0.0047±0.0012 0.0070 ±0.0018
44 0.0059±0.0016 0.0087 ±0.0021
45 0.0032±0.0012 0.0079 ±0.0011
46 0.0054±0.0012 0.0083 ±0.0011
47 0.0035±0.0013 0.0085 ±0.0011
48 0.0041±0.0011 0.0065 ±0.0012
49 0.0034±0.0007 0.0054 ±0.0009
50 0.0032±0.0007 0.0057 ±0.0009
52 0.0024±0.0011 0.0021±0.0009
53 0.0087±0.0043 0.0041±0.0036
54 0.0087±0.0043 −0.0005±0.0035
55 0.0087±0.0043 0.0028±0.0039
56 −0.0003±0.0014 0.0008±0.0032
57 0.0002±0.0021 0.0018±0.0044
58 0.0316±0.0087 0.0136±0.0046
59 0.0196±0.0045 0.0120±0.0033
60 0.0144±0.0034 0.0093±0.0037
61 0.0050±0.0027 0.0145±0.0028
62 0.0076±0.0028 0.0060±0.0036
63 0.0046±0.0037 0.0050±0.0025
64 0.0045±0.0027 0.0064±0.0016
65 −0.0029±0.0015 0.0073±0.0016
66 0.0029±0.0023 0.0057±0.0020
67 0.0050±0.0019 0.0047±0.0016
68 0.0050±0.0019 0.0036±0.0017
69 0.0049±0.0032 0.0072±0.0036
70 0.0026±0.0015 0.0084±0.0018
71 0.0038±0.0019 0.0099±0.0019
72 0.0026±0.0015 0.0096±0.0016
73 0.0047±0.0016 0.0091±0.0015
74 0.0047±0.0016 0.0076±0.0020
75 0.0038±0.0019 0.0100±0.0023
76 0.0039±0.0012 0.0098±0.0025
77 0.0013±0.0010 0.0112±0.0024
78 0.0026±0.0024 0.0099±0.0027
79 0.0064±0.0016 0.0067±0.0012
80 0.0039±0.0022 0.0063±0.0019
81 0.0049±0.0018 0.0083±0.0012
82 0.0026±0.0015 0.0083±0.0017
83 0.0025±0.0012 0.0089±0.0016
84 0.0002±0.0009 0.0057±0.0012
85 0.0023±0.0018 0.0077±0.0021
86 0.0040±0.0022 0.0070±0.0019
87 0.0049±0.0018 0.0076±0.0018
88 0.0097±0.0020 0.0019±0.0020
89 0.0071±0.0022 0.0005±0.0019
90 0.0090±0.0030 0.0028±0.0023
91 0.0065±0.0023 0.0003±0.0020
92 0.0073±0.0020 0.0037±0.0018
93 0.0048±0.0028 0.0018±0.0024
94 0.0067±0.0015 0.0081±0.0014
95 0.0070±0.0015 0.0079±0.0013
96 0.0063±0.0008 0.0086±0.0012
97 0.0056±0.0006 0.0069±0.0007
98 0.0051±0.0013 0.0031±0.0009
99 0.0053±0.0007 0.0072±0.0007
100 0.0065±0.0009 0.0079±0.0008
[image:19.595.119.527.103.731.2]Linear trends in temperature over the period
1871-1895
Table B.8 lists linear trends in temperature of 100 glaciated regions over the period 1871-1895 using TG and TOF.
Temperature trends based on theGregory data set:
Trends in temperature of 41 glaciated regions are positive. Of those: 21 trends are significant at a 1σ level
5 trends are significant at a 2σ level 1 trend is significant at a 3σ level
Trends in temperature of 59 glaciated regions are negative. Of those: 30 trends are significant at a 1σ level
3 trends are significant at a 2σ level 0 trends are significant at a 3σ level
Temperature trends based on theO’Farrell data set:
Trends in temperature of 82 glaciated regions are positive. Of those: 31 trends are significant at a 1σ level
15 trends are significant at a 2σ level 5 trends are significant at a 3σ level
Trends in temperature of 18 glaciated regions are negative. Of those: 2 trends are significant at a 1σ level
2 −0.0316±0.0447 0.0107±0.0247
3 −0.0250±0.0389 0.0299±0.0310
4 −0.0307±0.0298 0.0276±0.0330
5 −0.0755±0.0382 0.0558±0.0351
6 −0.0307±0.0298 0.1088±0.0345
7 −0.0289±0.0303 0.0166±0.0338
8 −0.0312±0.0213 0.0169±0.0334
9 −0.0312±0.0213 0.0135±0.0295
10 −0.0692±0.0468 −0.0011±0.0274
11 −0.0414±0.0269 0.0046±0.0111
12 −0.0635±0.0294 0.0033±0.0133
13 −0.0592±0.0365 0.0106±0.0259
14 −0.0592±0.0365 0.0086±0.0254
15 −0.0369±0.0205 0.0118±0.0268
16 −0.0567±0.0417 0.0128±0.0268
17 −0.0428±0.0292 0.0084±0.0235
18 −0.0249±0.0211 0.0165±0.0236
19 −0.0210±0.0199 0.0238±0.0194
20 −0.0300±0.0226 0.0084±0.0235
21 −0.0405±0.0208 0.0215±0.0237
22 −0.0257±0.0207 0.0311±0.0236
23 −0.0191±0.0141 0.0137±0.0175
24 −0.0058±0.0166 0.0025±0.0156
25 −0.0138±0.0236 0.0017±0.0176
26 −0.0025±0.0180 0.0035±0.0161
27 −0.0237±0.0157 −0.0002±0.0173
28 −0.0128±0.0138 −0.0004±0.0168
29 −0.0091±0.0243 −0.0013±0.0153
30 −0.0364±0.0302 −0.0168±0.0142
31 −0.0207±0.0206 −0.0178±0.0152
32 −0.0207±0.0206 0.0060±0.0130
33 −0.0157±0.0141 0.0060±0.0130
34 0.0029±0.0164 0.0027±0.0154
35 0.0072±0.0154 0.0042±0.0103
36 0.0061±0.0151 0.0118±0.0108
37 0.0029±0.0164 0.0166±0.0135
38 0.0169±0.0247 −0.0030±0.0099
39 0.0068±0.0161 0.0063±0.0092
40 0.0530±0.0378 0.0121±0.0147
41 0.0057±0.0154 0.0187±0.0134
42 0.0049±0.0168 0.0105±0.0161
43 0.0039±0.0156 −0.0017±0.0156
44 0.0147±0.0172 0.0148±0.0159
45 −0.0031±0.0122 −0.0003±0.0116
46 0.0129±0.0127 −0.0027±0.0113
47 −0.0086±0.0141 −0.0046±0.0104
48 −0.0035±0.0119 −0.0134±0.0140
49 0.0087±0.0067 −0.0032±0.0100
50 0.0102±0.0063 0.0017±0.0096
52 −0.0219 ±0.0115 0.0053 ±0.0084
53 0.0585 ±0.0568 0.1867 ±0.0271
54 0.0585 ±0.0568 0.1747 ±0.0259
55 0.0585 ±0.0568 0.2290 ±0.0322
56 −0.0119 ±0.0153 0.1569 ±0.0235
57 −0.0106 ±0.0251 0.2588 ±0.0365
58 0.1606 ±0.0935 0.0763 ±0.0507
59 0.0704 ±0.0472 0.0825 ±0.0326
60 0.0827 ±0.0394 0.0976 ±0.0341
61 −0.0157 ±0.0277 0.0593 ±0.0294
62 0.1078 ±0.0333 0.0789 ±0.0395
63 0.1166 ±0.0458 0.0551 ±0.0240
64 −0.0113 ±0.0269 0.0380 ±0.0149
65 −0.0097 ±0.0145 0.0343 ±0.0145
66 −0.0325 ±0.0289 −0.0194 ±0.0263
67 −0.0248 ±0.0253 −0.0153 ±0.0200
68 −0.0248 ±0.0253 0.0063 ±0.0191
69 0.0759 ±0.0430 0.0522 ±0.0326
70 −0.0166 ±0.0183 0.0274 ±0.0180
71 −0.0080 ±0.0228 0.0132 ±0.0224
72 −0.0166 ±0.0183 0.0318 ±0.0165
73 0.0100 ±0.0180 0.0172 ±0.0152
74 0.0100 ±0.0180 0.0039 ±0.0214
75 −0.0080 ±0.0228 0.0200 ±0.0373
76 0.0126 ±0.0102 0.0110 ±0.0173
77 0.0079 ±0.0086 0.0137 ±0.0187
78 −0.0449 ±0.0282 0.0150 ±0.0191
79 0.0118 ±0.0171 0.0137 ±0.0129
80 −0.0500 ±0.0258 0.0158 ±0.0245
81 0.0036 ±0.0194 0.0121 ±0.0123
82 −0.0166 ±0.0183 0.0445 ±0.0146
83 −0.0117 ±0.0154 0.0109 ±0.0145
84 0.0000 ±0.0099 0.0054 ±0.0115
85 −0.0104 ±0.0204 0.0017 ±0.0222
86 −0.0224 ±0.0256 0.0132 ±0.0169
87 0.0036 ±0.0194 0.0154 ±0.0180
88 0.0339 ±0.0225 0.0050 ±0.0221
89 0.0346 ±0.0190 0.0025 ±0.0215
90 0.0036 ±0.0290 0.0364 ±0.0256
91 0.0344 ±0.0205 0.0152 ±0.0242
92 0.0412 ±0.0253 0.0300 ±0.0224
93 0.0169 ±0.0260 0.0433 ±0.0210
94 0.0286 ±0.0177 −0.0093 ±0.0116
95 0.0498 ±0.0198 0.0013 ±0.0111
96 0.0029 ±0.0110 0.0057 ±0.0094
97 −0.0001 ±0.0088 0.0043 ±0.0053
98 −0.0386 ±0.0140 −0.0025 ±0.0073
99 −0.0164 ±0.0068 0.0136 ±0.0056
100 −0.0084 ±0.0098 0.0151 ±0.0066
[image:21.595.117.530.104.732.2]Supporting material for Chapter 3
Compiling mass balance observations into primary
systems of Dyurgerov and Meier (2005)
Upscaling
method
from
primary
to
regional
systems of Dyurgerov and Meier (2005)
Table C.1 lists predicted ice-volume changes of 100 glaciated regions over the period 1871-1990, using various combinations of temperature and precipitation data sets, in particular TGPZ&O, TGPCRUseries, TOFPZ&O, and TOFPOF series. The parameter Θ is set globally to 0.15 K except for one case where regionally variable Θs are used.
gl TG TOF
PZ&O PCRUseries PZ&O POF series POF seriesΘvar
1 −1.634 −7.234 −1.536 −2.228 −5.080
2 −0.193 −0.310 −0.379 −0.465 −0.861
3 −0.649 −0.744 −0.387 −0.445 −0.957
4 −0.915 −0.849 −0.896 −1.287 −2.203
5 −0.107 −0.091 −0.884 −1.238 −2.372
6 −0.201 −0.229 −0.079 −0.120 −0.301
7 −0.068 −0.077 −0.014 −0.020 −0.022
8 −2.132 −1.837 0.277 0.317 0.242
9 −0.123 −0.106 0.001 −0.010 −0.015
10 −0.038 −0.029 0.010 0.014 0.014
11 −0.122 −0.101 −0.036 −0.034 −0.039
12 −0.143 −0.089 0.009 0.003 −0.002
13 −0.290 −0.132 −0.005 −0.020 −0.025
14 −0.834 −0.609 0.010 −0.022 −0.046
15 −1.540 −0.680 −0.343 −0.564 −0.612
16 −3.595 −5.277 −1.300 −1.675 −1.810
17 −2.253 −4.336 −0.795 −1.262 −1.344
18 −2.373 −0.771 −1.110 −1.061 −1.134
19 −1.226 −1.263 −0.478 −0.687 −0.724
20 −2.360 −4.341 −0.673 −1.070 −1.139
21 −0.067 −0.044 −0.034 −0.035 −0.037
22 −0.030 −0.024 −0.021 −0.034 −0.035
23 −1.759 −1.144 −4.725 −4.551 −2.613
24 −0.013 −0.009 −0.020 −0.013 −0.008
25 −0.107 −0.060 −0.109 −0.090 −0.059
26 −0.019 −0.013 −0.031 −0.018 −0.011
27 −0.359 −0.240 −0.785 −0.904 −0.627
28 −0.151 −0.101 −0.347 −0.251 −0.180
29 −0.001 −0.001 −0.013 −0.018 −0.012
30 −0.003 −0.001 −0.010 −0.006 −0.003
31 −0.001 −0.001 −0.002 −0.001 −0.001
32 −0.000 −0.001 −0.001 −0.001 −0.001
33 −0.001 −0.000 −0.001 −0.001 −0.001
34 −0.001 −0.001 −0.001 −0.001 −0.001
35 −0.005 −0.006 −0.004 −0.010 −0.010
36 −0.008 −0.004 −0.009 −0.011 −0.011
37 −0.008 −0.010 −0.008 −0.011 −0.011
38 −0.012 −0.006 −0.009 −0.001 0.000
39 −0.042 −0.023 −0.042 −0.067 −0.067
gl TG TOF
PZ&O PCRUseries PZ&O POF series POF series Θvar
41 −0.052 −0.048 −0.038 −0.056 −0.056
42 −0.083 −0.036 −0.109 −0.037 −0.026
43 −0.051 −0.111 −0.090 −0.152 −0.152
44 −0.174 −0.225 −0.287 −0.202 −0.164
45 −0.538 −0.502 −0.219 −0.090 −0.059
46 −0.839 −0.569 −0.360 −0.118 −0.077
47 −0.137 −0.104 −0.088 −0.024 −0.017
48 −1.954 −1.239 −1.976 −1.113 −0.815
49 −1.945 −0.996 −1.674 −1.337 −0.789
50 −4.939 −2.038 −4.889 −3.462 −2.017
51 −0.764 −0.473 −0.665 −0.582 −0.302
52 −1.392 −1.129 −0.530 −0.589 −0.589
53 −4.251 −0.929 −5.594 −2.120 −4.290
54 −0.488 −0.107 −0.376 −0.141 −0.382
55 −0.329 −0.104 −0.404 −0.186 −0.419
56 −0.044 −0.022 −0.267 −0.103 −0.256
57 −0.015 −0.007 −0.063 −0.032 −0.078
58 −2.758 −3.449 −2.839 −4.148 −9.972
59 −0.636 −0.542 −0.631 −0.782 −2.489
60 −1.887 −1.012 −0.780 −0.845 −4.111
61 −0.359 −0.399 −0.713 −0.932 −3.084
62 −0.109 −0.017 −0.163 −0.062 −0.230
63 −0.191 −0.059 −0.593 −0.199 −0.500
64 −0.291 −0.211 −0.520 −0.438 −1.210
65 0.001 0.001 −0.004 −0.002 −0.003
66 −0.234 −0.186 −0.541 −0.419 −0.692
67 −0.006 −0.004 −0.006 −0.003 −0.006
68 −0.004 −0.003 −0.003 −0.002 −0.004
69 −0.099 −0.067 −0.052 −0.051 −0.183
70 −0.267 −0.141 −0.365 −0.262 −0.599
71 −0.748 −0.181 −2.801 −2.229 −2.858
72 −0.302 −0.203 −0.726 −0.731 −0.932
73 −8.563 −5.103 −11.529 −6.731 −9.307
74 −0.051 −0.038 −0.057 −0.034 −0.052
75 −0.196 −0.023 −0.606 −0.349 −0.444
76 −1.348 −4.143 −2.809 −4.819 −6.142
77 −0.123 −0.360 −0.263 −0.394 −0.507
78 −1.113 −0.646 −1.628 −1.073 −1.429
79 −0.320 −0.149 −0.351 −0.345 −0.478
gl TG TOF
PZ&O PCRUseries PZ&O POF series POF series Θvar
81 −0.362 −0.405 −0.778 −2.485 −3.379
82 −1.110 −0.585 −2.235 −1.252 −1.706
83 −0.175 −0.137 −0.421 −0.188 −0.162
84 −0.167 −0.147 −0.223 −0.354 −0.520
85 −0.151 −0.397 −0.271 −0.499 −0.691
86 −0.155 −0.075 −0.083 −0.023 −0.054
87 −0.100 −0.111 −0.300 −0.299 −0.385
88 −0.002 −0.001 −0.001 −0.001 −0.001
89 −0.047 −0.026 −0.028 −0.022 −0.043
90 −0.047 −0.024 0.003 0.001 −0.016
91 −0.014 −0.004 −0.025 −0.021 −0.033
92 −0.000 0.000 −0.001 −0.001 −0.003
93 −0.026 −0.040 −0.055 −0.070 −0.120
94 −0.000 −0.000 0.000 0.000 0.000
95 −0.002 −0.001 −0.002 −0.001 −0.001
96 −0.001 −0.001 −0.001 −0.001 −0.001
97 −0.003 −0.002 −0.003 −0.003 −0.003
98 −0.510 −0.395 −0.203 −0.156 −0.156
99 −0.134 −0.130 −0.072 −0.095 −0.095
100 −0.190 −0.144 −0.093 −0.082 −0.082
total −64.45 −59.36 −65.38 −58.91 −85.57
[image:32.595.69.471.226.576.2](0.178) (0.164) (0.181) (0.163) (0.236)
gl reg area dV
1 3 80,000 −7.747
2 3 11,700 −1.133
3 3 16,200 −1.569
4 3 18,500 −1.792
5 3 18,500 −1.792
6 3 5,000 −0.484
7 7 722 −0.431
8 7 13,900 −8.306
9 7 800 −0.478
10 7 230 −0.137
11 7 960 −0.574
12 7 1,250 −0.747
13 7 1,000 −0.598
14 7 4,600 −2.749
15 7 8,300 −4.960
16 7 21,600 −12.907
17 7 11,800 −7.051
18 7 10,500 −6.274
19 7 5,070 −3.030
20 7 10,000 −5.976
21 2 600 −0.302
22 2 300 −0.151
23 2 13,500 −6.792
24 2 46 −0.023
25 2 266 −0.134
26 2 63 −0.032
27 2 3,000 −1.509
28 2 1,000 −0.503
29 2 74 −0.037
30 2 51 −0.026
31 n/a 4 −0.011
32 n/a 4 −0.011
33 n/a 3 −0.008
34 2 3 −0.002
35 2 19 −0.010
36 2 24 −0.012
37 2 39 −0.020
38 2 19 −0.010
39 2 111 −0.056
40 11 873 −0.091
gl reg area dV
41 11 258 −0.027
42 11 649 −0.068
43 11 510 −0.053
44 11 2,800 −0.293
45 11 743 −0.078
46 11 1,170 −0.122
47 11 156 −0.016
48 10 3,570 −3.032
49 10 5,720 −4.858
50 10 16,900 −14.352
51 10 2,700 −2.293
52 n/a 4,100 −0.802
53 1 8,300 −0.360
54 1 953 −0.041
55 1 925 −0.040
56 1 600 −0.026
57 1 160 −0.007
58 5 36,600 −6.050
59 4 13,700 −0.608
60 4 23,600 −1.047
61 4 18,300 −0.812
62 1 1,080 −0.047
63 1 1,630 −0.071
64 1 2,910 −0.126
65 1 12 −0.001
66 1 1,340 −0.058
67 1 24 −0.001
68 1 20 −0.001
69 4 800 −0.036
70 8 2,300 −0.609
71 8 10,700 −2.831
72 8 3,320 −0.878
73 8 40,000 −10.584
74 8 301 −0.080
75 8 1,350 −0.357
76 8 12,700 −3.360
77 8 1,340 −0.355
78 8 7,540 −1.995
79 8 2,380 −0.630
gl reg area dV
81 8 11,600 −3.069
82 8 9,550 −2.527
83 8 2,080 −0.550
84 8 1,460 −0.386
85 8 2,190 −0.579
86 8 910 −0.241
87 8 3,190 −0.844
88 9 18 −0.002
89 9 372 −0.046
90 9 260 −0.032
91 9 202 −0.025
92 9 19 −0.002
93 9 874 −0.108
94 n/a 1 −0.001
95 n/a 5 −0.003
96 n/a 5 −0.003
97 n/a 7 −0.003
98 n/a 1,000 −2.379
99 n/a 450 −0.088
100 n/a 450 −0.088
[image:34.595.165.374.230.562.2]total 527674 −146.5 (0.405)
Supporting material for Chapter 5
Tables D.1 and D.2 list locations of existing GPS and tide gauge stations which are referenced in Chapter 5.
site name short Latitude Longitude Fairbanks fair 64.98 −147.50 Dunedin ous2 −45.87 170.51 Ny ˚Alesund nyal 78.93 11.87
Palmer atw2 61.60 −149.13
Punta Arenas parc −53.13 −70.88 Resolute reso 74.70 −94.89
Sheshan shao 31.10 121.20
Sydney sydn −33.78 151.15
Tromsoe tro1 69.66 18.94
[image:35.595.182.475.393.586.2]Refrigerator Rock frig 62.41 −143.01 Reykjavik reyk 64.14 −21.96 Whitehorse whit 60.75 −135.22
site name Latitude Longitude
Anchorage 61.23 −149.90
Barentsburg 78.07 14.25
Bartlett Cove 58.46 −135.88
Cordova 60.55 −145.77
Dunedin −45.88 170.52
Juneau 58.30 −134.42
Kanmen 28.08 121.28
Ketchikan 55.33 −131.63
Langara Point 54.25 −133.03
Nikiski 60.68 −151.40
Ny ˚Alesund 78.93 11.93
Punta Arenas −53.17 −70.90 Prince Rupert 54.32 −130.33 Queen Charlotte City 53.25 −132.07
Resolute 74.68 −94.88
Reykjavik 64.15 −21.93
Sand Point 55.33 −160.50
Seldovia 59.43 −151.72
Seward 60.12 −149.43
Sitka 57.05 −135.33
Skagway 59.45 −135.32
St. Pauls habor 57.75 −152.48
Sydney −33.85 151.23
Tromso 69.65 18.97
Yakutat 59.55 −139.73
Valdez 61.13 −146.37
[image:36.595.137.407.238.633.2]Womens Bay 57.72 −152.52
Supporting material for Chapter 6
Ocean bottom pressure changes and
correspond-ing second order relative sea-level changes
Plots in Figure E.1 show the ocean bottom pressure changes over selected 10-year periods (data provided by Felix Landerer). Note the changes in scale in 2000, 2050, and 2100.
1860-1869 0.20 0.15 0.10 0.05 0.00 0.05 0.10 0.15 0.20 m 1900-1909 0.20 0.15 0.10 0.05 0.00 0.05 0.10 0.15 0.20 m 1950-1959 0.20 0.15 0.10 0.05 0.00 0.05 0.10 0.15 0.20 m 2000-2009 0.4 0.3 0.2 0.1 0.0 0.1 0.2 0.3 0.4 m 2050-2059 0.599 0.500 0.400 0.299 0.200 0.100 0.000 0.100 0.200 0.299 0.400 0.500 0.599 m 2100-2109 0.8 0.7 0.6 0.5 0.4 0.3 0.2 0.1 0.0 0.1 0.2 0.3 0.4 0.5 0.6 0.7 0.8 m 2150-2159 0.8 0.7 0.6 0.5 0.4 0.3 0.2 0.1 0.0 0.1 0.2 0.3 0.4 0.5 0.6 0.7 0.8 m 2190-2199 0.8 0.7 0.6 0.5 0.4 0.3 0.2 0.1 0.0 0.1 0.2 0.3 0.4 0.5 0.6 0.7 0.8 m
2100-2109 0.06 0.05 0.04 0.03 0.02 0.01 0.00 0.01 0.02 0.03 0.04 0.05 0.06 m 2120-2129 0.06 0.05 0.04 0.03 0.02 0.01 0.00 0.01 0.02 0.03 0.04 0.05 0.06 m 2140-2149 0.06 0.05 0.04 0.03 0.02 0.01 0.00 0.01 0.02 0.03 0.04 0.05 0.06 m 2160-2169 0.06 0.05 0.04 0.03 0.02 0.01 0.00 0.01 0.02 0.03 0.04 0.05 0.06 m 2180-2189 0.06 0.05 0.04 0.03 0.02 0.01 0.00 0.01 0.02 0.03 0.04 0.05 0.06 m