Rochester Institute of Technology
RIT Scholar Works
Theses
Thesis/Dissertation Collections
1987
A report on debugging networked real-time
multi-microprocessor systems
Anandi Krishnamurthy
Follow this and additional works at:
http://scholarworks.rit.edu/theses
This Thesis is brought to you for free and open access by the Thesis/Dissertation Collections at RIT Scholar Works. It has been accepted for inclusion
in Theses by an authorized administrator of RIT Scholar Works. For more information, please contact
Recommended Citation
Rochester Institute of Technology
~chool
of Computer Science and Technology
A report on
Debugging networked real-time multi-microprocessor systems
by
Anandi Krishnamurthy
A thesis, submitted to
The Faculty of the School of Computer Science and Technology,
in partial fulfillment of the requirements forthe degree of
Master of Science in Computer Science
Approved by:
Prof. Wiley R. McKinzie, Chairman
Prof. Peter G. Anderson
Dr. Andrew T. Kitchen
I, Anandi Krishnamurthy, prefer to be contacted each time a request for
reproduction is made.
I can be reached at the following address
:
Acknowledgements
I
amgreatly indebted
to
Xerox Corp. for
financing
and otherwisesupporting my
Abstract:
Software
development
in
networked real-time multi-microprocessor control systemsis
madedifficult
by
the
real-time constraintsand parallelprocessing
inherent in
such systems.Software
development
in
general,
anddebugging,
in
particular,
of networked real-time multi-microprocessor systemsis discussed.
A
tool
that
is
a part of adebugger for
such a systemis
described.
The
tool
runs on a workstation with a passive user-interface and provideshigh-level
accessto the
control software.The
commands supportedby
the tool
are analyzed.The
software architecture ofthe tool
is
documented
using data flow
diagrams,
adictionary,
file
formats
and pseudo-code.Key
Words
andPhrases:
networked real-time multi-microprocessorsystems,
high-level
debugging,
non-invasivedebugging.Debugging
networkedreal-time
multi-microprocessor systemsI.
Introduction
1.1
Multi-microprocessor
systems1.2
Networked
real-time multi-microprocessordebuggers
1.3
Project
overview1
.4Objective
and outline1.
High Level Language
andDebugging
2.1
Definitions
2.2
Language
requirementsfor
networked real-time multi-microprocessor systems2.3
Language
features
that
aidin
debugging
2.4
Language
anddebugging.
How
the
two
are related2.5
Conclusion
i.
Debugger
Features
3.1
A
sample multi-microprocessor system3.2
Control
ofmultiple processeson multiple processors3.3
Current
stateinformation
3.4
Tracing
3.5
User
interface
3.6
Conclusion
4.
Functional
specificationfor
DEBUG
4.1
Debug
configuration4.2
The
workstation4.3
The
ConfigurationTool
4.4
Control
ofmultiple processes on multiple processors4.5
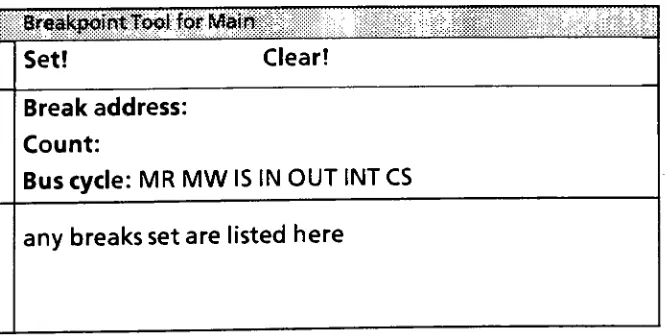
Setting
breakpoints
4.6
Tracing
4.7
Display
&
patching
4.8
Conclusion5.
System
specificationfor
DEBUG
5.2
Compiler
generatedtables
5.3
Using
the
correspondenceand symboltables5.4
Conclusion
6.
Conclusion
Bibliography
Appendix
A. DEBUG
Users'Guide
1.
Intoduction
Today,
many industrial
real-time control systems use multiple networked microprocessorsto
control and monitortheir
processes.Software
development for
such systemsis
madedifficult
by
the
real-time constraints and parallelprocessing
inherent in
such systems.This
report explores softwaredevelopment,
in
general,
anddebugging,
in
particular,
of networked real-time multi-microprocessor systems.It
describes
adebugger for
suchsystems,
discusses its functional
characteristics andsystem
design
and suggests possible enhancements.In
the
rest ofthis
reportthe
microprocessorsin
the
controlloop
are referredto
astarget
microprocessors ortarget
processors.1.1
Multi-microprocessor
systemsSoftware
development
in
networked real-time multi-microprocessor systemsis
greatly influenced
by
the
following
characteristics of such systems:1.
absence of peripherals.The
processorsare embedddedin
othermachinery
andlack
conventionalIO
andsecondary
storagedevices like
keyboards,
display
terminals
anddisk
drives. The
codethey
executeis
stored onROM.
2.
real-time constraints.These
systems must respondreliably
within guaranteed responsetimes to
inputs
ofvarying
priorities.The
microprocessors musttemporarily
suspend currentactivity
to
serviceinputs
ofhigher
priority.This
requirementimplies
that
apriority
driven multi-tasking
environmentis
the
most natural choicefor
real-time control systems.Polling
is
also usedto
service requestsin
real-time controlsystems;
however,
this technique
is
somewhatinflexible
andonly
applicablefor
selectedapplications.This
report concentratesonmulti-tasking
environments.3.
extensiveIO
andinter
processorcommunications.These
systemsinterface
with avariety
of externalinterfaces
like
AD
&
DA
converters and various sensors andinstruments.
Interprocessor
communicationsalsohave
to
be
serviced.4.
parallelprocessing
or concurrency.Two
levels
of parallelism are presentin
such systems:(i)
multiple processors onthe
network runin
parallel;
(ii)
multipletasks
run
concurrently
within a single processor.Concurrency
raises problems ofresourcesharing
anddeadlock
management.5.
errorhandling.
Real-time
systems must notonly have
the
capability
to
detect
1.
Introduction
they
can.For
example,
it is
unacceptablefor
an aircraft guidance systemto
terminate
onreceiving
abad
coordinateinput.
Instead,
it
shouldlog
the
errorcondition, take
correctiveaction,
e.g.,
rejectthe
bad
coordinate and waitorrequestfor
another,
and continue processing.The
degradation
in
performance andreliability
causedby
an error conditionhas
to
be
minimal.Debugging
networked real-time multi-microprocessor systemsis
complicatedby
the
following:
1.
Multiple
target
processorsmay
need simultaneousdebugging.
Attaching
independent
debuggers,
each withits
ownmonitor, to the
multipletargets
makesit
difficult
to
observe andsynchronizethe
activities ofthe targets.
2. The
debugging
aids cannot run onthe target
processor.The
target processors,
typically, do
nothave
sufficient resourcesto
support adebugger
and evenif
they
do,
running
the
debugger
onthe targets
may
alterthe
nature oftiming
relatedbugs,
commonin
real-timesystems.3.
Breakpoints
are oflimited
usein
isolating
difficult
to
reproduce,timing
relatedbugs.
Extensive
tracing
is
oftenthe
only
way
to
locate
suchbugs,
particularly
whenmultiple processors are
involved.
Tracing
requireslarge
amounts ofdisk
storage,
and/
ordynamic
memory.4. The
softwarefor
such systemsis
normally
developed
on a separatecomputer anddown loaded
to the target
processor.To
fix
abug
andtest the
fix,
the
programmerhas
to
editthe
sourcefile,
compile andbind
the
program onthe
softwaredevelopment
computerandthen
download
the
objectfile
to the target
processor.Most
programmersfind
it
much simplerto
directly
patchthe target
memory
withthe
fix.
This
leads
to
frequent patching
ofthe target
processormemory
during
testing, thus,
creating
a major problemin
sourcefiles
maintenance.1.2 Networked
real-time multi-microprocessordebuggers
Until
recently,
most real-time control systems weredebugged
using
logic
analyzersand oscilloscopes.
This
is
becoming
moredifficult
asthe
programsbecome
larger
and more complex.Currently,
there
is
agrowing interest in
developing debugging
tools
for
networked real-time multi-microprocessordebuggers.
[Lesh
78]
describes
a system madeup
of multiple minicomputerscommunicating
1. introduction
synchronized
interrupt
that
occursevery 2.5
milliseconds on allthe
processors.This
interrupt,
known
asthe
RTI
(Real
Time
Interrupt),
causes each processorto
begin
executing
the
tasks
in its
queue.The underlying
assumptionis
that
no set of queuedtasks take
morethan
afraction
of2.5
ms.Messages
originating
during
atick,
or2.5
msstep,
are not consumed untilthe
nexttick, thus, simplifying
the
timing
ofmessage
transmissions.
The
machines canbe synchronously halted
atthe
end ofeach
tick,
after whichinterprocessor
results canbe
examined,
bugs
detected,
processor states
modified,
if
necessary,
andprocessing
resumed.All
bus
transfers
are recorded
in
both
the
originating
andconsuming
processors;
this
assistsin
detecting
communications relatedbugs.
A
copy
ofthe
debugger
resides on each processor.In addition, the
debugger
provides conventionalbreakpoints for
analyzing
problems on a single processor.[Greg
82],
[Conte
&
Greg
80]
describe
adebugger for
avery
generalpurpose,
message
passing,
multi-processor system.The
target
systemis
madeup
of multipleclusters,
eachhaving
multiple processors.Each
processorin
a clusterhas
local
memory,
divided into
private and global parts.The
globalmemory is
accessibleto
all other processors
in
the
clustervia a globalbus.
Inter-cluster
communications arethrough
seriallinks.
Debugging
in
this
systemtakes
place attwo
levels.
The
upperlevel is
a singledebugger
task that
runs on one ofthe target
processors and provides a central user-interface.At
the
lower
level,
identical
debugger
tasks
run on eachtarget
processor.The
debugger,
as a whole, provides commandsto
load,
run,
suspend anddelete
tasks
andto
display
and patchmemory
and registers.It
alsohas
commandsto
simulate messagetransmission
between any
two tasks.
There is
no symbolic
debugging.
The
debug
systemdescribed
by
[Haney
80]
is
alsodouble layered.
The
top
debugging
layer
runs on a single minicomputer with aninterface
to the
lower
debugging
layer.
This layer
provides symbolicdebugging
and a commonuser-interface.
The lower layer is
madeup
of multipledebug
hardware
modules,
each withits
own consolefor
userinteraction. Each
debug
module canbe
connectedto
a maximum of8
microprocessors.The
debugger
provideshigh
speed systemloading,
high level
symbolicdebugging,
commandfile
capability,
breakpoints
andtracing
with
triggering
between
processors.When
abreakpoint
is
hit,
a single processor orall
the
processorsmay
be
halted.
The lower
level
debug
modules provideRAM
to
1.
Introduction
The
preceding
examplesillustrate
three
vastly different
approachesfor
debugging
networked real-time multi-microprocessorsystems.
In
eachcase, the
debuggers
aretailored to
a specifictarget
system and are not general purpose.This
report attemptsto
define
a more general purposedebugger for
networked real-timemulti-microprocessor systems.
1.3 Project
overviewDEBUG,
the
debugger,
described
in
this report,
was conceived as a part of a workstationbased
softwaredevelopment
environmentfor
networked,
real-time multi-microprocessor systems.The
projectincluded
the
definition
of ahigh level
language
andthe
development
ofa compiler and abinder for
that
language.
Most
of
the
debug
hardware
wasdesigned
earlier and was available atthat time.
The
definition,
design
andimplementaion
ofthe
debugger lasted
two
years.There
were
four
programmers onthe
projectduring
most ofthe
definition
anddesign
phases.I
joined
the
group
during
the
early
stagesofthe
project.I
played a passive roleduring
most ofthe
definitions
phase,
attending
numerouslong
meetingswithpotential
users,
adjusting
to
the
company
jargon
andlearning
a newprogramming
environment and
language.
My
contributionsdid
not come untilthe
design
phasewhen
I
designed
the
interface between
the
high level language
andthe
debugger
and participated
in
the
design
ofthe
other pieces.One
other programmer andI
did
most of
the
implementation, testing
andinitial
product release.The
debugger
wasimplemented in 1983
and animproved
versionis in
usetoday.1.4
Objective
and outlineThis
reportdiscusses
the
problemofsoftwaredevelopment
anddebugging
in
multi-microprocessor systems.It
describes
adebugger
implemented
for
such a system anddiscusses
its
merits anddemerits.
The
reportis
organized asfollows:
Chapter 2
describes
programming
language
features for
multi-microprocessor systems.The
relationship
between programming
languages
anddebugging
is
asodiscussed.
Chapter 3.
lists
allthe
features
that
aredesirable for
an"ideal"
debugger.
Chapter
4.
gives afunctional
description
ofDEBUG
and comparesit
to the
ideal
debugger
ofl. Introduction
2.
High
Level Language
and
Debugging
A
goodhigh
level
language
is
a great assetin
writing,
debugging
andmaintaining
most software systems.
The
functions
that
a systemis
to
perform and otherdesign
level decisions
are often affectedby
the
language
in
whichit is
to
be
written.This
is
especially
true
in
the
development
ofdistributed
real-time systems.A
language
suitable
for
distributed
real-time systems shouldhave
allthe
features
of a goodconventional
programming language.
In
addition,
it
shouldhave
special constructsto
representthe
distributed
and real-time aspects ofthe
system.This
chapter exploresthe
language
characteristicsthat
aidin
the
design,
development
andtesting
of networked real-time multi-microprocessor systems.2.1 Definitions
High Level
Language:
A
high level language is
an abstract modelin
whichdata
andoperations on
that
data
canbe
specifiedin
problem-oriented ratherthan
machine-oriented
terms.
Data
objects are referredto
by
user-defined names ratherthan
by
memory
addresses.Operations
onthe
data
objects are specifiedin
terms that
aremore
easily
understoodby
the
human
user.Each
suchhigh level
operation,
typically, breaks down into
multiplecomputerinstructions.
High Level
Debugging:
High
level
debugging
is
moredifficult
to
define.
In
low
level
debugging,
the
useris
provided with enormous quantities of machinelevel
data from
which meaningfulinformation
mustbe
gleaned.In
high
level
debugging,
this
meaningfulinformation
is
extractedby
the
debugger,
thus,
the
user
is
ableto
directly
debug
the
problem ratherthan
sifting
through
mounds ofmachine
details
to
reconstructit. That
is,
high
level
debugging
is
using
tools to
filter
and
interpret
the
data
providedby
alow
level
debugger
andto
presentit
to the
user
in
aformat
suchthat the
user can workin
the
problemdomain
ratherthan the
solution
domain.
Ideally,
whencarrying
outhigh level
debugging,
the
useris
notHign Level
Language
andDebugging
2.2 Language
requirementsfor
networked real-time multi-microprocessor systemsIn
real-timesystems,
unlike othertypes
of computersystems, the time
interval
for
an
input
to
be
servicedis
of primeimportance.
A typical
system willhave different
categories of
inputs,
eachhaving
to
be
serviced withdifferent degrees
of urgency.Consider,
for
example,
adistillation
column controlledby
a real-time computersystem,
where one ofthe
inputs
to the
computeris
the temperature
ofthe
mixture.If
the
temperature
rises above safelevels,
the
computerhas
to
respondvery
quickly
by
turning
offthe
heater
and/orturning
onthe
cooling
system.The
responsehas
to
be
almostimmediate.
However,
if
the temperature
was still withinthe
normalrange, the
system cantake
longer
to
respond.This
requirementfor servicing
different inputs
withindifferent
fixed
time
periodslargely
determines
the
language
requirements
for
a good real-timelanguage.
The
task
ofmonitoring different inputs
andresponding appropriately
is
inherently
non-sequential.
When the
systemis responding
to
aninput,
another one of ahigher priority may
occur,
causing
the
systemto
suspendthe
currentprocess,
assignit
alower priority
and servicethe
newinput.
In
additionto
controlling
inputs,
realtime
systemsmay
perform suchfunctions
asmanaging
an operatorinterface,
logging
data for future
analysis andproviding
statisticalinformation
from
the
logged data.
Therefore,
morethan
onetask
canbe
active atany
time.
Such
systemsare
best
conceptualizedasmulti-tasking
systemsin
which eachtask
runs as a processwith a given priority.
A
language
suitablefor programming
real-time systemsshould
then
have
constructsto
specify
independent
processes,
possibly running
in
parallel,
andthe
ability
to
assign prioritiesto them.
Another
important language
criterionis
the
ability
to
handle
exceptionseffectively,
without
comsuming
excessive resourcesfor
exceptionchecking
during
normaloperation.
Since
timely
handling
ofIO
is
the
single mostimportant
function
ofrealtime systems,
a good real-timelanguage
should provide eitherhigh level
constructsorpre-written
interfaces to
supportIO.
Distributed
systems must providefor
inter-processor
access.In
tightly-coupled
High
Level Language
andDebugging
systems should provide constructs
that
allow processesrunning
ondifferent
processorsto
communicate with each other withoutcompromising data-integrity.
Many
ofthe
language
requirements mentioned above are commonto
both
singleprocessor as well as
distributed
real-time systems.In
addition, the
language
must possessthe
qualities ofany
goodprogramming
language.
It
shouldhave
extensive compiletime
errorchecking,
including
strictdata-type checking
and extensive runtime
errorchecking
with extra codeinserted
by
the
compiler.It
shouldbe
well-structured and
readable,
thereby,
making it
easierto
locate
andfix bugs.
The
constructs providedby
the
language
shouldbe flexible
enoughto
naturally
expressthe
actionsdesired
by
the
programmer.The
constructs andfeatures
ofthe
language
shouldbe
simple and unambiguous.The
compilershould generate codethat takes
maximum advantage ofthe
features
ofthe
hardware
on whichthe
codeis
executed.At
the
sametime,
the
language
shouldbe
fairly
independent
ofthe
hardware
sothat
programs canbe easily
portedfrom
one machineto
the
other.Some
ofthe
requirementsin
the
previous paragraph are contradictory.For
example,
compilerinserted
runtime
errorchecking
codedecreases
the
runtime
efficiency
ofthe
program.As usual,
programming language design
amountsto
making
trade-offs
between desirable features
to
maximizethe
useability
ofthe
language.
2.3
Language
features
that
aidin
debugging
In
the
previoussection,
it
was shownthat
real-timeprogramming
is
characterizedby
multi-tasking, specialized exceptionhandling
andIO programming
and,
ahigh
level language for
such systems shouldhave
special constructsto
expressthese
features
naturally
and concisely.Such
alanguage
alsohas
a positiveimpact
ondebugging,
sinceimplementing
a programthat
closely
resemblesthe
design
resultsin
easierunderstanding
ofthe
programduring debug
time.
This
sectiondiscusses
language features
particularly
relevantto
debugging
distributed
real-time systems.Data Typing:
Until now,
real-time programshave
been
writtenin low
level,
weakly
typed
languages
that
allowedthe
programmerto take
full
advantage ofthe
machine'scapability.The disadvantage in
this
approachis
the
difficulty
in
insuring
2. High Level
Language
andDebugging
languages
aredeveloped,
the
justification for low
level,
weakly
typed
languages
diminishes.
New
programming
languages
for
real-time systems arestrongly
typed
and
their
compilers checkfor data
type
conformance.ADA
andMesa
[Geschke
77]
aretwo
suchlanguages.
Modularization: This
feature
allows alarge programming
problemto
be
splitinto
smallerparts,
ormodules,
which sharedata
and operations onthat
data.
The
modules canbe
compiledseparately
and puttogether,
orthey
canbe
written as one unit with each partmaintaining
its
properties.Here
we will concentrate on modulesthat
compile separately.Typically
a modulehas
two
parts-the
interface
specification andthe
moduleimplementation.
Modules
communicatethrough
their
interfaces.
These
are, essentially, templates
madeup
oftype, data
and proceduredeclarations,
but
not executable code.The interface
declarations
areimplemented
by
one or more program modulesthat
exportthe
interface.
Other
modules useitems
declared
in
the
interface
by
importing
it.
Modularization
aidsdebugging
in
many
ways.A
systemimplemented
as modules canclosely
resemblethe
design
level
breakdown
oftasks
andfunctions.
That
is,
atop-down
design
that
progressively breaks down
alarge
probleminto
smaller and smallerhierarchical
tasks
canbe implemented
by
programming
a modulefor
eachtask.
That
is,
design is
done
in
the
problemdomain,
yetthe
design level
relationshipsbetween
tasks
are preservedin
the
moduleimplementations
andthe
shared objectsin
the
design
aredefined
in
the
moduleinterfaces.
Therefore,
implementation
decisions
arebased
onthe
design
ratherthandesign
decisions
being
based
onthe
implementation. Separation
ofthe
interface
from
the implementation
makesthe
high level functions
ofthe
modules apparentwithouthaving
to
know
extraneousimplementation
details.
ZTHigh Level Language
andDebugging
To
someextent,
modularization organizes errorhandling.
All the
error conditionsanticipated
by
the
caller of a public procedure aredeclared
in
the
interface.
All
other error conditions arehandled
locally
withinthe
public procedure.This
formally
breaks down
the
errorhandling
responsibiltiesbetween
the
implementing
andthe
importing
modules andleads
to
fewer
instances
of neither moduleshandling
an errorconditionorboth
moduleshandling
the
same error condition.Modules
that
implement
often-usedprogramming
objects such asstacks,
lists,
string
to
number conversions andinput
parsers,
canbe
written anddebugged
andthen
used
repeatedly
in
many
projects.This
also ensuresthat
different
projects exhibituniform
behavior.
The
above pointsare quite general and are relevantto
both
conventional and realtime
programs.More
specificto
real-timeprograms,
modularization can providemutual exclusion
for
sensitivedata. (Refer
to the
next sectionfor
more on mutualexclusion.)
Access to
sensitivedata
is
restrictedby declaring
it
within a moduleratherthan
its interface.
Thus,
only
proceduresdeclared
in
the
modulehave
accessto the
data.
Restrictions
canthen
be
imposed
onthose
proceduresto
control accessto the
data.
Modularization
also aids communicationshandling
andIO
programming.
Device
specific,
special purpose modules canbe
writtenfor
IO
andcommunications
devices.
Once implemented
andtested
for
adevice,
a module canbe
usedby
multiple clients.The interfaces
exportedby
these
devices
canbe
standardized,
thereby,
reducing
the time taken
by
a programmerto
become
familiar
with adevice.
Multi-tasking:
A
computer systemis
saidto
be
capable ofmulti-tasking if it
canhandle
morethan
onetask
at a giventime.A task
here
refersto
achain of programcontrol - a process.
The
tasks
in
amulti-tasking
system executein
parallel,
interacting,
where necessary, with othertasks.
There
aretwo types
of multitasking.
In
one, the tasks
run on multiple physical processorssharing
commonmemory.
The
othertype
has only
oneprocessor,
onecurrently
activetask
andmultiple suspended
tasks.
The
following
discussion
appliesto
both
types
of multitasking.
Real-time
distributed
systems almost alwayshave multi-tasking
atthe
2.
High Level Language
andDebugging
There
aretwo types
ofinteraction between
tasks.
One
is
the
sharing
ofdata
between
tasks
andthe
otheris
the
synchronization of execution.Consider
two
tasks A
andB,
whereA
is
the
producer andB
is
the
consumer of somedata
x; then
xis
the
data
sharedby
A
andB.
For
the
producer-consumer relationto
function
correctly
B
has
to
be
told
when a new xhas been
produced,
soit
can use x.And
A
has
to
be
told
whenB
has
finished
consuming
xsoit
canfetch
or generatethe
nextx.
Therefore,
A
andB
have
to
communicateto
each othertheir
execution statesin
orderto
function
correctly,
i.e.
synchronization ofexecution.Further,
the
accessby
A
andB
to the
commonmemory
area wherexis
storedhas
to
be mutually
exclusive,
i.e,
mutual exclusion of shareddata.
Ensuring
mutual-exclusionfor data
access andproviding
process synchronization aretwo
very
important
features
ofmulti-taking
systems.One
major area of concernin
multi-tasking
systemis
error-handling.In
singlethread control,
if
some error situationoccurs,
it is
possibleto take
corrective action and proceed orstop
as appropriate.In
multi-tasking
systems,
either all processeshave
to
detect
all errorsor a processhas
to
have
away
ofaborting
other processeswhen
it
detects
an error(that
is,
it
mustkill its
childrenbefore dying).
Also,
to
ensuredata
integrity,
processeswaiting
on conditionshave
to
take
special action.Most
languages
providefeatures for aborting
processesbut
their
use andimplementation
aretorturous.
Mutual
exclusionfor
shareddata
access,
process synchronizationanderror-handling
make
multi-tasking extremely
complex.The
mannerin
which alanguage
implements
these
features has
greatimpact
ondebugging
programswrittenin
that
language.
Inadequate
supportfor
these
constructs will resultin
morebugs
whilecoding
and,
thereby,
additionaltime to
fix
them.Exception
Handling:
This
is
the
detection
of errorsin
computer systems andthe
actions
taken
to
deal
with them.Errors in
softwaresystemscanbe
broadly
classifiedinto
three
categories:(i)
low
level hardware
errors such as aparity
error whilereading
from disk/
memory,(ii)
low
level
software errors such as adivide
by
zero and(iii)
programming
orlogic
errors such as array-index rangeviolation.In
conventional programs,it
is
adequateto
output an error message and abort2. High Level
Language
andDebugging
must
take
actionsto
minimizethe
effects ofthe
error andcarry
on,
retaining
as muchfunctionality
as possible.In
many
cases of computer-controlledsystems,
atemporary
degradation
of performanceis
preferableto
a complete shut-down.In
multi-processorsystems, the
other processorsmay
needto
be
made aware ofthe
errorcondition.The
traditional
way
ofhandling
errorsis
to
checkfor
exception conditionsexplicitly,
where everthey
may
occur andtake action,
suchas,
simply
output a message and abortthe
program.However,
to
recoverfrom
the error,
other proceduresin
the
calling
sequencehave
to
be
told
aboutthe
error sothey,
in
turn,
cantake
corrective action.Each
procedure callmust,
therefore,
anticipate all possible errorsthat the
called proceduremay
encounter,
as well as pass notification of errorsback
to
its
calling
procedure.Another
disadvantage
is
the
time
spentchecking for
allthe
error conditionspossible, to
ensurethat
they
did
notoccur.The
newerlanguages
allow moreflexible
error-handling.When
an erroris
detected,
the
procedure can attemptto
rectify it
andproceed,
orit
candecide
to
propagatethe
errorto
its calling
procedure.The
errorhandling
codeis
separatedfrom
the
main-line code.Once
an errorhas been
handled,
proceduresthat
propagatedthe
error are given anopportunity
to
cleanup,
for
example,
free any
locally
allocateddynamic
storage.This
kind
ofexception-handling
allowsthe
mainline
codeto
concentrateonthe
more probablesituations.Exceptions
aredealt
withseparately.
The
written program moreclosely
resemblesthe
realproblem,
thus,
making it
easierto
debug.
IO
programming:IO
plays avery important
partin
real-time programming.Real
time
programsdrive
unusualIO
devices
such asanalog/digitalconverters,
digital
IO
portsandvariousinstrument interfaces. Although
mostgeneral purposehigh level
languages have
IO libraries
or modulesto
supportthe
standarddevices like
disks,
keyborads
and printers, until recently,the
most commonway
to
program a nonstandard
IO device
wasto
useassembly language.
Many
older real-timelanguages
2.
High Level
Language
andDebugging
Communicating
with10
devices
ofteninvolves
writing
valuesto
10
ports.Often,
acertain
bit
in
a certain porthas
to
be
setor reset.This
codeusually
looks something
like #5A.3
:=1.
For
valuesthat
are morethan
1
bit
long
this
is
even more complicated since a maskhas
to
be
usedto
clearthe
current value ofthe
bits
andthen
the
new value set.Instead,
a programmer shouldbe
ableto
define
ports asvariables and
bits
as qualifierswith a user-defined recordtype.
Values
canthen
be
assignedto
one or morebits using
the
field
namesdefined
in
the
recordtype.
Using
such a
feature,
#5A.3
: =1
wouldbecome
tempTimer.counterSelect
: =1
where "tempTimer"is
defined
as a port variable at#5A
and "counterSelect"is
the
qualifier
for bit
3.
Most
computer systems performIO
by
eithercontinuously
polling
eachIO
device
orby having
the
IO
device interrupt
the
mainprocessing
when needed.Interrupt
driven
systems are moretime
efficient and morecommonly
usedin
real-timesystems.
The
priorities ofIO
are also morenaturally implemented
withinterrupt-driven
IO.
In
suchsystems, the
IO
hardware
interrupts
the
CPU
whenit has
validinput
data
orhas
completed an output operation.These interrupts
have different
priorities attached
to them.
If
aninterrupt
of ahigher priority
occurs, the
CPU
suspends
its
currenttask
and servicesthe
interrupt.
Once
the
interrupt
is
serviced,
the
CPU
resumesthe
suspendedtask.
The
varioustasks
also needto
be
synchronized correctly.This
model meshesclosely
withthe
concept of processesdiscussed
earlier.A
language supporting
processesis
usefulin IO
programming.The
concept of modules andinterfaces
can alsobe
usedto
makeIO
programming
more understandable.A
programmer can provide aninterface
to
a class ofIO
devices
that
is
largely
device-independant.
The
implementing
module canthen
contain
the
device-dependant
portions.This
has
many
benefits.
The
module canbe
usedin
morethan
one applicationusing
similarhardware devices.
New
devices
canbe
added with minimum changesto the
interface
module.A
programmer cancommunicate with
IO
devices
throughthe
interfaces
withoutknowing
allthe
detailed
working
ofthe
devices.
In
additionto
all externalIO,
multi-processor systems needto
communicate with2.
High Level
Language
andDebugging
write
library
routines or aninterface
andexporting
modulesto
implement
communications.
Languages rarely
have
constructsfor
communications.High
level
IO
programming
makesit
easierto
implement
IO
intensive
real-timesystems.
This
reducesthe
number ofIO
errors made whilecoding
andthe
time
taken to
detect
them.
2.4
Language
andDebugging.
How
the two
are related.This
sectiondescribes
andbinds
the
relationship between
ahigh level language
anda
debugger.
It
alsointroduces
the tables that
mustbe
generatedby
the
high
level
language
compilerfor
ahigh level debugger.
These
tables
are referencedin
the
next
three
chapters.After
a moduleis
writtenin
ahigh
level
language,
it
is
compiled,
perhapsbound
with other system modules and
then
debugged.
An
integrated
development
systemin
whichthe editor, the compiler, the
binder
andthe
debugger,
all run onthe
samemachine
is ideal.
This
providesfor
bug
fixes
atthe
sourcelevel
ratherthan
patchesto target
memory.Incremental
compilers andbinders
are alsodesirable for
the
same reason.
They
reducethe time
it
takes to
make a sourcelevel
change and getit
running
onthe target system,
ready
to
debug.
The
speed andefficiency
ofdebugging
canbe
improved if
the
abstractions providedby
the
high level language
are available atdebug
time.
Otherwise,
afterprogramming
in
ahigh level
language,
the
user stillhas
to
depend
onmemory
dumps
anddetailed knowledge
of what resides where andhow
in
memory
to
debug
his
program.Symbolic
orhigh
level debuggers
preservethe
abstractions atdebug
time.
They
usethe
source and objectfiles
ofthe
high
level
language
to
provide specialdebug
features,
such as:(i)
the
ability
to
specify
abreak
pointby
pointing
to
aline
ofhigh
level
code,
(ii)
oncethe
break
is
taken,
the
ability
to
look
atdata
by
referencing
the
high
level
names of variables and(iii)
the
ability
to
display
the
execution pathin
high
level
language
statementsusing
data from
the trace
buffer.
To
providethese
features,
the
compiler andthe
binder
must generate specialtables, for
the
debugger.
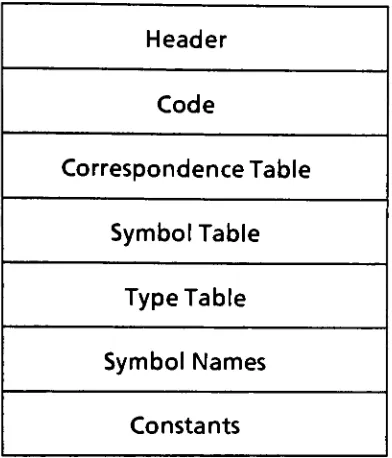
Two
tables arecommonly
generated:the
correspondencetable
which^.nign Level
Language
andueougging
which contains
the
in
the
objectfile
offset,
size andtype
information
for
each symboldeclared
in
the
sourcefile.
The
compiler andthe
binder
calculate relative offsetsandthe
loader
convertsthese to
absolutememory locations
onthe target.
An
interpreter is
atool that
runsin
the
debugger
and allows a programmerto
specify
a sequence of actions muchlike
program statements.These
actions aredirectly
executedin
the
programdomain,
withoutbeing
compiled.Interpreted
actions
include
the
execution of procedures andthe
evaluation ofhigh
level
language
expressions.Thus,
a programmer can experimentby
executing
portionsof
his
sourcecode with aninterpreter
withoutrecompiling,
rebinding
andreloading
his
program.The
points enumeratedin
this
section makeit
clearthat,
to
be
useful,
adebugger
has
to
workclosely
withthe
high level language
in
whichthe
programsbeing
debugged
arewritten.2.5 Conclusion
High
level languages
allow programsto
be
writtenin
aform
that
is
moreeasily
understood
by
human beings
than
raw machine code orassembly language.
Languages
that
support real-time systemshave
to
provide additionalfeatures
to
cover
the
special needs of such systems.Exception
handling,
multi-tasking
andIO
programming
are afew
such specialfeatures.
A
gooddebugger
mustinterface
withthe
language
in
whichthe
programsare written.A
programmer canthen
usethe
source and object
files
in
conjunction withthe
debugger
tools to test
his
program.Like
languages,
real-timedebuggers have
to
be
different from
conventional3.
Debugger
Features
The
previous chapterdealt
withthe
impact high level programming
languages,
tailored
to
implement
real-timesystems,
have
ondebugging
such systems.This
chapter concentrates on
the
debugging
side ofthe
problem.Real-time
systems,
especially
onesthat
run on multipleprocessors,
need specialdebuggers.
Multi
tasking
andinterprocessor
communicationsintroduce
timing
relatedbugs
that
aredifficult
to
duplicate
anddebug.
The
target
configurationmay
consistofmorethanone
type
of processor withvarying
debug
requirements.Debugging
has
to
be done
from
a remotehost for
two
reasons:(i)
the targets
oftendo
nothave
the
resourcesto
support adebugger;
and(ii)
it is
convenientto
debug
multiple processorsfrom
asingle user console.
There
are no standard proceduresfor
developing
andtesting
multi-microprocessorsystems.
Installations
evolvetheir
owntechniques
overthe
years.This
chapterdescribes
a generaldebug
hardware
configurationfor
networked real-time multi-microprocessor systems.This
is
followed
by
adiscussion
ofthe
softwarefeatures
that
assistin
debugging
such systems.Real-time
tracing
of processorstate,
avery
important
debugging
aidfor
multi-processorsystems,
is
coveredin
detail.
User-interface features
that
aiddebugging
are alsodiscussed.
3.1 A
samplemulti-microprocessor systemReal-time
systems aredesigned
to
control and monitor reallife
processes.They
control processes
like
space craft navigation andlandings,
weapons control andmedical
instrumentation.
There
arethree
relevant partsto
such systems:(i)
the
system
being
controlled -thespacecraft, the
weapon orthe
medicalinstrument, (ii)
the
controlhardware
and(iii)
the
control software.These
parts areusually
developed
in
parallel.The
systembeing
controlledmay
notbe
ready in
time to
startsoftwaretesting.
Even
if it
wereready,
it is
not advisableto
starttesting
onit,
asthe
untested software
may
seriously
damage
the
system.Simulators
are usedto
fill
the
gap.
A
simulatoris
a general purpose systemthat
canbe
programmedto
respondwith prespecified output values
to
a set of prespecifiedinputs.
Typically,
softwaredebugging
begins
on a simulator as soon asthe
controlhardware,
in
the
form
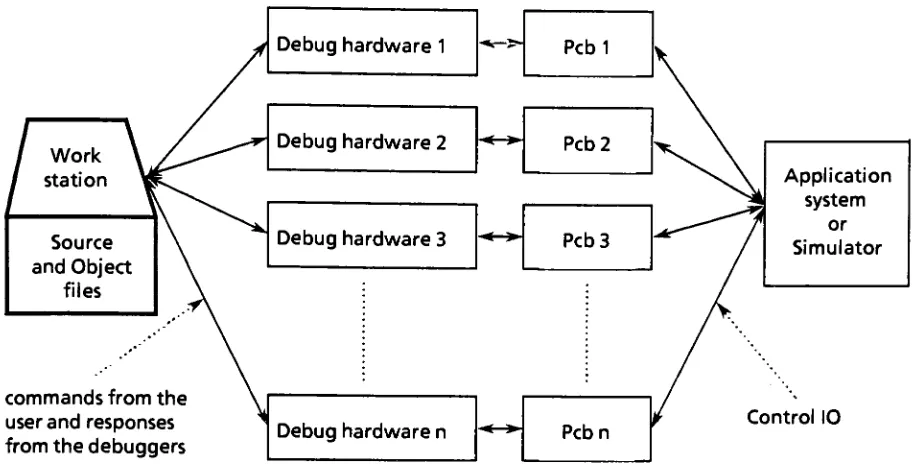
of5. ueDuggeri-eatures
Work
station
Source
and
Object
files
commands
from
theuserandresponses
from
thedebuggers
Debug
hardware
1Debug
hardware
2Debug
hardware
3Pcb1
Pcb2
< > Pcb3
Debug
hardware
n PcbnApplication
system
or
Simulator
ControlIO
Figure
1.
The
debug
hardware
configurationThe
microprocessors onthe
pcbs are replaced within-circuit
emulators(ICE)
during
the
debug
phase.In-circuit
emulators simulate allthe
operations ofthe
CPU
that
they
replacewith additionalcircuitry
to
monitorthe
CPU. The
additionalcircuitry is
capable of
(i)
detecting
the
beginning
of eachinstruction
sequence(ii)
suspending
instruction
execution at a given pointfrom
where execution canbegin later
(iii)
performing
simulatedmemory
andIO
read and write operations and(iv)
recovering
the
contentsofCPU
registers withoutdestroying
the
contents.Before ICE
modulesbecame
popularthe
debugger
andthe
codebeing
debugged
had
to
residein
the
same microprocessor.
They
had
to
sharethe
same resourcesprocessors, memory,
registers and
IO
- andtake
special careto
keep
outofeach othersway.A typical
debug
hardware
configurationis
shownin
figure
1.
The
pcbsfor
the
system under
design
arehooked
up to
a simulator orthe
actual systembeing
controlled.
The
pins ofthe
processors orICE
modules are connectedto
processorspecific
debug
hardware
such aslogic
analyzers.There
is
one processor specificdebug
hardware
module*or
each processor.These interpret
the
valuespassing
through
the
pinsofthe
processor.All the
debug
hardware
modules arehooked
up
[image:24.526.40.496.67.303.2]a. i^euuyytM rediures
hardware
which,
in
turn,
controlsthe target
processors.Once
the
hardware
systemis
setup, the
usersits atthe
workstation anddirects
the
debug
process.The debugger running
on a remote processorhas
several advantages:(i)
the target
processors need nothave
additional resourcesto
support adebugger,
(ii)
the
debugger
cannot alterthe
problembeing
debugged
and(iii)
the
code undertest
cannot corruptthe
debugger.
The
otheradvantage,
from
the
userperspective,
is
the
presence of a central consoleto
monitor allthe targets.
The
workstationhas
the
source and objectfiles
necessary
for high level
debugging.
The
objectfiles
areloaded into
target
memory
using
eitherthe
debugger
or a separateloader.
If
aloader is
used, the
names andload
addresses ofthe
objectfiles
areinput
to the
debugger.
In
additionto the
applicationscode,
eachtarget
is
loaded
with a runtime
executive.The
runtime
executive provides systemlevel
functions,
such asensuring
mutual exclusion andmanaging
communications,which areusually
common acrossmany
projects.As
aresult,
once an executiveis
developed
andtested, it
is
usedin
many
projects.The
nextstep,
afterdown-loading
the
programsinto
the
targets,
is
to
startthe
targets.
Depending
onhow
a multi-processorsystemis
coupled,
allthe targets
may
be
startedsimultaneously
withtheir
clockssynchronized,
or a"master"
processor
may be
startedfirst.
In
a"loosely
coupled"
system, the
processors areindependent
ofeach other andcan
be
startedin
any
order.3.2
Control
of multipleprocesseson multipleprocessorsOnce
the targets
are running,the
programmer setsup test
conditions onthe
simulator orthe
actualhardware
and observesthe
results.Actual
debugging
starts whenthe
observed outputis
notthe
desired
one .Breakpoints
are commandsto
the
debugger
to
halt
atarget
when a set of conditionsaretrue
and are valuablefor
analyzing
aberrant programbehavior. The
program stateinformation is
preserved whenthe
targethalts
so thatthe
user can(i)
analyzethe
current state and(ii)
resume
from
the
breakpoint
after analysis.Breakpoints
are most usefulin
analyzing
"single
path"
bugs,
whereit is
possibleto
i. uwuuyyyr
i-yaiurtis
alters
the
problem.Despite
this
deficiency,
they
are usedextensively
in
debugging
real-time systems.
By
setting
breakpoints
andexamining
the
current stateinformation,
the
user can examine probable causesfor
eventiming
relatedbugs
and,
thereby,
make more selectivedecisions
onhow
to
proceed withthe
debugging.
Breakpoints
areusually
set atthe
beginning
of machinelevel instructions
and causethe
targets to
halt just
before
executing
the
specifiedinstructions.
There
aretwo
ways of
specifying
a machinelevel instruction:
the
actualhardware
addresswherethe
instruction
is
stored orits location
in
a source module whichis
then translated
into
ahardware
address.The
latter
methodis
superior sinceit
eliminatesthe
needfor
the
userto
look
up
the
hardware
addresses ofinstructions in
load
tables.
In
machines with paged
memory, this
canbe
quitetedious.
Other
conditionsfor
breaking
canbe
an attemptto
writeto/
readfrom
a specifiedmemory
location,
registeror
IO
port.U$er
interface
is
akey
factor
in
setting breakpoints.
In
traditional
TTY type tools the
user
had
to
type
in
a source module namealong
with aline
numberor a procedurename
to
specify
a sourcelevel
break.
Some
debuggers
acceptedbreaks
only
atentry
to
procedures.The
newerwindowformat
tools
are more naturalto
use.To
set abreakpoint,
the
userloads
the
source codein
a window andpoints,
with adevice
such as
the mouse, to
aninstruction
in
that
window and selects a commandfrom
amenu.
Sometimes
more elaborateconditionsfor
setting
abreakpoint
are needed.Some
ofthese
are(i)
break
aftercycling
through aloop
ntimes
(ii)
break
at a source positiononly
if
specified procedures arein
the
call stackin
a specified order or(iii)
break
at asource position
only if
a relational conditionis
true.Some
multi-processordebugging
systems provide cross processorbreaks
whereit is
possibleto
stop
andexamine target
A
whenthe
break
conditions specifiedfor
target
B
aretrue.
This
feature is
neededfor
systems where allthe
othertargetsin
the
network continuerunning
when a targethalts
on abreak.
On the
otherhand,
this
is
the
default
in
a. uyuuyyyi r-udiurys
3.3 Current
stateinformation
On
reaching
abreakpoint,
the
useris
interested
in
the
current state ofthe program,
that
is,
the
codelocation
where execution stoppedandthe
state of allthe
variables,registersand other processes at
that time.
This
sectiondiscusses debugger features
that
aidin analyzing
the
current state and provide ways ofproceeding from
the
break.
The
commandsthat
follow
demonstrate
these
features
andmay be
implemented
on aTTY
or a window orientedinterface. User
interface
is
coveredin
the
nextsection.Select
processor:In
a multiprocessor systemthe
user mustfirst
select atarget to
concentrate on.
In
a window orienteddebugger it
may
be
possibleto
work onmultiple processors
simultaneously
by bringing
up
multiple windows, onefor
eachtarget.
List
processes:This
commandlists
allthe
processesthat
arein
the
processqueue,
including
those
waiting
on conditions.Each
entry
consists ofthe
processnumber,
the
sourcemodule, the
process name andits
current state(active
or waiting).The
userselects a process
from
the
list
and proceedsto the
nextstep in
debugging.
In
awindow oriented system
it may be
possibleto
select morethan
one processby
bringing
up.a windowfor
each process.Display
stack:This
commanddisplays
the
exact address and/or sourcelocation
where
the
processhalted
and setsthe
currentcontext.The
currentcontext,
whichis
very
similarto
scoping in
high
level
languages,
defines
the
variables accessibleto
the
process atthe
sourcelocation
at whichit halted.
The
debugger follows
the
same
scoping
rules asthe
high level language
usedto
writethe
program.Therefore,
it
is
possibleto travel up the
stack of procedures.The
current contextchanges at each
level
to
include
variables available atthat
level
andto
excludethose
declared
in
the
lower level.
Window
orienteddebuggers
canload
the
sourcemodule
in
whichthe
processis
defined,
selectthe
statement and setthe
current contextwherethe
processis
currently
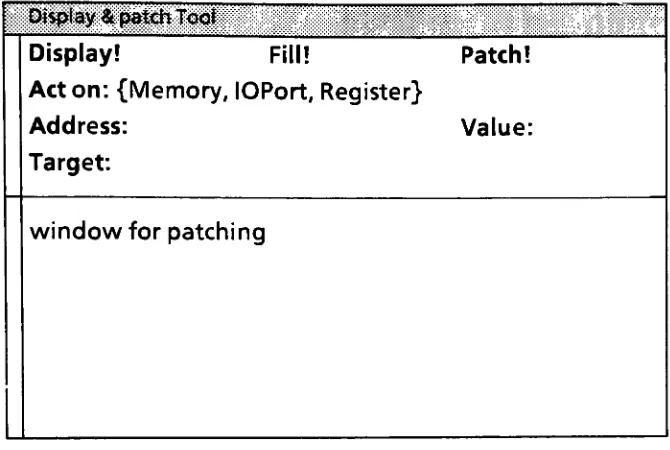
waiting.Display
and patch memory:This is
abasic
feature
in any
debugger.
The
user canaccess
any
memory location
by
specifying its memory
address.Symbolic
debuggers
j. ueuuyyei rydiuiys
user
does
nothave
to
know
the
hardware
addressesorthe
machine representationsfor
the
data
items.
Only
variablesthat
aredefined
in
the
current context are available.Also,
the
usercan assign valuesto
data items using
a subset ofthe
syntax providedby
the
sourcelanguage,
as well as"patch" ormodify
codein
memory.The
latter
case,
however,
may
requirethe
userto
be familiar
withthe
machinerepresentations of various
instructions.
Attach
keystrokes:
Another
usefulfeature
in
adebugger
is
the
ability
to
specify
aninstruction
stream or commandfile,
to
be
executedby
the
debugger,
after abreakpoint is hit.
Each
breakpoint
or cyclestep
canhave
its
own commandfile.
This
feature is
often usedin
test
situations where abreakpoint
is
expectedto
be hit
many
times.
When
the
breakpoint
is
hit,
the
debugger
executesthe
instruction
stream whichmay include
displaying/patching
data items
andproceeding
or cyclestepping
through the
code automatically.This
allowsthe
userto
setup the
instruction
streams,
startthe
system and returnlater
to
analyzethe
information
displayed
by
the
debugger.
After
analyzing
the
currentstate, the
user can(i)
restartthe
program atthe
breakpoint,
thus,
executing
it
to
anotherbreakpoint
or(ii)
cyclestep
the
programone
instruction
at atime where,
aftereachstep,
controlis
returnedto the
debugger
or
(iii)
invoke
a procedure callfrom
the
debugger
asif
the
procedure call wascodedin
the
source module atthe
breakpoint.
Another
optionis
to
discontinue
the
debug
session.Before
discontinuing
asession, the
usermay
save patchesto target
memory
for later
use.The
patches are saved asfiles
onthe
remotehost.
3.4
Tracing
Bugs
that
cannotbe
consistently
reproduced are oftentiming-related.
They
are uniqueto multi-tasking
systems and showup
only
when a set ofevents,
controlledby
two
ormore paralleltasks,
happen in
acertain timesequence.A
program with a timing-relatedbug
may
workcorrectly
some ofthe time
andfail
at others.These
aredifficult
to
locate
since(i)
they
arehard
to
reproduce and(ii) they
involve
interaction between
multiple tasks which needto
be
analyzed simultaneously.Tracing
is
the
most effective toolin analyzing
suchbugs.
Tracing
is
also usefulin
debugging
themorecommon"single
j. uyuuyyyi
rudiinys
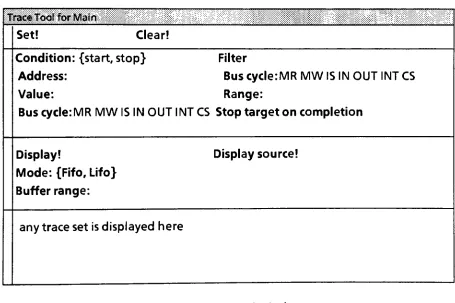
Tracing
is
the
periodicmonitoring
ofthe
status of one or more processorbuses,
usually the
address andthe
data
buses,
andstoring
the
collectedinformation
in
abuffer. Trace
buffers
arefinite
in
size.Once
the
buffer fills
up,
eitherthe
tracing
stops or
the
data is lost
on aFIFO
basis.
A
trace
entry is
a set ofbus
values capturedin
one period oftracing.
A
trace
buffer
containsthe
history
oftraffic
onthe
buses
for
some period oftime.
This
data
canbe
usedto
investigate
bugs.
Tracing
is
usually
done
using
logic-analyzers.
These
are externaldevices
that
areconnected
to the
pin-leadsofthe
microprocessorundertest.
They
have
a setofkeys
and a small
display
panelto
acceptcommands anddisplay
resultsto the
user.Logic
analyzers
do
nothave
the
software andthe
disk
spacenecessary
to
supporthigh
level
debugging.
To
provide sourcelevel
symbolicaccess, the
logic
analyzer mustbe
interfaced
to
ahost
machine.Three
command parameters are requiredto
setup
atrace:
whento
startthe
trace,
when
to
stop
the trace
and whatto
storein
the trace
buffer.
Start
andstop
conditions
vary
widely
in
complexity,
depending
onthe trace
hardware.
They
canbe
as simple as physical switches onthe
hardware.
At the
other end ofthe
spectrum,
they
canbe
complexlogical
conditionswithseverallevels
of nesting.Examples
ofstart andstop
conditions are:(i)
the target
being
traced
is
started orstopped;
(ii)
physical switches areturned
on oroff;
(iii)
something
is
writtento
aspecified
location
onthe
target;
(iv)
a specified valueis
writtento
alocation
onthe
target;
(v)
severalinstructions,
identified
by
their
memory
addresses,
have
allbeen
executed
in
a given order and(vi)
the trac