InTrans Project Reports Institute for Transportation
7-2012
Development of Performance Properties of
Ternary Mixtures: Field Demonstrations and
Project Summary
Peter Taylor
Iowa State University, [email protected]
Paul J. Tikalsky University of Utah
Kejin Wang
Gary Fick
Xuhao Wang
Follow this and additional works at:http://lib.dr.iastate.edu/intrans_reports
Part of theCivil Engineering Commons
Recommended Citation
Taylor, Peter; Tikalsky, Paul J.; Wang, Kejin; Fick, Gary; and Wang, Xuhao, "Development of Performance Properties of Ternary Mixtures: Field Demonstrations and Project Summary" (2012).InTrans Project Reports. 93.
Development of Performance Properties of Ternary Mixtures: Field
Demonstrations and Project Summary
Abstract
Supplementary cementitious materials (SCM) have become common parts of modern concrete practice. The blending of two or three cementitious materials to optimize durability, strength, or economics provides owners, engineers, materials suppliers, and contractors with substantial advantages over mixtures containing only portland cement. However, these advances in concrete technology and engineering have not always been adequately captured in specifications for concrete. Users need specific guidance to assist them in defining the performance requirements for a concrete application and the selection of optimal proportions of the
cementitious materials needed to produce the required durable concrete. The fact that blended cements are currently available in many regions increases options for mixtures and thus can complicate the selection process. Both Portland and blended cements have already been optimized by the manufacturer to provide specific properties (such as setting time, shrinkage, and strength gain). The addition of SCMs (as binary, ternary, or even more complex mixtures) can alter these properties, and therefore has the potential to impact the overall performance and applications of concrete. This report is the final of a series of publications describing a project aimed at addressing effective use of ternary systems. The work was conducted in several stages and individual reports have been published at the end of each stage.
Keywords
Admixtures, Demonstration projects, Durability, Portland cement, Setting (Concrete), Shrinkage, Strength of materials, Mixture Design and Analysis, MDA
Disciplines
Development of Performance
Properties of Ternary Mixtures:
Field Demonstrations and Project Summary
Sponsored through
Federal Highway Administration (DTFH61-06-H-00011 (Work Plans 12 and 19)) Pooled Fund Study TPF-5(117): California, Illinois, Iowa (lead state), Kansas, Mississippi, New Hampshire, Oklahoma, Pennsylvania, Utah, Wisconsin; American Coal Ash Association, American Concrete Pavement Association,
About the National CP Tech Center
The mission of the National Concrete Pavement Technology Center is to unite key transportation stakeholders around the central goal of advancing concrete pavement technology through
research, tech transfer, and technology implementation.
Disclaimer Notice
The contents of this report reflect the views of the authors, who are responsible for the facts and the accuracy of the information presented herein. The opinions, findings and conclusions expressed in this publication are those of the authors and not necessarily those of the sponsors.
The sponsors assume no liability for the contents or use of the information contained in this document. This report does not constitute a standard, specification, or regulation.
The sponsors do not endorse products or manufacturers. Trademarks or manufacturers’ names appear in this report only because they are considered essential to the objective of the document.
Iowa State University Non-Discrimination Statement
Iowa State University does not discriminate on the basis of race, color, age, religion, national origin, sexual orientation, gender identity, genetic information, sex, marital status, disability, or status as a U.S. veteran. Inquiries can be directed to the Director of Equal Opportunity and Compliance, 3280 Beardshear Hall, (515) 294-7612.
Iowa Department of Transportation Statements
Federal and state laws prohibit employment and/or public accommodation discrimination on the basis of age, color, creed, disability, gender identity, national origin, pregnancy, race, religion, sex, sexual orientation or veteran’s status. If you believe you have been discriminated against, please contact the Iowa Civil Rights Commission at 800-457-4416 or the Iowa Department of Transportation affirmative action officer. If you need accommodations because of a disability to access the Iowa Department of Transportation’s services, contact the agency’s affirmative action officer at 800-262-0003.
Technical Report Documentation Page
1. Report No. 2. Government Accession No. 3. Recipient’s Catalog No.
DTFH61-06-H-00011 Work Plans 12 and 19
4. Title and Subtitle 5. Report Date
Development of Performance Properties of Ternary Mixtures:
Field Demonstrations and Project Summary July 2012 6. Performing Organization Code
7. Author(s) 8. Performing Organization Report No.
Peter Taylor, Paul Tikalsky, Kejin Wang, Gary Fick, Xuhao Wang InTrans Project 05-241
9. Performing Organization Name and Address 10. Work Unit No. (TRAIS)
National Concrete Pavement Technology Center Iowa State University
2711 South Loop Drive, Suite 4700 Ames, IA 50010-8664
11. Contract or Grant No.
12. Sponsoring Organization Name and Address 13. Type of Report and Period Covered
Federal Highway Administration U.S. Department of Transportation 1200 New Jersey Avenue SE Washington, DC 20590
Final Report
14. Sponsoring Agency Code TPF-5(117)
15. Supplementary Notes
Visit www.cptechcenter.org for color pdfs of this and other research reports. 16. Abstract
Supplementary cementitious materials (SCM) have become common parts of modern concrete practice. The blending of two or three cementitious materials to optimize durability, strength, or economics provides owners, engineers, materials suppliers, and contractors with substantial advantages over mixtures containing only portland cement. However, these advances in concrete technology and engineering have not always been adequately captured in specifications for concrete.
Users need specific guidance to assist them in defining the performance requirements for a concrete application and the selection of optimal proportions of the cementitious materials needed to produce the required durable concrete. The fact that blended cements are currently available in many regions increases options for mixtures and thus can complicate the selection process. Both portland and blended cements have already been optimized by the manufacturer to provide specific properties (such as setting time, shrinkage, and strength gain). The addition of SCMs (as binary, ternary, or even more complex mixtures) can alter these properties, and therefore has the potential to impact the overall performance and applications of concrete.
This report is the final of a series of publications describing a project aimed at addressing effective use of ternary systems. The work was conducted in several stages and individual reports have been published at the end of each stage.
17. Key Words 18. Distribution Statement
fly ash—portland cement—silica fume—slag cement—ternary mixtures No restrictions. 19. Security Classification (of this
D
EVELOPMENT OF
P
ERFORMANCE
P
ROPERTIES OF
T
ERNARY
M
IXTURES
:
F
IELD
D
EMONSTRATIONS AND
P
ROJECT
S
UMMARY
Final Report July 2012
Principal Investigator
Peter Taylor, Associate Director
National Concrete Pavement Technology Center Iowa State University
Co-Principal Investigator
Paul J. Tikalsky
Professor of Civil and Environmental Engineering University of Utah
Authors
Peter Taylor, Paul Tikalsky, Kejin Wang, Gary Fick, Xuhao Wang
Sponsored through
Federal Highway Administration DTFH61-06-H-00011 Work Plans 12 and 19 FHWA Pooled Fund Study TPF-5(117): California, Illinois, Iowa (lead state), Kansas,
Mississippi, New Hampshire, Oklahoma, Pennsylvania, Utah, Wisconsin;
American Coal Ash Association, American Concrete Pavement Association, Headwaters Resources, Portland Cement Association, Slag Cement Association
Preparation of this report was financed in part
through funds provided by the Iowa Department of Transportation through its Research Management Agreement with the
Institute for Transportation (InTrans Project 05-241)
A report from
National Concrete Pavement Technology Center Iowa State University
TABLE OF CONTENTS
ACKNOWLEDGMENTS ... vii
INTRODUCTION ...1
PROJECT SUMMARY ...1
BACKGROUND ...2
OUTLINE OF RESEARCH STAGES ...3
LABORATORY STUDY ON PASTE AND MORTAR SUMMARY ...3
Introduction ...3
Setting Time and Mortar Flow ...4
Compatibility ...4
Air Void System ...4
Mortar Compressive Strength ...4
Heat Signature ...5
Shrinkage ...5
Sulfate Mortar Bar Testing ...5
Alkali Silica Reaction (ASR) ...5
LABORATORY STUDY ON CONCRETE SUMMARY ...5
Introduction ...5
Fresh Concrete Properties ...6
Compressive Strength ...6
Freeze-Thaw Resistance ...6
Scaling...7
Chloride Ion Resistance and Resistivity ...7
Shrinkage ...7
Hot and Cold Weather Testing ...7
Carbon Dioxide Emissions ...7
FIELD DEMONSTRATION SUMMARY ...7
Introduction ...7
Project Information ...8
Materials ...8
KEY FINDINGS ...24
OTHER IMPACTS ...25
GUIDE SPECIFICATION...27
LIST OF FIGURES
Figure 1. 0.45 Power curve of combined aggregate gradation ...11
Figure 2. Coarseness factor chart ...12
Figure 3. Tested unit weight vs. tested air content ...17
Figure 4. Initial and final setting time ...18
Figure 5. Calorimeter test results ...19
Figure 6. Free shrinkage (after seven days of moist curing) of prisms cast on site with job mixture ...20
Figure 7. Strains of stell rings resulting from concrete shrinkage ...21
Figure 8. Shrinkage stress-to-tensile strength ratio (cracking potential ΘCR) of restrained concrete rings with time ...22
LIST OF TABLES Table 1. Project introduction...8
Table 2. Chemical compositions and physical properties of cementitious materials ...9
Table 3. Fine and coarse aggregate types and properties ...10
Table 4. Mix proportions for each project ...13
Table 5. Summation of tests conducted either in the field or in the laboratory ...14
Table 6. Environmental conditions and fresh concrete property results summary ...15
Table 7. Calorimeter parameters ...19
Table 8. 28 to 7 days compressive strength ratio and compressive to splitting tensile strength ratio ...20
Table 9. Average strain rate factor ...22
Table 10. Visual condition of specimen ...23
ACKNOWLEDGMENTS
This research was conducted under Federal Highway Administration Pooled Fund Study TPF-5(117), involving the following state departments of transportation (DOTs):
California Department of Transportation
Illinois Department of Transportation
Iowa Department of Transportation (lead state)
Kansas Department of Transportation
Mississippi Department of Transportation
New Hampshire Department of Transportation
Pennsylvania Department of Transportation
Utah Department of Transportation
Wisconsin Department of Transportation
The researchers recognize the following partners for sponsoring this research:
American Coal Ash Association
American Concrete Pavement Association
Headwaters Resources
Portland Cement Association
Slag Cement Association
Finally, the researchers recognize the following companies for their in-kind contributions to this research:
BASF Admixtures
Elkem
Engelhard
Geneva Rock
Giant Cement
Holcim Cement
Keystone Cement
INTRODUCTION
Supplementary cementitious materials (SCMs), such as fly ash, slag cement, natural pozzolans and silica fume, have become common parts of modern concrete practice (PCA 2002;
Transportation Research Board 1990; ACI 2007). The blending of two or three cementitious materials to optimize durability, strength, or economics provides owners, engineers, materials suppliers, and contractors with substantial advantages over mixtures containing only portland cement. However, these advances in concrete technology and engineering have not always been adequately captured in specifications for concrete.
Usage is often limited because of prescriptive limitations or - legacy perceptions about how such materials will perform. In addition, some SCMs can exhibit significant variation in chemical and physical properties within a given source and, more commonly, between sources. Hence, current literature contains contradictory reports concerning the “optimal use” of supplementary
cementitious materials.
Users need specific guidance to assist them in defining the performance requirements for a concrete application and the selection of optimal proportions of the cementitious materials needed to produce the required durable concrete. The fact that blended cements are currently available in many regions increases options for mixtures and thus can complicate the selection process. Both portland and blended cements have already been optimized by the manufacturer to provide specific properties (such as setting time, shrinkage, and strength gain). The addition of SCMs (as binary, ternary, or even more complex mixtures) can alter these properties, and therefore has the potential to impact the overall performance and applications of concrete.
This report is the final of a series of publications describing a project aimed at addressing effective use of ternary systems. The work was conducted in several stages and individual reports have been published at the end of each stage.
PROJECT SUMMARY
The goal of this project was to provide the quantitative information needed to make sound engineering judgments pertaining to the selection and use of SCMs in conjunction with portland or blended cement. This information will lead to a more effective utilization of supplementary materials and/or blended cements, enhancing the life-cycle performance and cost effectiveness of transportation pavements and structures.
Identify how to best use ternary mixes when rapid strength gain is needed
Develop performance-based specifications for concrete used in transportation pavements and
structures
BACKGROUND
Engineers for state departments of transportation (DOTs) throughout the United States have used fly ash and slag cement as a partial replacement for portland cement in concrete production on a regular basis since the implementation of the Resource Conservation and Recovery Act in 1986. The Texas DOT (TxDOT) was one of the first states to conduct work to optimize the use of fly ash or slag cement to produce concrete mixtures that meet specific performance objectives (Tikalsky et al. 1988).
For many years, most states implemented a strategy that was meant to produce concrete mixtures that exhibit performance similar to mixtures employing only portland cement. With the growing availability of slag cement and silica fume, and the limited supply of fly ash in some markets, the selection of materials for any given job has become more complicated.
SCMs have the potential to dramatically improve the overall performance by increasing the longevity of the transportation infrastructure and decreasing the life-cycle cost of that
infrastructure. The introduction of fly ash, silica fume and slag cement in ternary combinations has periodically provided the following benefits to DOT and associated agencies:
Excellent long-term strength
Lower clinker and lower environmental emissions associated with concrete
Mitigation of Alkali Silica Reaction (ASR)
Mitigation of sulfate attack
Resistance to corrosion
Durability for highways and bridges
Reduction of construction issues related to binary concrete mixtures
However, the following technical issues may be periodically caused by the introduction of fly ash, silica fume, or slag cement:
Rapid slump loss
Unstable air content or inability to retain air
Uncontrolled cracking with late season paving
Overpasted or sticky mixtures
Inability to predict workability and set time in early or late season construction
constructability, ambient weather problems, and materials variability problems. However, some detailed discussion with appropriate materials vendors is needed to clarify the reasons for the real or perceived problems, and to design solutions that optimize multiple cementitious systems for transportation concrete.
OUTLINE OF RESEARCH STAGES
The first stage of this study consisted of laboratory experiments that examined the influence of combinations and proportions of cement, slag cement, silica fume, calcined kaolinite, and fly ash on specific performance properties of paste and mortar specimens (Tikalsky et. al., 2007). The testing program used a wide range of different materials and many different dosage levels.
Test results were evaluated to identify material combinations for potential optima in the various performance responses. Chemical admixtures (water reducers, air-entraining agents, and
accelerators) were included in this phase of the study to compare how setting time, water demand, and air content vary in ternary mixtures. Phase I results were used to help develop models for predicting the performance of ternary systems based on the materials in the system.
All of the materials used in the study were subjected to bulk chemical and physical testing in accordance with the appropriate ASTM International (ASTM) or American Association of State Highway and Transportation Officials (AASHTO) methods.
In addition, X-ray diffraction (XRD) was used to determine the minerals present in the bulk samples and selected paste specimens. Glass content of the various SCMs and blended cements was estimated using semi-quantitative XRD analysis.
The second stage used the information obtained from the paste and mortar work to select a range of materials and dosages to investigate the effects different combinations in laboratory concrete mixtures tested under cold, hot, and ambient conditions (Tikalsky et. al., 2011).
The materials used in both stages were identical so that the mortar test results could be directly compared to the test results obtained from concrete test specimens.
The third stage of the project was to assist states in constructing pavements and structures using ternary mixtures. A mobile laboratory was used to collect samples and conduct field tests at the construction sites.
et. al., 2007). Cementitious materials used to develop 117 ternary mixture designs included: Type I, Type I/II, Type ISM, Type IP, Type IPM and a high lime portland cement, Class C fly ash, moderate and low calcium Class F fly ashes, grades 100 and 120 slag cement, silica fume, and metakaolin. All cementitious materials were subjected to bulk chemical and physical testing. Mixing and testing were performed at the Pennsylvania State University, University of Utah, and Iowa State University.
In general, no significant technical barriers for pavement and bridge deck construction were found. Ternary combinations with pozzolans comprising between 40 and 50 percent of total cementitious content performed well in cool to hot weather environments. Findings for each property tested are briefly summarized below.
Setting Time and Mortar Flow
In general, the introduction of SCMs increased the time of setting and increased workability. Mixtures containing Class F fly ash had an unexpected decrease in set time, which could be due to the increased fineness of the Class F fly ashes used in the study. The grade 120 slag cement tended to have a decreased flow and time of set compared to the grade 100 slag cement, likely due to the finer grind.
Compatibility
One low-range water reducer showed significant reduction in time to set when used with Class C fly ash. The effect was not observed with other admixtures or fly ashes.
Air Void System
Although most mixtures met the threshold of 0.2 mm (0.008 in.) for air void spacing factor, some
mixtures containing Class F fly ash did not meet the minimum criteria of 23 –43 mm-1 (600 –
1000 in.-1) for specific surface with some WRA.
Mortar Compressive Strength
Most strengths correlated well with the bulk chemistry of the mixture.
Heat Signature
The heat signature of concrete mixtures describes the hydration process and gives estimates of the time to initial and final set. It was observed that when incorporating SCMs, a reduction in maximum temperature rise and a time delay to maximum heat generation was experienced. With the decrease in heat generated, the general tradeoff is a longer time to initial and final set.
The heat signature of mixtures containing Grade 120 slag cement was significantly higher than mixtures containing grade 100 slag cement. The results also showed that the influence of the silica fume replacement (3 or 5 percent) was negligible when comparing the respective heat signatures. This showed that a 5 percent replacement rate may be used if needed in high-performance concreting applications with no noticeable effect on the heat signature.
Shrinkage
In comparison to a 100 percent Type I portland cement mixture, shrinkage was reduced when the cement was blended with any other constituents. However, when Type I/II Portland cement was blended, shrinkage was observed to be higher than the control. Type IP and Type PM portland cements gave both higher and lower shrinkage results than when blended with an additional constituent. This indicates that cement type can affect shrinkage of ternary combinations.
Sulfate Mortar Bar Testing
Few simple trends could be observed in the sulfate tests. In general, the performances of the mixtures were parallel to the trends expected from the individual materials. Class F fly ash was found to be very good at mitigating sulfate expansion, while mixtures containing Class C fly ash should be tested in the planned combination before being used.
Alkali Silica Reaction (ASR)
The testing found that ternary blends can be designed to mitigate ASR expansion and that increased replacement levels of fly ash decreased ASR expansion. Low dosages of Class C fly ash blended with Class F fly ash did not mitigate ASR expansion. Thirty-five percent or more slag cement was effective in ASR mitigation. Silica fume and metakaolin increased mitigation of ASR when used in ternary blended cements
LABORATORY STUDY ON CONCRETE SUMMARY
Type I cement with binary combination controls and 26 ternary combinations (31 total combinations with TI cement),
Type IP with six SCM combinations (seven total),
Type IPM with four SCM combinations (five total), and
Type ISM with four SCM combinations (five total).
Each of these combinations is technically and economically advantageous for highway
applications. At least 11 of these ternary mixtures have the potential to have sufficient maturity in cold weather concrete operations (compressive strength greater than 3,500 psi at three days at 50°F), and at least 11 of these mixtures have the maturity characteristics suitable for hot weather concrete (less than 2,500 psi at three days at 90°F).
Some general summary comments are provided below. Details should be studied in the full laboratory report.
Fresh Concrete Properties
The majority of mixtures containing fly ash exhibited increased setting time. Mixtures with slag cement had no significant changes on setting time compared to the controls. Metakaolin and silica fume did not appear to have a great effect on setting time. Ternary mixtures followed the trends expected based on their ingredients.
Class C fly ash had a mitigating effect on bleeding up to a point, but when more than 25 percent Class C fly ash was used in the mixture, bleeding increased. Class F fly ash also reduced
bleeding, but was not as effective as the C ash and there was no pessimum effect observed with Class F fly ash. Bleeding was slightly increased in the mixtures containing slag cement, but decreased in the mixtures containing metakaolin. The high fineness of silica fume and large specific surface area greatly reduced the bleeding of the mixtures.
Compressive Strength
High replacement levels of SCMs could delay strength gain; therefore, a lower early age strength will likely be obtained for binary and ternary combinations, compared to a 100 percent portland cement mixture. However, many of the ternary mixtures had higher compressive strengths than the pure portland cement control mixture by 28 days.
Freeze-Thaw Resistance
Scaling
Moderate surface scaling was seen in all mixture designs tested. Inclusion of silica fume and metakaolin generally did not reduce the severity of the scaling; however, the addition of fly ash or slag cement did reduce the severity.
Chloride Ion Resistance and Resistivity
An excellent correlation was observed between AASSHTO T277 data and resistivity results obtained using a Wenner four-probe device. The results supported the use of the Wenner device as a quality assurance (QA) tool in concrete field testing. Cylinders cast as QA specimens and placed in wet curing for strength testing could be used for resistivity tests.
Ternary cementitious mixtures had a large effect on reducing diffusion coefficients and increasing of resistivity.
Shrinkage
All mixtures that were tested for shrinkage had strains less than 500 millionths at 28 days, and some had strains less than 500 millionths at 365 days.
Hot and Cold Weather Testing
Compressive strength trended with the temperatures and component reactivities, as expected, and setting times appeared to vary without a clear trend being apparent.
Scaling resistance of the mixtures was varied, predominantly controlled by the type of SCMs in the mixture, while mixing and curing temperatures did not appear to affect performance
significantly.
Carbon Dioxide Emissions
Ternary blended cement concrete mixtures were shown to have reduced the carbon dioxide emissions.
FIELD DEMONSTRATION SUMMARY
bridge decks and pavements were assessed. A separate data report was produced for each location and are all attached as Appendices to this report.
Project Information
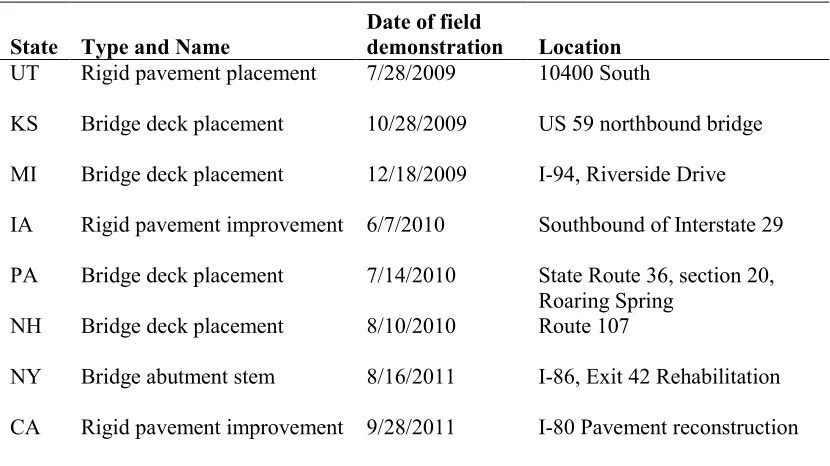
[image:20.612.67.482.214.447.2]Table 1 lists the eight projects that were investigated in this study, including three rigid pavement and five bridge deck construction projects.
Table 1. Project introduction
State Type and Name Date of field demonstration Location
UT Rigid pavement placement 7/28/2009 10400 South
KS Bridge deck placement 10/28/2009 US 59 northbound bridge
MI Bridge deck placement 12/18/2009 I-94, Riverside Drive
IA Rigid pavement improvement 6/7/2010 Southbound of Interstate 29
PA Bridge deck placement 7/14/2010 State Route 36, section 20,
Roaring Spring
NH Bridge deck placement 8/10/2010 Route 107
NY Bridge abutment stem 8/16/2011 I-86, Exit 42 Rehabilitation
CA Rigid pavement improvement 9/28/2011 I-80 Pavement reconstruction
Materials
Cements and Supplementary Cementitious Materials
Table 2. Chemical compositions and physical properties of cementitious materials
Chemical, %
UT KS MI IA PA NH NY CA ASTM C1157 cement (E) F fly ash Type I/II cement Silica
fume cement Slag IT(S25)(P4) IP(25) Type C fly ash Type
I/II cement
F fly ash cement Slag
Type II cement
F fly
ash cement Slag Type IP(6) F fly ash Type
II/V cement
F fly
ash cement Slag Ternary blends
composition, % by mass
67.5 PC + 7.5
limestone 25 60 5 35
71 PC + 4 SF + 25 Slag
cement 64 PC+21
F ash 15 55 15 30 50 15 35
75 PC
+ 5 SF 20 67 8 25
CaO - - 63.22 0.46 42.25 53.30 48.83 26.34 62.40 7.29 41.90 61.30 1.65 41.54 55.50 2.82 65.50 5.23 41.86
SiO2 - - 20.97 94.32 38.82 28.70 29.19 35.13 20.10 45.07 34.20 19.40 57.36 35.98 25.00 46.36 21.40 60.26 36.25
Al2O3 - - 4.47 0.28 7.27 5.86 8.62 19.95 4.60 23.83 11.17 4.90 26.57 12.89 5.40 25.17 3.60 24.25 10.69
Fe2O3 - - 2.93 0.31 0.81 1.98 3.80 5.74 2.70 15.02 0.68 3.70 5.40 0.52 3.00 17.72 3.50 4.23 0.78
MgO - - 2.30 0.75 9.02 4.68 3.04 4.88 4.00 1.58 6.89 2.30 - 6.11 2.40 - 1.60 1.09 6.15
K2O - - 0.60 0.48 0.50 0.48 0.89 0.42 - - 0.29 - - 0.27 - - - 1.17 0.62
Na2O - - 0.16 0.08 0.31 0.18 0.39 1.75 - 0.55 0.32 - 0.81 0.29 - 0.70 - 1.31 0.31
SO3 - - 2.63 0.05 - 2.52 3.14 1.45 3.40 1.30 - 3.80 0.33 1.09 4.20 0.57 3.40 0.31 2.07
P2O5 - - 0.12 0.09 0.03 0.08 - - - - 0.02 - - 0.04 - - - 0.17 -
TiO2 - - 0.31 0.01 0.41 0.27 - - - - 0.44 - - 0.44 - - - 0.89 -
SrO - - 0.08 - 0.05 0.05 - - - - 0.07 - - - 0.05 -
Mn2O3 - - 0.04 - 0.52 0.18 - - - - 0.38 - - 0.45 - - - 0.02 -
Eq. Alkalies - - 0.55 0.40 0.64 0.49 0.97 2.03 0.89 0.67 0.51 0.85 - 0.47 1.00 - 0.27 2.08 0.72
LOI - - 2.17 2.58 - 1.60 1.26 0.11 2.10 1.91 - 1.80 1.97 - 1.70 3.48 1.60 0.35 -
Total - - 100.55 99.82 100.62 100.37 100.13 97.80 100.19 97.22 96.87 98.05 94.09 100.09 98.20 96.82 100.87 101.41 99.45
Table 3. Fine and coarse aggregate types and properties
ID Coarse aggregate type Maximum aggregate size, in.
Specific
gravity Absorption, %
Passing #4 sieve,
%
Fine aggregate
type
Specific
gravity Absorption, % Fineness modulus blue index Methlene
ASTM C127 ASTM C127 ASTM C 128 ASTM C 128 ASTM C 33 ASTM C 837
KS granite 1 2.60 0.80 3.0 natural sand 2.61 0.70 2.66 0.75
MI calcitic limestone granite 1 2.70 1.73 3.0 natural sand 2.61 1.20 2.80 1.54
- 2.60 2.33 5.0
IA quartzite p-gravel 1 2.64 0.30 0.7 natural sand 2.65 0.80 3.00 0.63
- 2.67 1.60 39.0
PA dolomitic limestone 1 2.84 0.32 2.0 sandstone 2.61 0.94 2.83 1.08
NH granite 1 2.67 0.65 3.6 sandstone 2.67 0.78 2.66 1.13
NY crushed gravel 1.0 2.61 0.50 2.9 generic sand 2.64 2.97 2.90 -
CA river gravel 1.5 2.76 1.10 1.0 washed concrete sand 2.64 1.90 2.95 -
Aggregate
Table 3 lists the fine and coarse aggregate types and physical properties.
Figure 1 shows the 0.45 power curves of combined aggregate gradation. The coarse aggregate used in the majority field mixtures was a 1 in. maximum size except for California, which used 1.5 inches. The band of upper and lower limits is set up for the 1 in. size. Overall, the combined aggregate gradations are fair.
Figure 1. 0.45 Power curve of combined aggregate gradation
Coarseness factor and adjusted workability factor were calculated in accordance with Shilstone’s method. The coarseness factor chart (Figure 2) indicates the combined aggregate gradations may be considered well graded for all the field mixtures.
0 10 20 30 40 50 60 70 80 90 100
Per
ce
n
t
p
assi
n
g
Sieve size
KS
NH
IA
NY
MI
PA
CA
#
200 #100 #50 #30 #16 #8 #4 3/8" 1/2" 3/4" 1 "
11/2 "
Upper limit
Figure 2. Coarseness factor chart
Mix Proportions
Table 4 shows the mix proportions for each project. Note that the mixture in NH contained polymeric fibers.
Testing Activities Summary
Fresh and hardened concrete properties were tested either in the field or in the laboratory by National CP Tech Center and/or local DOT technicians. Inclement weather prevented the mobile laboratory from reaching the site in Michigan, therefore field data are limited. Materials and samples were shipped to the laboratory for tests on hardened properties. The data are
summarized in Table 5. Some tests are not available due to the field and environmental restrictions. 20 25 30 35 40 45
0 10 20 30 40 50 60 70 80 90 100
A d ju ste d Wo rkab ili ty Fact o r, %
Coarseness Factor, %
KS MI IA PA NH NY CA Well Graded
Table 4. Mix proportions for each project
UT KS MI IA PA NH NY CA
Cement lbs/yd3 493.0 321.0 426.0 478.0 323.0 306.0 540.0 452.0
Fly ash lbs/yd3 164.5 - - 84.0 88.0 92.0 135.0 54.0
Slag cement lbs/yd3 - 187.0 150.0 - 176.0 213.0 - 169.0
Silica fume lbs/yd3 - 27.0 24.0 - - - - -
Fine aggregate lbs/yd3 1373.0 1217.0 1234.0 1235.0 1210.0 1160.0 1115.0 1130.0
Coarse aggregate 1 lbs/yd3 1022.0 1371.0 1435.0 1568.0 1928.0 1800.0 1710.0 975.0
Coarse aggregate 2 lbs/yd3 498.0 463.0 299.0 280.0 - - - 926.0
Water lbs/yd3 245.0 225.0 228.0 225.0 241.0 269.0 270.0 250.0
Air entraining agent oz/yd3 5.9 1.0 11.4 1.5 7.0 3.8 9.2 20.3
Water reducer oz/yd3 30.2 4.0 54.0 1.0 35.2 27.5 12.0 33.8
Retarder oz/yd3 - 1.0 18.0 4.0 11.7 - - -
Accelerator oz/yd3 - 1.0 - - - - - -
Fiber lbs/yd3 - - - 7.0 - -
Designed Unit weight lbs/ft3 - 141.1 140.6 143.3 146.9 142.3 139.6 146.5
Paste content % - 30.5 31.8 30.9 32.2 33.5 36.1 33.8
Designed air content % - 6.5 6.5 6.0 6.0 5.0 6.5 5.5
Table 5. Summation of tests conducted either in the field or in the laboratory
Tests Specifications Project locations
UT KS MI IA PA NH NY CA
Slump C143/C360 ASTM 1 test 9 tests 1 test 1 test 7 tests 5 test 2 tests 2 tests
Unit weight ASTM C138 n/a 9 tests 1 test 1 test 2 tests 5 test 2 tests 2 tests
Temperature ASTM C1064 n/a 9 tests 1 test 1 test 7 tests 5 test 2 tests 2 tests
Air content ASTM C231 1 test 9 tests 1 test 1 test 7 tests 5 test 2 tests 2 tests
Microwave w/c
ratio AASHTO T 318 n/a 2 tests n/a 1 test 2 tests 1 test 2 tests 2 tests
Setting time ASTM C403 n/a 1 test n/a 1 test 1 test 1 test 1 test 1 test
Temperature
sensor - n/a n/a 8 sensors n/a 2 sensors 2 sensors n/a n/a
Calorimetry ASTM C1679 n/a 4 cylinders n/a 4 cylinders 4 cylinders 4 cylinders 4 cylinders 4 cylinders
Rapid Air Test ASTM C457 n/a 14 specimens 10 samples n/a n/a n/a 8 specimens 8 specimens
Boil Test ASTM C642 n/a 4 specimens n/a 3 specimens 3 specimens n/a 3 specimens 3 specimens
Rapid chloride
permeability ASTM C1202 4 specimens 4 specimens 3 specimens from 1 specimen 2 specimens specimens 2 specimens 2 specimens 2
Free drying
shrinkage ASTM C157
4 beams at 1, 3, 14, 28, 56,
91 days
3 beams at 1, 4, 7, 14, 28,
56 days
4 beams at 1, 4, 7, 14, 28, 56 days
3 beams at 1, 4, 7, 14, 28, 56 days
4 beams at 1, 4, 7, 14, 28, 56 days
3 beams at 1, 4, 7, 14, 28, 56 days
3 beams at 1, 4, 7, 14, 28,
56 days
3 beams at 1, 4, 7, 14, 28, 56 days
Restrained
shrinkage ASTM C1581 n/a 4 rings 4 rings 4 rings 4 rings 4 rings n/a n/a
Compressive
strength ASTM C39 1, 3, 7, 14, 28, 56 days 1, 3, 7, 28, 56 days 1, 3, 7, 28, 56 days 1, 3, 7, 28, 56 days 1, 3, 7, 28, 56 days 1, 3, 7, 28, 56 days 3, 7, 28, 56 days 3, 7, 28, 56 days
Splitting tensile
strength ASTM C496 n/a 1, 3, 7, 28, 56 days 1, 3, 7, 28, 56 days 1, 3, 7, 28, 56 days 1, 3, 7, 28, 56 days 1, 3, 7, 28, 56 days 3, 7, 28, 56 days 3, 7, 28, 56 days
Static modulus
of elasticity ASTM C469 n/a 1, 3, 7, 28, 56 days 1, 3, 7, 28, 56 days 1, 3, 7, 28, 56 days 1, 3, 7, 28, 56 days 1, 3, 7, 28, 56 days 3, 7, 28, 56 days 3, 7, 28, 56 days
Table 6. Environmental conditions and fresh concrete property results summary
UT KS IA PA NH NY CA
Test date 2008/7/28 2009/10/28
201 0/6/
7 2010/7/14 2010/8/10 2011/8/16 2011/9/28
Recorded
time 6:40 AM 8:03 AM 8:20 AM 8:25 AM 8:40 AM 9:20 AM 10:10 AM 10:50 AM 11:04 AM 11:28 AM 1:15 PM 7:20 AM AM 8:05 8:50 AM 9:27 AM 9:30 AM 10:01 AM 10:38 AM 8:22 AM 9:00 AM 9:15 AM 9:17 AM 9:28 AM 8:05 AM 10:55 AM 9:50 AM
Relative
humidity, % - 65.0 81.0 84.0 81.0 79.0 70.0 60.0 65.0 62.0 65.0 82.0 70.0 75.0 77.0 78.0 79.0 79.0 79.0 75.0 72.0 72.0 72.0 84.0 69.0 40.0
Ambient temperature,
°F 60.0 48.0 48.0 49.0 53.0 51.0 57.0 57.0 58.0 62.0 72.0 69.0 77.4 75.4 74.6 72.0 73.9 73.2 71.8 73.1 74.0 74.4 74.4 65.0 72.0 78.0
Wind speed,
mph - 2.4 8.0 4.5 11.2 4.5 6.0 5.0 3.5 3.5 3.0 3.0 - - - 7.0 - - 3.0 1.0 2.0 3.0 1.0 4.0 2.0 2.0
Slump, in. 1.0 7.0 6.5 6.8 6.0 7.5 4.0 3.5 4.5 4.5 2.0 3.5 3.0 6.5 4.5 3.8 3.3 3.3 3.5 3.0 5.5 4.5 4.5 3.8 4.0 0.8
Unit weight,
lbs/ft3 - 137.8 135.6 136.4 138.8 137.8 140.4 139.8 140.8 140.8 135.6 147.3 - - - 147.1 - - 136.0 136.2 141.2 139.6 136.2 138.2 138.0 151.0
Concrete temperature,
°F 77.0 55.0 60.0 62.0 62.0 61.0 65.0 62.6 66.0 66.0 74.1 80.4 73.0 74.0 75.0 78.8 79.0 79.0 83.0 80.0 82.2 81.0 81.0 77.2 78.4 76.5
Air content,
% 5.4 7.6 9.0 8.3 7.8 7.6 6.6 7.5 5.2 6.4 8.8 6.0 6.8 7.1 5.0 6.0 5.4 5.3 7.5 8.8 6.8 6.6 7.2 6.5 7.3 3.5
Intial setting
time, hours - - - 3.66 - - 2.32 3.63 - - - 5.24 - - 5.76 - 6.37
Final setting
time, hours - - - 11.66 - - 8.41 10.96 - - - 8.12 - - 6.72 - 7.47
Microwave
Fresh concrete properties including slump, unit weight, concrete temperature, air content, microwave water-to-cementitious materials ratio (w/cm), setting time, and calorimetry were tested in the field. Concrete samples were cast in the field and transported to the laboratory for further testing, including compressive strength, static modulus of elasticity, splitting tensile strength, free drying shrinkage, restrained drying shrinkage, salt scaling tests, rapid chloride permeability, porosity analysis (boil test), and air void structure (rapid air test).
Results Summary
The fresh concrete properties are summarized in Table 6 along with the environmental conditions measured during field testing.
Fresh Concrete Properties
Slump tests were conducted in accordance with ASTM C143 for most of the projects. The exception was in California where the Kelly-Ball test was run according to ASTM C360. Generally, ternary mixtures used for pavements (UT, IA, and CA) had lower slumps than those used for bridges.
The field tested air contents ranged from 3.5 percent to 9.0 percent. The lowest air content measurement occurred in California field tests.
Figure 3. Tested unit weight vs. tested air content
Mortar was manually sieved from concrete samples for setting time measurements. As stated in Phase II final report of this study (Tikalsky et al. 2011), fly ash generally increased the setting time of the mixtures, while slag cement and silica fume did not show a significant impact on setting time. It should be noted that the ambient environment had significant impact on setting time, especially temperature and relative humidity. Overall, no unusual results for setting time were derived from the field mixtures. Measured initial and final setting times are plotted in Figure 4.
0.0
1.0
2.0
3.0
4.0
5.0
6.0
7.0
8.0
9.0
10.0 125.0
130.0 135.0 140.0 145.0 150.0 155.0
KS IA PA NH NY CA
Tested unit weight Tested air content
Air c
ontent,
%
Unit
we
ig
ht,
lb/
ft
Figure 4. Initial and final setting time
A commercial semi-adiabatic calorimeter was used to measure the temperature rise during early hydration of cementitious materials. Figure 5 shows the heat signature curves. Table 7
summarizes the start, peak, peak to start temperature ratio, and the time to peak temperature for each curve. Temperature peaks seem to be influenced by initial temperature as well the nature of the cementitious system. One-day strength gain is indicated by the area underneath the heat signature curve.
KS-Oct IA-Jun PA-Jul NH-Aug NY-Aug CA-Oct
Initial 3.66 2.32 3.63 5.24 5.76 6.37
Final 11.66 8.41 10.96 8.12 6.72 7.47
0 1 2 3 4 5 6 7 8 9 10 11 12 13
H
o
u
Figure 5. Calorimeter test results
Table 7. Calorimeter parameters
NY 1 NY 2 CA PA IA MI KS 1 KS 2
Peak temperature, °F 114.2 109.5 104.8 104.0 95.9 82.0 78.5 77.6
Start temperature, °F 72.8 69.1 61.6 74.3 73.0 40.1 62.1 58.3
Peak to initial temp. ratio 1.57 1.58 1.70 1.40 1.31 2.04 1.26 1.33
Time to peak, hours 11.0 13.5 14.4 13.8 15.8 22.0 6.8 7.9
Notes: the designation 1 and 2 indicate two sets of calorimeter tests.
Hardened Concrete Properties
Mechanical Properties 30.0
35.0 40.0 45.0 50.0 55.0 60.0 65.0 70.0 75.0 80.0 85.0 90.0 95.0 100.0 105.0 110.0 115.0 120.0
0.0 6.0 12.0 18.0 24.0 30.0 36.0
Te
rmpe
ra
tur
e,
°F
Time since mix, hours
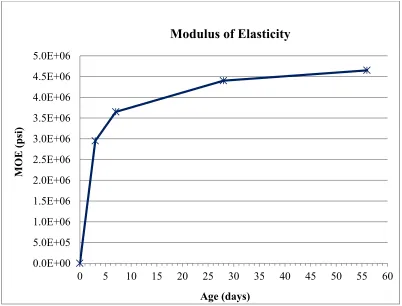
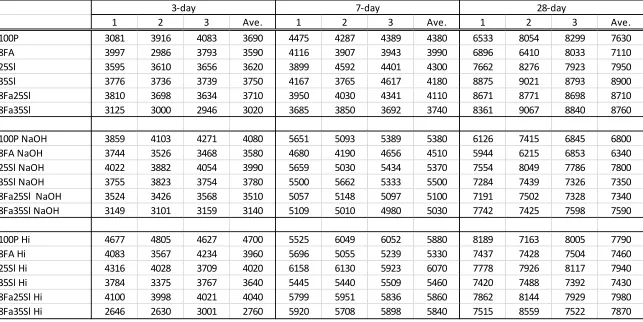
in Iowa mixtures led to a higher modulus of elasticity. Most field mixtures had moist-cured 28-day compressive strengths over 4,000 psi and the 28 to 7 28-days compressive strength ratios shown in Table 8 are greater than 1.23, which indicated a good compressive strength development. The average compressive to splitting tensile strength ratios are listed in Table 8 as well, and the ratios ranging from 9.26 to 13.22 are considered acceptable. The ratio of split tensile to square root of compressive strength range between 6.1 to 7.1. These values are consistently lower than the commonly accepted value of 7.5.
Table 8. 28 to 7 days compressive strength ratio and compressive to splitting tensile strength ratio
UT KS MI IA PA NH NY CA
fc-28days/fc-7days 1.63 2.00 1.39 1.23 1.11 1.35 1.26 1.27
Ave. fc/fsp - 9.26 13.22 11.75 10.27 9.38 9.49 9.35
fsp/sqrt(fc) - 6.8 6.6 6.2 7.1 6.7 6.3 6.1
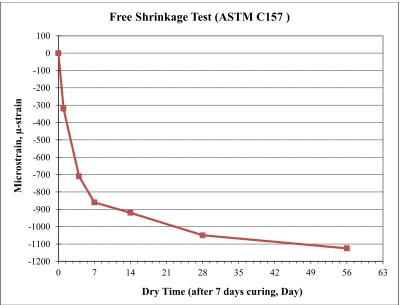
Free Shrinkage
In this report, the term “free shrinkage” refers to the total shrinkage of unrestrained prism
specimens, and may include autogenous and drying shrinkage mechanisms. Figure 6 provides the free shrinkage data.
-900 -800 -700 -600 -500 -400 -300 -200 -100 0 100
0 7 14 21 28 35 42 49 56 63
Fr
e
e
sh
ri
n
kage,
µ
ε
Day
IA
KS
NH
PA
NY
Restrained Shrinkage
Five of eight field mixtures, i.e., IA, KS, NH, PA, and MI, were selected for restrained shrinkage tests conforming to modified ASTM C1581. Four concrete rings were cast in the lab using the field mixture proportions in order to assess the potential for shrinkage induced cracking.
Figure 7 gives the strain values in the rings as the concrete shrinks. The Michigan mixture cracked around 7 days. The trends shown in the restrained shrinkage test results are in agreement with the free shrinkage results.
Figure 7. Strains of stell rings resulting from concrete shrinkage
Besides the length change, average strain rate factor can be used to evaluate the drying shrinkage in an unrestrained condition (Lomboy et al. 2010). Table 9 compares the shrinkage rate factors obtained from unrestrained prisms and restrained rings: the relative order obtained from the two tests is in good agreement – IA< KS< PA< NH< MI.
-120 -110 -100 -90 -80 -70 -60 -50 -40 -30 -20 -10 0 10 20
0 2 4 6 8 10 12 14 16 18 20 22 24 26 28 30
Ste
el
R
in
g
Str
ai
n
, µ
ε
Days
IA
PA
KS
MI
Table 9. Average strain rate factor
Mix Average strain rate factor α (strain×10
-6/day1/2)
Concrete prisms Restrained rings
PA 83.0 34.0
NH 102.9 35.8
KS 81.2 26.1
MI 118.9 51.5
IA 34.0 23.1
Figure 8 shows cracking potential (ΘCR) values of the concrete mixes. It was observed that only
the Michigan mixture cracked, and that was when ΘCR reached 2.1.
Figure 8. Shrinkage stress-to-tensile strength ratio (cracking potential ΘCR) of restrained concrete rings with time
The cracking potential value of NH mixture was very close to MI mixture, but did not crack. This is attributed to fiber reinforcement in the NH mixture.
Salt Scaling Test
Specimens were rated on a scale of 0 to 5, with 0 having no scaling and 5 having severe scaling. 0.0
0.5 1.0 1.5 2.0 2.5
0 2 4 6 8 10 12 14 16 18 20 22 24 26 28 30
Cr
ac
ki
n
g Po
te
n
tial
,
θ
CR
Concrete Age (days)
MI NH
KS
Table 10. Visual condition of specimen
Mixture ID KS IA PA NH NY CA
Cycle 50 3 4 2 3 2 2
Slight surface scaling was seen in all field mixtures tested after 50 cycles. Mixtures with supplementary cementitious materials generally performed well in reducing the severity of the surface scaling except Iowa mixture using Class C fly ash.
Rapid Chloride Permeability, Porosity, and Air Void Analysis
Concrete cylinders were cast in the field and tested in accordance with ASTM C1202 in the laboratory for chloride ion penetration at 56 days. Table 11 summarizes the results and
classifications for each mixture. All the field mixtures in this study had high chloride penetration resistance.
The boiling-water saturation technique described in ASTM C642 was used to measure the permeable pore space or voids (permeable porosity) in hardened concrete. Table 11 summarizes the porosity results for five field mixtures. Test results agreed well with chloride ion
penetrability.
The air void system of hardened concrete samples was measured using the Rapid Air method. Table 11 shows the average air void test results. A spacing factor ≤ 0.20 mm measured using microscopical methods is an indication of a good concrete freeze-thaw resistance.
Table 11. Summary of chloride ion penetrability, porosity, and air void structure of hardened concrete
Standard UT KS MI IA PA NH NY CA
Chloride ion penetrability at 56
days, coulombs ASTM C1202 (low) 1800
500 (very
low) (low) 1000 (low) 1200 (low) 1800 (low) 1000 (low) 1200 (low) 1300 Porosity by boil test,
% ASTM C642 - - 6.1 5.8 7.6 - 5.9 6.4
Air content, %
Rapid Air
- 7.4 2.2* - - - 4.4 7.9
Specific surface, mm-1
- 16.9 24.7 - - - 48.2 38.2
Spacing factor, mm - 0.231 0.328 - - - 0.110 0.097
* MI hardened air data were not consistent with field data.
Utah
– Excellent workability and finishing properties
– Excellent rheological properties for the paving machine
– Smooth day of paving with no problems
– No cracking was found at 100 days after casting and outside of pavement joints
– No scaling or freeze-thaw damage occurred after the first two winters
Kansas
– Workability and finishing properties were satisfactory
– Use of the ternary mixture allowed the contactor to place a full depth deck in one
pour instead of two pours traditionally
Pennsylvania
– Workability and finishing properties were satisfactory
– Only some minor cracking was observed over the pier at four months after the
bridge deck was constructed
California
– No materials difficulties experienced during construction
– Some surface loss observed after the first winter on one section. This pavement is
exposed to studded tires in winter.
KEY FINDINGS
In order to provide preliminary design and test results for concrete study, multiple paste and mortar mixtures composed of ordinary cements, binary system, and ternary system were developed and tested in this project.
The following points may be considered the key findings of the work:
Ternary mixtures can be developed for any application and have a high probability of
Limits to dosage or type of SCM should be based on performance rather than a recipe (prescriptive) approach
Performance can largely be predicted based on the available information, prior experience,
and relative proportions of the individual components
Materials intended for the field should be tested in laboratory trials. Do not substitute admixtures or SCMs in the field without trial batches
Activities are driven by incentives; therefore specifications and financial incentives should
carefully consider what is really wanted and when it is needed
Increasing SCM content reduces environmental impacts
There is a need for improved performance test methods with appropriate specification limits
Innovative approaches to testing and evaluation such as the Wenner Probe and calorimetry
were used and proved in this work
There is still a need for an effective means of testing the air void system in real time, and assessing the ingredients and proportions of a sample of fresh concrete
Systems have to be competitive in the marketplace to find acceptance
Education and demonstration projects are critical to moving forward
OTHER IMPACTS
This research project provided quantitative information needed to make sound engineering judgments pertaining to the selection and use of SCMs in conjunction with portland or blended cements in ternary mixtures. This information can lead to a more effective utilization of
supplementary materials and/or blended cements enhancing the life-cycle performance and cost of transportation pavements and structures.
In addition, a number of other impacts were realized in the execution of the work. These include a significant number of academic products:
1. Doctoral Graduates:
Tyson Rupnow (Iowa State University, 2008)
Pratanu Ghosh (University of Utah, 2011)
Shannon Hanson (University of Utah, 2013)
2. Masters Graduates:
Alison Marie St. Clair (Pennsylvania State University, 2007)
Mohamad Siddiqui (University of Utah, 2009)
Stephanie Marquez (University of Utah, 2011)
Xuhao Wang (Iowa State University, 2011)
3. Publications:
FHWA/ACI/ACPA, Nov. 6-9, 2007.
b. St. Clair, A. M.; “Effect of Cementitious Combinations on Strength Development
up to 28 Days and Shrinkage in Mortars,” Master Thesis, Pennsylvania State University, August 2007.
c. Rupnow, T. D.; “Evaluation of Laboratory and Field Techniques to Improve
Portland Cement Concrete Performance,” Doctor of Philosophy Dissertation, Iowa State University, 2007.
d. Tikalsky, P., Schaefer, V., Wang, K., Scheetz, B., Rupnow, T., St. Clair, A.,
Siddiqi, M., and Marquez, S.; “Development of Performance Properties of Ternary Mixes: Phase I Final Report”, Report No. Pooled Fund Study TPF-5(117), Ames: Center for Transportation Research and Education, Iowa State University, December, 2007.
e. Marquez, S. A.; “Carbon Dioxide Signatures for Ternary Concrete Mixtures,”
Master of Science Thesis in Civil Engineering, University of Utah, Salt Lake City, August, 2009.
f. Rupnow, T. D., Schaefer, V. R., and Wang, K.; “Evaluation of a Quick Heat
Generation Index Test for Characterization of Cementitious Materials,” Transitioning from Fluid to Solid: Re-Examining the Behavior of Concrete at Early Ages, Proceeding ACI Convention, San Antonio, Texas, March 14-18, 2009.
g. Rupnow T. D., Wang, K., Schaefer, V., and Tikalsky, P.; “A Simple
Method for Characterizing and Predicting Temperature Behavior of Ternary Cementitious Systems,” Journal of Construction and Building Materials, Elsevier Press, Vol. 25, 11/2010. 2290-2297.
h. Ghosh, P.; and Tikalsky, P. J.; “Effect of Ternary Cementitious Systems
on Conductivity and Diffusion Coefficients,” 12th International Conference on Durability of Building Materials and Components,” ASTM-CIB-RILEM, Porto, Portugal, pp. 1609-1616, April 12-15, 2011.
i. Wang, X.; “Drying Shrinkage of Ternary Blends in Mortar and Concrete.” Master
of Science Thesis in Civil Engineering Materials, Iowa State University, Ames, IA, 2011.
j. Wang, X., Taylor, P., Bektas, F., Wang, K., and Tikalsky P; “Drying Shrinkage
Behavior of Mortars Made with Ternary Blends.” Paper presented at Mid-Continent Transportation Research Symposium, Ames, IA, August, 2011.
k. Tikalsky, P., Taylor, P., Hanson, S., Ghosh, P.; “Development of Performance
Properties of Ternary Mixes: Phase II Final Report”, Report No. DTFH61-06-H-00011 Work Plan 12 Pooled Fund Study TPF-5(117), Ames: National Center for Concrete Pavement Technology, March 2011.
l. Wang, X., Taylor, P., Bektas, F., Wang, K., and Tikalsky P; “Drying Shrinkage
Behavior of Mortars Made with Ternary Blends.” Paper presented at
As noted earlier, a number of promising test methods were also used and found to be effective in the work. These included the following methods:
1. The Wenner Probe was used to assess surface resistivity of concrete. This test is
rapid, cost effective and has been adopted by more than one state department of transportation as an acceptance tool.
2. Semi-adiabatic calorimetry provides an effective means of assessing whether
potential incompatibilities may occur between the ingredients of a mixture. Regular testing of materials on delivery will also flag changes in composition or behavior reducing the risk of unanticipated behavior at the batch plant or paving machine.
GUIDE SPECIFICATION
One of the deliverables for the project was a guide specification. Based on the overall findings discussed above, the guide specification should primarily be based on specifying performance rather than depending on prescriptive limits on amounts or types of cementitious materials used in a mixture.
The following clauses are therefore suggested for insertion into a specification:
Ternary mixtures of cementitious materials are permitted
Cementitious materials shall comply with their respective specifications:
o Portland cement – ASTM C 150 or AASHTO M85
o Blended cements – ASTM C 595 or AASHTO M 240
o Hydraulic cements – ASTM C 1157
o Fly ash – ASTM C 618 or AASHTO M 295
o Slag cement ASTM C 989 or AASHTO M 302
o Silica fume ASTM C 1240
Concrete performance shall meet the following performance requirements based on trial
batches:
o Minimum air content [5%] […%] after placement
o Slump shall be selected by the contractor. Delivered batches may not vary from the
selected value by more than 1 in.
o Shrinkage tested in accordance with ASTM C 157 modified as follows:
o Soak samples for 7 days instead of 28
o Initial reading to be taken at the end of soaking
o Final reading to be taken of 28 days drying
o Maximum shrinkage shall be [500 microstrain] [… microstrain]
o Sulfate expansion shall be less than 0.05% at 6 months when tested in accordance with ASTM C1012
For paving applications, the mixture shall be evaluated using Hiperpav to verify that early
cracking is not likely for the weather expected during construction
Materials sources may not be changed without trial batches
Materials dosages may not vary by more than 5% of total cementitious without trial batches
Water may not be added to mixtures after initial mixing
w/cm shall be selected based on the results of the trial batches to meet performance
requirements. Delivered concrete w/cm shall not exceed the selected value based on batch tickets.
REFERENCES
Lomboy G, Wang K, and Ouyang C. “Shrinkage and fracture properties of semi-flowable self-consolidating concrete,” Journal of Materials in Civil Engineering, Vol. 23, No. 11, pp.
1514-1524, Nov. 2011.
Tikalsky, P. J., Carrasquillo, R. L., and Carrasquillo, P. M., “Durability and Strength
Considerations of Concrete Containing Fly Ash,” Journal of the American Concrete
Institute-Materials, Vol. 85, No. 6, pp. 505-511, Nov.-Dec. 1988.
Tikalsky, P. J., Schaefer, V., Wang, K., Scheetz, B., Rupnow, T., St. Clair, A., Siddiqi, M., and
Marquez S., Development of Performance Properties of Ternary Mixtures: Phase I Final
Report, Ames, IA, National Concrete Pavement Technology Center, 2007.
Tikalsky, P. J., Taylor, P. C., Hanson S., and Ghosh, P., Development of Performance Properties
of Ternary Mixtures: Laboratory Study on Concrete, Ames, IA, National Concrete
Pavement Technology Center, 2011.
APPENDICES: FIELD DEMONSTRATION REPORTS (ALPHABETIC ORDER)
Appendices for the Field Demonstration reports follow as outlined here:
Appendix State
A and B CA (2 reports)
C IA
D KS
E MI
F NH
G NY
H PA
A
PPENDIX
A.
F
IELD
A
PPLICATION OF
T
ERNARY
M
IXTURES
:
R
ECONSTRUCTION OF
R
IGID
P
AVEMENT IN
C
ALIFORNIA
State Report June 2012
Research Team
Peter Taylor Paul Tikalsky
Kejin Wang Gary Fick Xuhao Wang
Sponsored through
Federal Highway Administration DTFH61-06-H-00011 Work Plan 19
FHWA Pooled Fund Study TPF-5(117): California, Illinois, Iowa (lead state), Kansas, Mississippi, New Hampshire, Oklahoma, Pennsylvania, Utah, Wisconsin;
American Coal Ash Association, American Concrete Pavement Association, Headwaters Resources, Portland Cement Association, Slag Cement Association
Preparation of this report was financed in part
through funds provided by the Iowa Department of Transportation through its Research Management Agreement with the
Institute for Transportation (InTrans Project 09-361)
A report from
National Concrete Pavement Technology Center Iowa State University
TABLE OF CONTENTS
LIST OF FIGURES
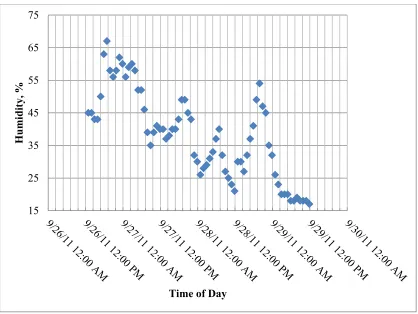
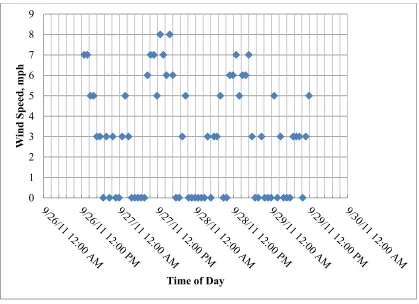
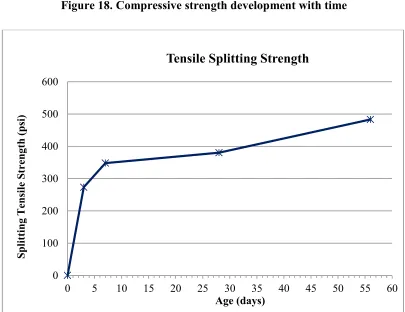
Figure 1. I-80 rigid pavement reconstruction, Emigrant Gap, California ...2 Figure 2. Project location (Eastbound Lane) ...3 Figure 3. Concrete batch plant ...4 Figure 4. Central mix plant ...4 Figure 5. Aggregate stockpiles ...5 Figure 6. Concrete being discharged at central mix plant ...6 Figure 7. FHWA’s mobile laboratory ...6 Figure 8. Concrete passing through the paver ...7 Figure 9. GOMACO GHP 2800 slipform concrete paver ...7 Figure 10. Dowel bar inserter ...7 Figure 11. Concrete surface being sealed by Auto-Float ...8 Figure 12. Texturing/curing machine ...8 Figure 13. Specimen preparation ...8 Figure 14. Ambient temperature ...9 Figure 15. Relative humidity ...10 Figure 16. Wind speed ...11 Figure 17. Rapid chloride permeability test (left) and surface resistivity meter (right) ...11 Figure 18. Compressive strength development with time ...13 Figure 19. Tensile splitting strength development with time ...13 Figure 20. Modulus of elasticity development with time ...14 Figure 21. Free shrinkage of prisms (ASTM C 157) ...15 Figure 22. AdiaCal calorimetry test equipment for heat of hydration of concrete ...16 Figure 23. Calorimetry test results ...16 Figure 24. CA salt scaling sample after 50th freeze-thaw cycle ...17
LIST OF TABLES
Table 1. Ambient conditions and fresh concrete properties of I-80 rigid pavement
reconstruction project...6 Table 2. Classification according to Rapid Chloride Ion Penetration (ASTM C1202) and
ACKNOWLEDGMENTS
INTRODUCTION
This document reports the activities and observations of the research group that performed on-site testing of a ternary mixture placed on the I-80 rigid pavement reconstruction project in Emigrant Gap, California. The cementitious system was composed of Type II-V cement from Lehigh Heidelberg Cement Group, Grade 120 slag cement from the same source, and Class F fly ash from Salt River Materials Group. This work is part of a comprehensive study that aims to improve the performance of concrete mixtures through use of ternary cementitious blends. This is the field demonstration phase that intends to provide consulting to the participating states and contractors on the use and field management of ternary mixtures. A mobile concrete laboratory (MCL) equipped for on-site cement and concrete testing was provided by the Federal Highway Administration (FHWA) to collect data and field observations. The MCL was invited to the project by Mr. Phil Zink and Dr. Dulce Feldman of the California Department of Transportation (Caltrans).
PROJECT INFORMATION
I-80 Pavement Reconstruction, Emigrant Gap, California
Contractor: Teichert Construction
The original pavement was 8 in. jointed plain concrete pavement (JPCP). An 11-mile
section was reconstructed on the eastbound I-80 from Emigrant Gap to Yuba Gap. Four of the 11 miles were reconstructed as continuously reinforced concrete
pavement (CRCP), which was predominately used on the three lane section, and the remainder was reconstructed as JPCP using a ternary mixture.
Reconstructed pavement information: 12 ft wide lanes, 10 ft shoulders, 14 in. thick,
Figure 1. I-80 rigid pavement reconstruction, Emigrant Gap, California
SITE LOCATION
Figure 2. Project location (Eastbound Lane)
SAMPLING AND TESTING ACTIVITIES
Safety concerns and limited access meant that testing could not be conducted at the point of placement. The mobile lab arrived at the plant during the CRCP construction on September 21, 2011. The National CP Tech Center crew arrived at job site on September 27, 2011. The project schedule (i.e., concrete placement, sampling, and testing) are shown in Table 1. The National CP Tech Center crew participated in sampling/testing activities on September 28, 2011, during the construction of the JPCP section. The samples were brought back to the plant site in 5 gallon buckets where all the field testing and casting took place. Hardened concrete specimens were transported to Iowa State University on September 30, 2011, for further testing. The following tests were conducted either in the field or in the laboratory:
Semi-adiabatic calorimetry test
Kelly-Ball test, unit weight, temperature, and air content of fresh concrete — 3 tests
(ASTM C 360, ASTM C 138, ASTM C 1064, ASTM C 231)
Microwave w/c ratio — 1 test (AASHTO T 318)
Initial set and final set of concrete — 1 test (ASTM C 403)
Compressive strength, splitting tensile strength, static modulus of elasticity — 4 in. × 8 in. cylinders at 3, 7, 28, and 56 days (ASTM C 39, ASTM C 496, ASTM C 469)
OBSERVATIONS OF THE RESEARCH TEAM
The following observations were made in the field work:
GOMACO GHP 2800 slip form paver equipped with dowel bar inserter and
GOMACO TC600 texturing/curing machine were used.
The concrete was mixed at a central mix plant (Teichert Construction) and
transported by ready-mix trucks. Figure 3 to 5 show pictures of the central mix plant and the aggregate stockpiles at the plant site, which was situated at the Nayak Road exit on I-80.
Figure 3. Concrete batch plant