Abstract: Mobile Ad-Hoc Network (MANET) is a self-structured and self-controlled network. The nodes can sense, process and communicate wirelessly. They are portable, compact and battery powered. These abilities of MANETs make them useful for the applications where fixed infrastructure is not available or is temporarily down due some calamity. They can be used in rescue/disaster relief operation, forest animal surveillance, military surveillance and data exchange in lecture hall etc. Researchers are working on various constraints of MANET, such as limited battery power and bandwidth, lack of central administration and security, need of specialized routing etc. But easy deployment without necessity of physical infrastructure makes MANETs a preferred choice for “wireless communication network”. Researchers have used different techniques viz. simulation, emulation and real world implementation to evaluate the performance of MANET to reduce the impact of these limitations. Simulations assume real time scenarios to test the performance which many a times may not result into expected outcomes. Emulation enables repetitive testing of network scenarios with constraints much similar to the real world, but their per node deployment price is greater than simulation. The simplest form of real world implementation of MANET node can be an embedded circuit with microcontroller, radio transceiver, power source, memory and sensor/s module. This paper presents a study on performance evaluation of low power and low cost - “ZigBee/IEEE 802.15.4” as a wireless radio transceiver in the node design. The experimental analysis of variation in number of obstacles and distance between the nodes that affects the performance of the network in terms of range, network area, packet delivery ratio and latency is presented. Considering the performance of ZigBee with its limitations can help researchers to decide the suitable environment, distance between nodes and frame size to establish a wireless ad hoc network for reliable and efficient communication.
Index Terms: Mobile Ad-Hoc Network, radio transceiver, wireless communication, ZigBee/ IEEE 802.15.4.
I. INTRODUCTION
There are variety of hardware platforms available for real world implementation of nodes in a wireless ad-hoc/ sensor network due to variety of applications and issues in wireless networking. A hardware node must be capable of sensing (if required), processing and communicating wirelessly. These
nodes are simply constructed using a
microcontroller/microprocessor, radio transceiver, power source, memory and sensor/s (if any). The radio transceiver can be based of wireless technology such as Bluetooth (IEEE 802.11.1), ZigBee (IEEE 802.11.5) and Wi-Fi (IEEE
Revised Manuscript Received on July 05, 2019
Mousami Vanjale, Department of Electronics Engineering, BV (DU) COE, Pune, India and Department of E & TC Engineering, AISSMS’s Institute of Information Technology, Pune, India
S. P. Gaikwad, Department of Electronics Engineering, BV (DU) COE, Pune, India.
J. S. Chitode, Department of Electronics Engineering, BV (DU) COE, Pune, India.
802.11). All the three wireless technologies have an operating frequency of 2.4 GHz in ISM band. The data rates of Bluetooth, ZigBee and Wi-Fi are 1 Mbps, up to 54 Mbps and 250 kbps respectively. Though the data rate of ZigBee in minimum among the three technologies, it has wide range (up to 100 meter in line of sight) and low power consumption as well as device complexity as compared to Bluetooth and Wi-Fi [3]. The network latency of ZigBee is minimum as compared to its other two counterparts. The ZigBee devices join the existing network within 30 milliseconds whereas for Wi-Fi it takes about 3-5 seconds and 10 seconds for Bluetooth. The ZigBee network can have maximum 65,000 devices while Wi-Fi network can have 32 access points and Bluetooth can have only 7 devices at a time. From this comparative study it can be seen that the ZigBee is a more suitable technology for implementing a low power, low cost, reliable and secure wireless sensor/ad-hoc network.
A. IEEE 802.15.4 and ZigBee
Most of the wireless sensor/ad hoc networks use IEEE 802.15.4 standard protocol for communication. IEEE 802.15.4 standard states the Medium Access Control (MAC) and Physical (PHY) layers for low-rate “Wireless Personal Area Networks (WPAN)” with ubiquitous connection among the low-power and low-cost mobile or fixed nodes [1]. This is placed above the data link layer, the 2nd layer of Open System Interconnection (OSI) model. Function of this layer is to organize the digital information bits and translate them into the electromagnetic waves. There are two addressing modes namely, 64-bit IEEE addressing and 16-bit short addressing with maximum data rate of 250 kbps [2]. The IEEE 802.15.4 uses “Guarantee
Time Slots (GTS)” and “Carrier Sense Multiple Access-Collision Avoidance (CSMA-CA)” to elude collisions which may occur due to concurrent broadcasting by multiple nodes. In CSMA-CA every node has to check if the energy of medium is higher than a particular level, if it is so, then it has to wait for a specific time interval and try again. The IEEE 802.15.4 executes the channel energy scan to know if the channel is already occupied. A node will be permitted to transmit only if the energy of the channel is lesser than a particular set point or the medium is not being utilized by other node/s. GTS needs a PAN coordinator which is nothing but a central coordinator to assign time slots to every node. A node should transmit a GTS request to the PAN coordinator. The PAN coordinator reacts by responding with a beacon message that comprises of the allotted slot and the number of slots allotted to the requesting node.
Performance Evaluation of ZigBee/802.15.4 for
Implementation of Wireless Ad-Hoc Network
Several protocols use IEEE 802.15.4 as the MAC layer. ZigBee is the widely used short range communication technology based on IEEE 802.15.4 which offers four facilities namely, “encryption”, “association”, “authentication”, “routing protocol” and “application” [11]. There are three categories of ZigBee network nodes, viz. coordinator, router and end device. The end devices can make/establish connection with a coordinator or a router. The routers have ability to connect with other routers and coordinator.
II. LITERATUREREVIEW
A lot of research has been carried out by various researchers to evaluate the performance of ZigBee. Jin-Shyan Lee et. al. have presented a “comparative study of wireless protocols: Bluetooth, UWB, ZigBee, and Wi-Fi” based on different metrics such as complexity, the transmission time, power consumption and data coding efficiency in [3]. Wi-Fi is suitable for WLAN with communication of about 100 meter while Bluetooth, ZigBee, and UWB are used for WPAN communication of about 10 meter. It is also observed that ZigBee can range up to 100 meter in some line of sight applications. ZigBee and Bluetooth use very small transmission power of 0 dBm while the Wi-Fi uses 20 dBm. Therefore ZigBee and Bluetooth are appropriate for the low power and low data rate applications with limited battery power like battery-operated mobile and/or sensor networks. Due to their low power consumption, ZigBee and Bluetooth will lead to a long network lifetime. Whereas, Wi-Fi and UWB would be suitable for high data rate applications such as media transmission and surveillance, because of their controlled low energy consumption.
Authors in [4] have explained the fundamental concepts of ZigBee technology. Experimentation for testing of ZigBee communication range is done for indoor and outdoor scenarios.
Indoor scenario: Two experiments were conducted in Indoor scenario. First was for room to room communication and second was in the corridor.
a. Room to room communication: Rooms have two types of barriers - curtain walls and structure walls.
From the experimental results, authors have concluded that ZigBee modules need barrier free line of sight for efficient communication. The number of received packets decreased drastically between 10 to 15 meters which included one or more barriers.
b. Corridor communication: To study the effect of distance between ZigBee modules in direct line of sight condition authors measured the signal level (dBm) at the input of receiver. Authors observed irregularity in the number of received packets for packet size of 32 bytes. Whereas the number of received packets remained constant irrespective of the distance between the ZigBee modules for smaller packet size of 2 bytes. Moving of people in the corridor might interfere the signal resulting into loss of packets. But they will get refurbished the moment a clean line of sight is achieved. Authors have stated that the specified range of 30 meters could not be reached due to signal fading because of reflections.
Outdoor scenario:
Moving cars/people and houses/buildings are two types of barriers possible in outdoor scenario. RF signals get delayed
due to reflection by the obstacles in the line of sight. Signal fading can also take place due to refraction, diffraction and scattering. Authors have specified 25 meter (line of sight) and 60 meters (considering obstacles) as maximum communication range for indoor and outdoor scenarios respectively.
Authors in [5] had studied the effect of ‘optional acknowledged service in application support sub layer (APS ACK)’ of ZigBee standard for reliable transmission. They had considered following performance metrics:
a.Node connectivity: A node is said to be connected, if it can send data to the coordinator node in certain specified time period [4]. The network is stable if more nodes are interconnected.
b.Packet loss rate: is defined as the ratio of number of packets lost by the coordinator to the number of packets transmitted by the node.
c.Transmission throughput: is defined as the ratio of number of packets received by the coordinator to time for which they were received.
In node connectivity experiment, authors had considered number of disconnections over variable specified time period. From the results it was observed that the number of disconnections are highest when specified time period is 20 sec. As the specified time period increases then the number of disconnections are decreased indicating that router nodes can retransmit data packets through APS ACK technique of ZigBee. For packet loss rate experiment, transmission with and without APS ACK was considered. The maximum loss rate with APS ACK is 0.147% and without it is 3.86% [4]. Thus it is evident from the results that by using the APS ACK mechanism the packet loss rate could be considerably reduced to a very small value nearly zero. Authors could achieve transmission throughput of 25 Kpbs with APS ACK mechanism.
H. H. R. Sherazi et. al. present a detailed experimental analysis in [6] done with real test beds to estimate the effect of constantly varying communication surroundings on several factors, e.g. Received Signal Strength Indicator (RSSI), and latency in the existence of many hindrances/obstacles which may be responsible for severely degrading the network performance overall. They have suggested an apt frame size for ZigBee for efficient communication. While using ZigBee technology in indoor applications and home appliances, the RSSI of ZigBee radio is critically disturbed due to the existence of various physical objects. Authors in [5] have conducted the experiments in the availability of a few physical objects such as furniture, structured walls and humans etc. that may reduce the signal strength due to “reflection” and “scattering”. The experimental analysis show that ZigBee’s signal strength of is extremely susceptible to exterior factors in the surrounding where the communication is going on. From the results it is seen that with a smaller data frames of size 15 bytes took average 0.05 sec and larger frames of size 100-byte took average 0.15 sec to be fruitfully delivered. But the latency increases intensely at extreme large distance. They have concluded that the reliability of medium sized frame of 50 bytes is best in all the scenarios with variable distance within range and number of obstacles. Yu Chengbo et. al. present a
wireless sensor network
(WSN) implementation
for environment monitoring in greenhouse in [7]. The authors have confirmed that the design for environment monitoring in greenhouse is realistic with normal system performance, and user-friendly software. The ZigBee technology makes it possible to monitor and analyze the data from anywhere with the help of sensors. The whole system was tested at an agricultural ground in China and it continued to work with full functionality and stability for many months. This indicates the application prospects of ZigBee in agriculture as well. J. Baviskar et. al. recommend in [8] that the ZigBee is an effective short range wireless technology in terms of power consumption and scalability. The ZigBee data rate is suitable for control and monitoring. Authors have analysed the different ZigBee performance parameters by implementing star network topology for home automation system. From the experimental results, they had concluded that the average system “latency” came out to be 58.5 millisecond and the average “Round Trip Delay (RTD)” time was about 92 millisecond, with limited packet size up to 32 bytes.
Wan Du et. al. presented a study a real life industrial application of measurement and control of automobile vibrations by using the “MICAz” hardware platform, modeled by SystemC in the IDEA1 simulator in [9]. They implemented and studied slotted “CSMA/CA” protocol in “beacon-enabled” mode and the un-slotted “CSMA/CA” protocol in “non-beacon” enabled based on the performance metrics namely - packet delivery rate, power consumption per node, latency, and energy consumption per packet. They also evaluated 2 synchronization mechanisms of IEEE 802.15.4 standard, viz. the non-beacon and beacon tracking to analyse the effect of super frame order and the beacon order for different traffic loads. Authors have concluded that the beacon enabled mode proposes a higher packet delivery rate while the non-beacon enabled mode can deliver better latency and energy consumptions due to lack of necessity of resynchronization.
M. Tabassum et. al. studied the performance of ZigBee in outdoor and indoor environment for line of sight, physical obstructions and interference scenarios. They had focused on ZigBee’s signal strength of with and without interference in clean and clear environment as well as environment with trees, bushes and shrubs. They used “AirMagnet Spectrum Analyzer XT” to analyze the signal strength of communicating devices [10]. In order to find out the drop in signal strength with reference to transmission power of ZigBee, authors used an equation to calculate degradation
factor. For better signal strength, the value of degradation factor was lower and vice versa. As per the observations of authors, the performance of ZigBee was significantly degraded in indoor scenarios due to the presence of Bluetooth, Wi-Fi, and humans. Blocking the line of sight of the devices communicating with each other will vary the signal strength. In indoor environment, average -66 dBm signal strength was observed at 15 meter distance.
III. METHODOLOGY
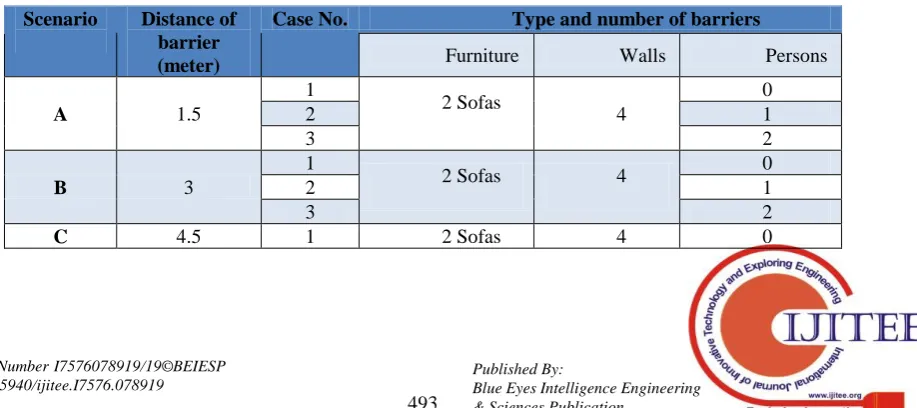
By studying the work done by various researchers as mentioned in literature review, it can be clearly said that the presence of various physical entities will act as a barrier to reflect/scatter the radio signals which in turn will significantly affect the received signal strength of the ZigBee. To study the performance of ZigBee node in a network for its range and ability to forward the data packets, Received Signal Strength Indicator (RSSI) is considered as the major parameter. Considering different indoor scenarios that may contain structural walls, furniture, persons etc. while using ZigBee technology, will help us to evaluate its performance for specific applications. Table 1 indicates different scenarios considered during experimentation.
Three scenarios viz. A, B and C are considered based on the distance between the nodes as 1.5 meter, 3 meter and 4.5 meter respectively to conduct the experiments. Every scenario has three cases wherein the number of barrier objects such as furniture and structural walls is same but the number of persons in the room were changed. Thus total nine different cases were instigated to study the effect of variation in the distance between the nodes and numbers of barriers/obstacles on the RSSI value in the indoor scenario.
A. Experimental Setup
Total five nodes were used to deploy an ad hoc network. Fig. 1 shows the placement of nodes in the network. Node ‘C’ is the coordinator of the network, ‘ED’ is the end device, while ‘R1’, ‘R2’, and ‘R3’ are acting as the routers.
[image:3.595.86.545.624.828.2]All the nodes are functioning in API mode during the experiments to transmit and receive the data frame/s. Node ‘C’ and router ‘R1’ are connected to a laptop wherein XBee configuration and test utility (XCTU) software is installed to observe the variation in RSSI value and time stamp to calculate the latency.
Table 1. Scenarios for different barrier conditions
Scenario Distance of barrier (meter)
Case No. Type and number of barriers
Furniture Walls Persons
A 1.5
1
2 Sofas
4
0
2 1
3 2
B 3
1
2 Sofas 4 0
2 1
3 2
2 1
3 2
[image:4.595.93.508.47.238.2]Fig. 1. Placement of nodes in the network
XCTU is designed to facilitate the developers to interact with “Digi XBee®” RF modules through a simple-to-use graphical user interface. The destination or end node ‘ED’ is connected to another laptop having XCTU installed.
[image:4.595.134.459.320.469.2]Using laptop can make the nodes portable and changing the distance between the nodes becomes feasible. The complete hardware arrangement is shown in Fig. 2.
Fig. 2. Hardware arrangement
IV. RESULTS AND DISCUSSIONS
The results for variation in RSSI values of routers R2 and R3 placed at distance of 1.5 meters under three cases viz. case 1, case 2 and case 3 are given in Table 2. It is seen that the RSSI value of both the routers decreases as the number of obstacles goes on increasing. It is also seen that the router that is closer to the coordinator node C’, has more RSSI value and forwarded more packets to the end device ‘ED’.
Moving of people in the room might interfere the signal resulting into reduced RSSI and the packets forwarded. But it will be refurbished the moment the clear line of sight is achieved. For smaller distance of 1.5 meters, it can be observed that the latency is approximately same for all the cases. Fig. 3 shows graph of variation in RSSI Value and packets forwarded through R2 and R3 under scenario A.
Table 2. Result table for scenarioA
Case
RSSI of R2 (dBm)
Packets through
R2
RSSI of R3 (dBm)
Packets through
R3
Transmitted (Tx) Packets
Received (Rx) Packets
Tx time (sec.)
Rx time (sec.)
Latency (sec.)
1 - 38 3 - 34 7 10 10 31.25 33.49 2.24
2 - 41 4 - 37 6 10 10 20.12 22.56 2.44
[image:4.595.86.511.628.712.2]Fig. 3. Effect of obstacles on RSSI Value under scenario A
The results for variation in RSSI values of routers R2 and R3 placed at distance of 3 meters under three cases viz. case 1, case 2 and case 3 are given in Table 3. It is seen that the router that is closer to the coordinator node C’, has more RSSI value and forwarded more packets to the end device ‘ED’. It is also
seen that the RSSI value of both the routers decreases as the number of obstacles goes on increasing.
For distance of 3 meters, it can be observed that the latency is increased as compared to scenario A.
[image:5.595.86.511.308.560.2]Fig. 4 shows graph of variation in RSSI Value and packets forwarded through R2 and R3 under scenario B.
Table 3. Result table for scenario B
Case
RSSI of R2 (dBm)
Packets through
R2
RSSI of R3 (dBm)
Packets through
R3
Transmitted (Tx) Packets
Received (Rx) Packets
Tx time (sec.)
Rx time (sec.)
Latency (sec.)
1 - 37 7 - 43 3 10 10 49.75 56.99 7.24
2 - 42 6 - 48 4 10 10 22.80 28.26 5.46
3 - 47 6 - 50 4 10 10 11.38 17.30 5.92
Fig. 4. Effect of obstacles on RSSI Value under scenario B
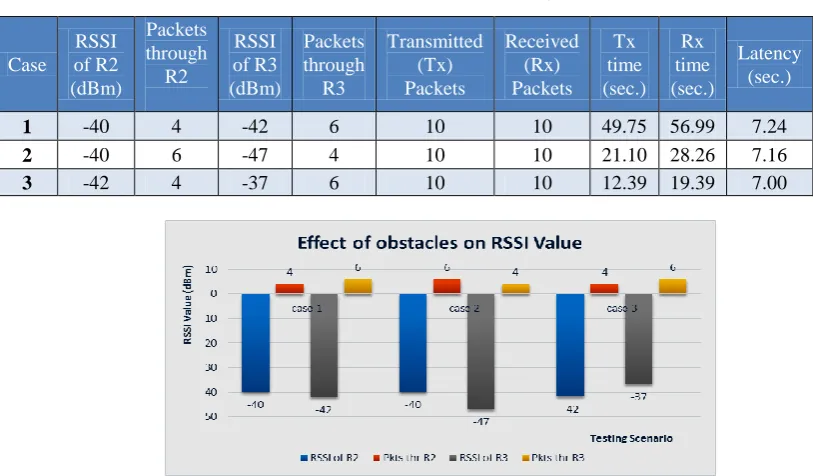
The results for variation in RSSI values of routers R2 and R3 placed at distance of 4.5 meters under three cases viz. case 1, case 2 and case 3 are given in Table 4. It is seen that the router that is closer to the coordinator node C’, has more RSSI value and forwarded more packets to the end device ‘ED’. It is also seen that the RSSI value of both the routers decreases as the number of obstacles goes on increasing.
Table 4. Result table for scenario C
Case
RSSI of R2 (dBm)
Packets through
R2
RSSI of R3 (dBm)
Packets through
R3
Transmitted (Tx) Packets
Received (Rx) Packets
Tx time (sec.)
Rx time (sec.)
Latency (sec.)
1 -40 4 -42 6 10 10 49.75 56.99 7.24
2 -40 6 -47 4 10 10 21.10 28.26 7.16
3 -42 4 -37 6 10 10 12.39 19.39 7.00
Fig. 5. Effect of obstacles on RSSI Value under scenario C
The graph of change in RSSI values of routers R2 and R3 with the variation in distance from 1.5 meters to 3 meters to 4.5 meters is shown in fig. 6. Table V summarizes the effect of distance variation on the RSSI value, number of forwarded
packets, packet delivery ratio and latency. It is observed that the latency increases with increase in the distance. The packet delivery ratio is observed to be 100% as for indoor scenario
[image:6.595.87.509.400.683.2]the distance was limited.
Table 5. Result table for effect of distance variation on RSSI and latency
Distance (meter)
RSSI of Router
2
(dBm)
Packets through
R2
RSSI of Router
3 (dBm)
Packets through
R3
Tx. Packets
Rx. Packets
Tx. time (sec.)
Rx. time (sec.)
Latency (sec.)
1.5 -42 4 -37 6 10 10 23 20 2.33
3 -42 6 -47 4 10 10 28 34 6.20
4.5 -51 5 -50 5 10 10 13 20 7.23
Fig. 6. Effect of distance variation on RSSI and Latency
V.CONCLUSION
Use of ZigBee technology for implementation of wireless ad-hoc/sensor networks is widely popular now a days. It has proved to be reliable and efficient wireless technology for short range WPA networks. But ZigBee is seriously affected by the barriers in the form of structured walls, furniture and persons in the indoor environment. These barriers affect the
received signal strength of the ZigBee which in turn will affect the data delivery and latency. This paper presents the experimental analysis of variation in distance between the nodes and number of
barriers based on
forwarded and latency. From the results it was observed that for the small frame size of 16 bytes the latency was of about 2 sec. for distance of 1.5 meters. The latency goes on increasing with the increase in the distance. Increase in the frame size may increase the latency further. A moderate size of frame can be proved to be reliable for variation in distance and number of barriers. The maximum line of sight range for ZigBee was found out to be around 48 meters in the outdoor environment. Considering the performance of ZigBee under all these limitations can help researchers to decide the suitable environment, distance between the nodes as well as the frame size in order to establish a wireless ad hoc network for reliable and efficient communication.
REFERENCES
[1] Sheikh Ferdoush, Xinrong Li, “Wireless Sensor Network System,
Design Using Raspberry Pi and Arduino for Environmental Monitoring Applications”, Procedia Computer Science, Volume 34, 2014, pp. 103-110
[2] IEEE 802.15 WPAN Task Group 4 (TG4), IEEE 802.15.4, [Online].
Available: http://www.ieee802.org/15/pub/TG4.html.[Accessed:
Thursday, 24 August 2017]
[3] Jin-Shyan Lee, Yu-Wei Su, and Chung-Chou Shen, “A Comparative
Study of Wireless Protocols: Bluetooth, UWB, ZigBee, and Wi-Fi,” 33rd Annual Conference of the IEEE Industrial Electronics Society (IECON) Nov. 5-8, 2007, Taipei, Taiwan
[4] I. Kuzminykh, A. Snihurov and A. Carlsson, "Testing of communication
range in ZigBee technology," 14th International Conference the Experience of Designing and Application of CAD Systems in Microelectronics (CADSM), Lviv, 2017, pp. 133-136.
[5] Jin-Shyan Lee, Yuan-Ming Wang, “Experimental Evaluation of
ZigBee-Based Wireless Networks in Indoor Environments,” Journal of Engineering, Volume 2013, January 2013.
[6] H. H. R. Sherazi, Razi Iqbal, Sana Ul Hassan, M. H. Chaudary, Syed Asfandyar Gilani, “ZigBee’s Received Signal Strength and Latency Evaluation under Varying Environments,” Journal of Computer Networks and Communications, Hindawi Publishing Corporation, Volume 2016.
[7] C. Yu, Y. Cui, L. Zhang and S. Yang, "ZigBee Wireless Sensor Network
in Environmental Monitoring Applications," 2009 5th International Conference on Wireless Communications, Networking and Mobile Computing, Beijing, 2009, pp. 1-5.
[8] J. Baviskar, A. Mulla, M. Upadhye, J. Desai and A. Bhovad,
"Performance analysis of ZigBee based real time Home Automation system," 2015 International Conference on Communication, Information & Computing Technology (ICCICT), Mumbai, 2015, pp. 1-6.
[9] Wan Du, David Navarro, Fabien Mieyeville, “Performance evaluation of
IEEE 802.15.4 sensor networks in industrial applications”, International Journal of Communication Systems, Wiley Online Library, 2014
[10]Mazin Al Hadidi, Jamil S. Al-Azzeh, Oleg P. Tkalich, Roman S.
Odarchenko, Sergiy O. Gnatyuk, Yulia Ye. Khokhlachova, “ZigBee, Bluetooth and Wi-Fi Complex Wireless Networks Performance Increasing,” International Journal on Communications Antenna and Propagation, Vol. 7, N. 1, February 2017