Rochester Institute of Technology
RIT Scholar Works
Theses
Thesis/Dissertation Collections
4-1-1990
A quantitative analysis of a self-emitting thermal IR
scene simulation system
James S. Warnick
Follow this and additional works at:
http://scholarworks.rit.edu/theses
This Thesis is brought to you for free and open access by the Thesis/Dissertation Collections at RIT Scholar Works. It has been accepted for inclusion
in Theses by an authorized administrator of RIT Scholar Works. For more information, please contact
.
Recommended Citation
A
QUANTITATIVE ANALYSIS
OF A SELF-EMITTING THERMAL IR
SCENE SIMULATION SYSTEM
by
James S. Warnick
B.S.E. University of Alabama in Birmingham
(1975)
A thesis submitted in partial fulfillment
of the requirements for the degree of
Master of Science
at
the
Center for hnaging Science
of
the
Rochester Institute of Technology
April 1990
Signature of the Author
_----:J:.:::aI:o.::.:ll~es:-W;:.:.;aIll=i:.::.:ck"'____
_
Accepted by
CENTER FOR IMAGING SCIENCE
COLLEGE OF GRAPIDC ARTS AND PHOTOGRAPHY
ROCHESTER INSTITUTE OF TECHNOLOGY
ROCHESTER, NEW YORK
CERTIFICATE OF APPROVAL
M. S. DEGREE THESIS
The M. S. Degree Thesis of James S. Warnick
has been examined and approved
by
the thesis committee as satisfactory
for the thesis requirement for the
Master of Science Degree
Dr. John R. Schott, Thesis Advisor
Dr. Roger
L.
Easton, Jr.
THESIS RELEASE PERMISSION FORM
ROCHESTER INSTITUTE OF TECHNOLOGY
COLLEGE OF GRAPHIC ARTS AND PHOTOGRAPHY
CENTER FOR IMAGING SCIENCE
I, James S. Warnick, prefer to be contacted each time a request for reproduction is made. I
can
be
reached at the following address:
64 State Street
Pittsford, NY 14534
Date
¢~
ABSTRACT
A
quantitativeevaluationis
performedin
whichthe
imaging
characteristics of aself-emitting
thermal
infrared
scene simulation system are analyzed.The
simulationsystemis
comprisedof an
energy
source(an Argon
laser),
optics,
a spatiallight
modulatorfor image
generationin
the
visible wavelengthenergy,
and antransducer
for
conversion ofthe
visiblewavelength
energy
image
to
athermal
IR image. After
construction ofthe
simulationsystem,
the
performance ofthe
simulation system andits
componentsis
analyzedby
measurementof :
(1)
the
Modulation Transfer
Function,
(2)
the temporal
response,
(3)
the
maximum
thermal
contrast,
and(4)
the
Noise
Equivalent Delta Temperature.
Additionally,
an evaluation was made of
the
performance ofthe
infrared
imaging
system usedto
viewthe
simulationsystem output
imagesby
measurement ofits
Modulation Transfer Function
andNoise Equivalent Delta Temperature. The
optimumarea of concentrationfor
overall systemACKNOWLEDGEMENTS
The
authorwishesto
extend appreciationto
Dr. John R. Schott for his
guidanceandsupport
in
this
effort.His
wasthe
initial
conceptthat
wentfrom
a sketch on paperto
reality
in
the
laboratory. He
alsofound
the
financial
resourcesto
fund
the
substantial expensesassociatedwith
this
work,
without which none ofthis
wouldhave been
possible.The
authoralsowishesto thank
Tim Gallagher for
the
hours
oftime
andresourcescontributedto
the
measurementinstrumentation. His
assistanceprovedto
be
of unparalleledimportance
in
the
completion ofthe task.
Finally,
the
author wishesto thank
the
otherthesis
committeemembers,
Dr. Roger Easton
andDr. Mehdi
Vaez-Iravani,
both
of which contributedsubstantially
to the
author'sunderstanding
ofthe
hardware
and measurement algorithmsdeveloped. Their
time
and effort providedthe
binder
to
hold
the
piecesDEDICATION
This
thesis
is
dedicated
to
my
wife,
Marcia,
for
her unwavering
support ofthis
undertaking.
Through
it
all,
shehas
been my inspiration
- alwaysunderstanding,
everencouraging,
and neverquestioning why
it
took
solong
to
complete.Without her
by
my
side,
I
wouldhave surely failed
to
realizethis
dream.
Have I
told
youlately
that
I love
you?
Have I
told
youthat
there's
no one above you?
Fill
my
heart
withgladness,
Take away my
sadness,
Ease my
troubles
that
whatyoudo.
Table
ofContents
List
ofFigures
List
ofTables
ix
xii
1
1.0 Introduction
1
.1
Thermal
IR
Imaging
Theory
3
1.2
Thermal
IR
Source
Characteristics
4
1
.3Thermal IR
Imaging
Systems
7
1
.4Thermal IR
Simulation
12
2.0 Thermal IR
Self-Emitting
Simulation System
Design
1
6
2.1
Energy
Source
17
2.2
Optics
18
2.3
Spatial
Light Modulator
1 8
2.4 Visible-to-IR Transducer
2 1
2.5
Viewing
System
22
3.0 Experimental Methods
24
3.1 System
Setup
andAlignment
24
3.2
Preliminary
Calibration
Measurements
25
3.3
Optical Transfer
Theory
27
3.4 MTF Measurement
Methodology
32
3.4. 1
Inframetrics
/
Werner Frei
Viewing
System
34
3.4.2 Simulation System
35
3.4.3
VIRT
36
3.5
Temporal Response Measurement
Methodology
37
3.5.1 SLM
37
3.5.2 VIRT
38
3.6 Maximum Contrast Measurement
Methodology
41
4.0
Results
44
4.1
Preliminary
Calibration Measurements
44
4.2
Modulation
Transfer Function
45
4.3
Temporal
Response
57
4.4 Contrast
57
4.5 Noise
Equivalent
Delta
Temperature
61
4.6
Pictorial Results
61
5.0
Conclusions
andRecommendations
64
6.0 References
70
7.0
Appendices
7.1 Appendix A Laser System
Specification
75
7.2 Appendix B
Optics Specification
76
7.3 Appendix C SLM Specification
77
7.4
Appendix D VIRT Specification
78
7.5 Appendix E Inframetrics
/
Werner Frei
Viewing
System
Specification
79
7.6 Appendix F Proof
ofShift Invariance for
the
Inframetrics
/
Werner Frei
Viewing
System
80
7.7 Appendix
G
Tatian's Method
ofComputing
the
MTF using
S
ampledEdgeTrace Data
88
7.8 Appendix H Algorithm for
Extracting
the
MTF
of a512
x512
image
Containing
aLarge Edge Area
9
1
List
ofFigures
Figure
1-1
Electromagnetic
Spectrum.
3
Figure
1-2
Spectral
distribution
ofvarioustemperature
blackbodies
6
Figure
1-3
Typical
thermal
IR
image.
8
Figure 1-4
Schematic
ofa simplethermal
IR
scanner.9
Figure 1-5
Schematic
of asimplefocal
planearray
thermal
IR
imaging
system.
10
Figure
1-6
Transmittance
ofthe
atmosphere andabsorbing
moleculein
the
atmosphereasafunction
of wavelength.1 1
Figure
2-1
Block
diagram
ofthe thermal
IR
simulation system.16
Figure 2-2
Action
ofliquid
crystal cellrotating
the
plane of polarizationofan
incident
beam
of polarizedfight.
1
9
Figure 2-3
Liquid
crystaltelevision
usedasspatiallight
modulator20
Figure 2-4
VIRT Construction
Details.
22
Figure 3-1
Simulation
system componentsontriangular
opticalbench.
25
Figure 3-2
Simple
imaging
system responseto
a point source.29
Figure 3-3
Test
arrangementfor
determining
the
MTF
ofthe
Inframetrics
/
Werner
Frei viewing
system.34
Figure 3-4
Test
arrangementfor
determining
the
MTF
ofthe
simulationsystem.
35
Figure
3-5
Test
arrangementfor
measurement ofthe
MTF
ofthe
VIRT.
36
Figure
3-6
Arrangement
to
measurethe
SLM
time
constant.38
Figure
3-7
Ideal
visiblefight
pulseinput
to
VIRT
usedto
measuretemporalresponse.
39
Figure
3-8
VIRT
theoretical thermalIR
output responseto
steppedinput.
39
Figure
3-9
Test
arrangementfor
measurement ofthe
VIRT
temporal
Figure
3-10
Test
arrangementfor
measurement of
the transmission
through the
SLM.
41
Figure
4-1
Digital
count
(DC)
to
effectivetemperature
conversion.44
Figure
4-2(a)
Image
oftest
edgeusedto
evaluateMTF
software.46
Figure
4-2(b)
MTF
oftest
edge shownabove.46
Figure
4-3(a)
Image
of singlevideoframe showing
substantialrandomnoise.
47
Figure
4-3(b)
Image
of64
videoframes
averagedto
reduced random noise.47
Figure
4-4(a)
Image
of vertical edge producedby
the
Inframetrics
/
Werner
Frei viewing
system48
Figure
4-4(b)
Vertical MTF
ofthe
Inframetrics
/
Werner Frei viewing
system.
48
Figure
4-5
(a)
Image
ofhorizontal
edgeproducedby
the
Inframetrics
/
Werner Frei viewing
system49
Figure
4-5(b)
Horizontal
MTF
ofthe
Inframetrics
/
Werner Frei viewing
system.
49
Figure
4-6(a)
Image
of vertical edge producedby
the
simulation systemas seen
by
the
Inframetrics
/
Werner Frei viewing
system.50
Figure
4-6(b)
Vertical MTF
ofthe
simulationsystem as seen withthe
Inframetrics
/
Werner Frei viewing
system.50
Figure
4-7
(a)
Image
ofhorizontal
edgeproducedby
the
simulation systemasseen
by
the
Inframetrics
/
Werner Frei viewing
system.5 1
Figure
4-7
(b)
Horizontal
MTF
ofthe
simulation systemas seen withthe
Inframetrics
/
Werner Frei viewing
system.5 1
Figure 4-8
Vertical MTF
ofthe
simulation system after removal ofthe
Inframetrics
/
Werner Frei viewing
systemMTF.
52
Figure 4-9
Horizontal
MTF
ofthe
simulation system after removal ofthe
Inframetrics
/
Werner Frei viewing
systemMTF.
52
Figure
4-10(a)
Image
ofthermalIR
edge producedby
the
VIRT
(Bly
Cell)
Figure
4-1
0(b)
MTF
ofthe
VIRT
(Bly
Cell)
as seen withthe
Inframetrics
/
Werner Frei viewing
systemand after removal ofthe
Inframetrics
/
Werner Frei viewing
systemMTF.
53
Figure
4-1 1
(a)
Theoretical
verticalMTF
ofthe
SLM.
54
Figure
4-1 1
(b)
Theoretical horizontal MTF
ofthe
SLM.
54
Figure
4-12
Theoretical
MTF
of a64
x64 detector array for
a50
mm x50
mmimage.
56
Figure
4-13
SLM Transmission.
58
Figure
4-14
SLM
relative pixelsize andspacing.59
Figure
4-15
Output image from self-emitting
simulation systemfor input
ofatribar target.
Tribars
andspaces are10
mm,
5
mm,
2.5
mmand1.25
mm wide.62
Figure 4-16
Output
ofself-emitting
simulationsystemfor
binary
input
of object.
63
Figure 5-1
Horizontal
Inframetrics MTF based
oninitial TFOV
data,
List
ofTables
Table
4-1
Results
ofTemporal Response
Measurements
57
Table 4-2
Results
ofContrast Measurements
59
1.0
Introduction
Throughout
existencewehave
used oursensesto
exploreourenvironment.
We have
obtained
knowledge
ofthe
world around usby
using
oursenses oftouch,
smell,
taste,
hearing,
and sight.The
senseofsight givesrise
to the
ability
to
determine
the
shape, size,
color,
andtexture
ofobjects andtheir
relationship
to
each other withoutthe
use ofthe
othersenses.
Through
the
use ofsight,
wecandetermine
these
object attributeswithoutcontacting
the
object,
i.e.,
sight givesusthe
ability
to
remotely
senseourenvironment.The
eyeis
optimizedas a sensorof visibleradiation.This
optimization allowsthe
eyeto
performits
primary
functions,
whicharethe
detection
ofreflectivity differences in
objectsilluminated
by
0.4
to
0.7
|imwavelength radiation andthe
recognition ofpatternsformed
by
these
reflectivity
differences.
While
muchknowledge
canbe
acquiredby
viewing
objectreflectancesin
the
visiblewavelengths,
additionalinformation
about objectscan
be
gainedthrough the
use ofelectromagneticenergy
outsidethe
visible range.Electromagnetic energy
with wavelengths greaterthan those
in
the
visiblerangehold
particular promise
for providing
new objectinformation. This
region,
whichextendsfrom
wavelengths of0.75
to
50
|im,
is known
asthe
infrared
(IR)
region andis
commonly divided into
sub-regions,
suchasnearIR,
midIR,
far
IR,
etc.The
thermal
IR
regionis
mostcommonly defined
asthe
range of wavelengthsfrom 8
to
14 |im,
socalled
because
earthtemperature
objects emit electromagnetic radiation with wavelengthsin
this
region.In
orderto
obtainthe
unique objectinformation
that
existsin
the thermal
IR
region,
somemeans other
than
human
visionmustbe
employedto
acquirethe thermal
IR data.
Imaging
systemshave been developed
that
respondto thermal
IR
wavelengths andradiated
from
the
objectsofinterest.
These
thermal
IR
imaging
systemsprovidethe
basis
for
information
extractionfrom
the thermal
PR
signatures radiatedby
allobjects.Many
ofthese
systems requiretesting
during
the
development
stage aswellasperiodic calibration
to
ensure properperformanceunderadverse conditionsthat
may be
encountered
in
normaloperation.The
workpresentedhere
describes
alaboratory
systemthat
can simulatereal-world
thermal
IR
scenessimilarto
those that these
systemsmightbe
required
to
image.
The
simulation system wasconstructedusing
anIon laser energy
source,
laser beam shaping
optics,
a spatiallight
modulator,
and avisible-to-IRtransducer
to
producethe
simulatedthermal
IR
scene.Such
a simulation system willfacilitate
the
testing
of variousthermalIR
imaging
systems sincethe
scene parameters caneasily be
altered,
allowing
assessment ofthe
response ofthe thermal
IR
imaging
system.An
analysisofthe
simulationsystem's performance parametersis
presentedto
quantify how
wellthe thermal
IR
scenes aresimulatedandwhattype
ofthermal
IR
imaging
systems mightbe
evaluatedusing
this
simulationsystem.Included in
this
analysis
is
ameasurement ofthe
simulationsystem's spatial resolution(MTF),
temporal
1.1
Thermal
IR
Imaging Theory
Thermal FR
imaging
systemsextend man's visionbeyond
the
visible wavelengthsinto
the
infrared
by
making
visiblethe
energy naturally
emittedby
objectsdue
to their
temperature
.Thermal IR
imaging
systems must respondto the
photonsemittedby
the
objects since
the
eyehas
no responset these
photonswhichare outsidethe
visible rangeof
0.4
to
0.7
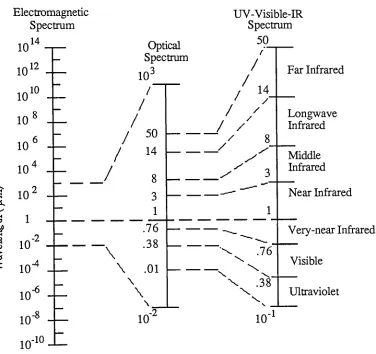
|imwavelengthenergy.IP
I
Electromagnetic
Spectrum
io1410
10
10
10
10
10
1
10
10
10
10"10
12
_10
8
6
4
2
r2->4 _r6-10
Optical
Spectrum
3
/
/
/
/
/
/
i50
14
8
3
1
\
10
.76 .38\
.01I
[image:16.555.84.460.264.618.2]\
UV-Visible-TR
Spectrum
50
r/
/
/
14
'/
I-y \ .76 \\
.38Far Infrared
Longwave
Infrared
Middle
Infrared
Near Infrared
Very-near Infrared
Visible
Ultraviolet
10
-1Specifically,
thermal
IR
imaging
systemsmusthave
aspectral response atwavelengths
where significantdifferences
in
temperature
andreflectivity
exist.This
is
necessary
to
assurethat the thermal
radiation patterns ofthe
scenecanbe
convertedto
contrast
differences
that
are sufficientfor
visualinterpretation
ofthe
convertedscene.Visual
spectrumimages
are producedprimarily
by
reflection andby
reflectivity differences
whereas
thermal
IR
images
are producedprimarily
by
self-emission,emissivity
differences
and,
to
alesser
extent,
reflectedthermal
IR
energy.1.2 Thermal IR
Source Characteristics
Every
objectwhosetemperature
is
above absolute zero emitsthermal
IR
radiation.Thermal
IR
radiationatterrestrial temperatures
consists of self-emitted radiationfrom
vibrationaland rotational quantum
energy level
transitions
in
molecules,
andsecondarily
from
reflection of radiationfrom
other sources.The fundamental
equationin
thermal
IR
radiation
is
the
Planck
Blackbody
Radiation
Law
whichdescribes
the
spectraldistribution
of
the
radiationfrom
ablackbody
asMx
=(1-D
(XXe^^-l)
where
M^
=the
spectral radiantemittance,
Cj
=the
first
radiation constant=lithe2,
C2
=the
second radiation constant=chlk,
Integrating
Planck's Law
overwavelengthlimits
whichextendfrom
zeroto
infinity
gives
anexpressionfor
the
radiantemittance,
that
is,
the
flux
per cm2
radiatedinto
ahemisphere
above ablackbody.
This
expressionis
known
asthe
Stefan-Boltzmann Law
and
is
expressed asM
= z,
T
= (fT(1-2)
I5c2h
where
M
=the
radiantemittancein W
cm"2,
andcr=
the
Stefan-Boltzmann
constant=5.67
x IO"12W
cm"2K"4-Differentiating
Planck's Law
with respectto
wavelengthandsolving for
the
maximum gives
Wien's Displacement Law:
3
A
(1-3)
where
Xm
=the
wavelengthof maximum spectral radiantemittance,
A
=2898
p:m-K,
T
=the temperature
ofthe
objectin Kelvin.
Figure 1-2
showsthe
spectraldistribution
for
objects of varioustemperatures.Notice
that
asthe
objecttemperature
increases,
the
wavelengthofthe
maximumspectrala> o c <a
uj
E
+s i CM
CL
O
CO
Visible
radiantenergy
band
Blackbody
radiation curveatthe
sun'stemperature
Blackbody
radiation curveatincandescent
lamp
temperature
Blackbody
radiation curveatthe
earth'stemperature
10
20 50
100
Wavelength
(|J.m)
Figure
1-2
-Spectral distribution
ofvarious
temperature
blackbodies.
Adapted from
Lillesand
(1987).
The
earth's averageambienttemperature
for
soil, water,
andvegetationis
about300
K.
From Wien's Displacement
Law,
the
maximumspectralradiantemittancefrom
earthfeatures
occursat a wavelength ofapproximately
9.7
(im.Man-made
objectscanhave
temperatures
wellabove earthambient,
someasmuchas100
K
ormore.The
maximumspectralradiantemittance
for
such objectsoccurs atwavelengthsless
than that
for
earth [image:19.555.74.458.87.393.2]The
above equationsdescribe
thermal
IR
radiationfrom
ablackbody,
that
is,
abody
that absorbs
allofthe
incident
radiantenergy
falling
uponit. As
aconsequence,
it
mustalso
be
aperfect
radiator ofthermal
IR
energy.A
blackbody
provides a standard ofcomparison
for
other radiation sources.A factor is normally inserted into
these
equationsto
describe
sources
(objects)
otherthan
blackbodies. This
factor,
calledemissivity,
is
the
ratioof
the
radiant emittance M'of
the
objectto the
radiantemittance
ofablackbody
M
atthe
sametemperature:
=
IJ
d-4)
Emissivity
has
anumericvaluethat
lies between
the
limits
of zerofor
anonradiating
source and
unity for
a perfectblackbody.
Emissivity
is
afunction
ofthe type
of materialand
its
surfacefinish
and canvary
with wavelengthandthe temperature
ofthe
material.Objects
that
canbe described
by
anemissivity
are calledgraybodies.1.3
Thermal IR
Imaging
Systems
All
thermal
IR
imaging
system mustconvertradiationin
the thermal
IR
regionto
visible radiation
for interpretation.
As
humans,
our eye-brain visual system allows usto
viewobjects
spectrally in
what we call"color". This
"color"
is
the
result ofthe
responseof
the
human
visual systemto
different
wavelengths of electromagneticenergy.The
primary
colorsofred, green,
andblue
correspondto
wavelengths ofroughly
620,
550,
and
480
nmrespectively,
welloutsidethe
region ofthermal
IR
energy.Since
there
is
nocolor associated with
thermal
IR
wavelengths, these thermal
IR
images
aretypically
converted
to
amonochrome representations ofthe thermal
ER energy
patterns.The
intensity
ofthe thermal
IR energy
is
normally
convertedsothat
hot
objects,
whichemitmore
energy,
appearbright
orwhitein
the
convertedimage
and cold objects appeardark,
(There
are exceptionsto
this,
such as color codedimages
wherecertaintemperatures
areassigned certain colors
for increased
interpretability,
but
they
are outsidethe
scope ofthis
workand will not
be
discussed.)
For
usein
digital
computers,
the thermal
IR
scenewillbe
quantizedinto
typically
128
or256
grey
levels,
depending
onthe
system andapplication.
These grey levels
arecommonly
referredto
asdigital
counts(DC)
and,
for
this
work,
digital
counts of0
and255
willindicate
the
coldest andwarmestpart ofthe
[image:21.555.195.363.317.460.2]thermal
FR
image
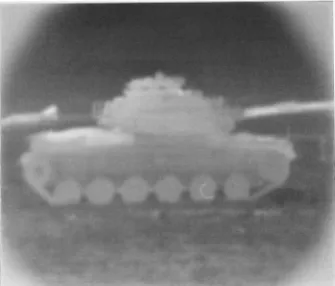
respectively.Figure 1-3
shows atypical
monochromethermal
IR
image.
Figure 1-3 Typical
thermal
IR
image.
The
capabilitiesof thermalLR
imaging
systemsareusually
described in
terms
ofscene temperaturesrather
than
in
radiometricterms.
The
contributionsofscenetemperature,
reflectivity,
andemissivity
canbe
representedatany
pointin
the
sceneby
asingle effective temperature.
This
is
the
temperaturethat
wouldproducethe
measuredirradiance
atthat
pointif it
were anideal
blackbody
radiator.The irradiance
measuredtemperature
whichis
less
than
the
effectivetemperature.
The
variationsin
the
effectivetemperature
ofa scenetend to
correspondto the
details in
the
visual scene sothat the
thermal
FR
imaging
system provides a visibleanalog
ofthe thermal
IR
scene.The
mostbasic form
ofathermal
imaging
systemis
the thermal
radiometer.Strictly
speaking,
this
is
anon-imaging device
whichmeasuresthe
radianttemperature
of objectswithin
its field
of view.However,
its
principle of operationis
fundamental
to true
thermalIR
imaging
systems.The
instrument's
collecting
opticsspectrally
andspatially filter
andfocus
the thermal
ER energy
radiatedfrom
a source elementonto adetector. The detector
serves
to transform the thermal
IR energy
into
electricalsignalsproportionalto the thermal
[image:22.555.79.456.383.624.2]IR
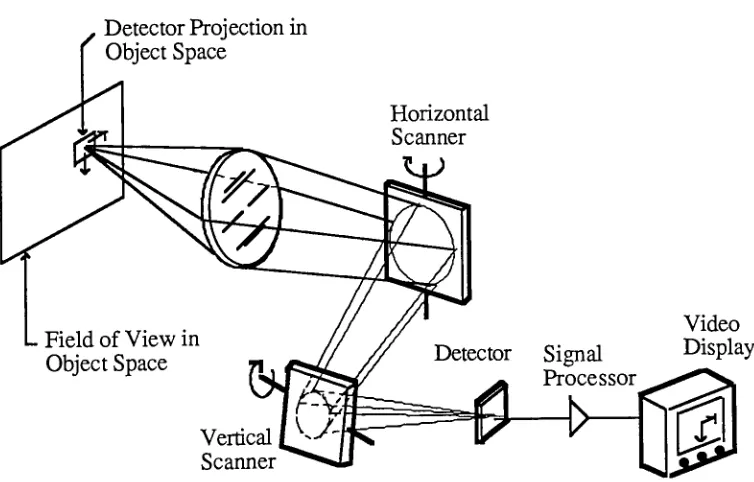
energy.Figure 1-4
shows a simple schematic ofathermal
IR
scanner,
oneofthe
mostcommon
thermal
ER
imaging
systems..
Detector Projection in
Object Space
Field
ofView in
Object Space
Horizontal
Scanner
Vertical
Scanner
Detector
Signal
Processor
Video
Display
Whereas
thermal
radiometersarenon-imaging
sensorsgenerating
one-dimensional profilesofradiant
temperature
data,
thermal
IR
scanners createimages
by
producing
atwo-dimensional
record ofthe
infrared
radiationfrom
a scene.This
image is
generatedby
sampling
the
sceneradianceatdiscrete
portionsofthe
scene(pixels). This is
accomplishedby
interposing
anopto-mechanical scannerbetween
the
optical systemanddetector
ofthe
thermal
radiometer.This
scanner consistsofa setofscanning
mirrors,
onesweeping
vertically
andthe
otherhorizontally,
imaging
optics,
and a singledetector
withassociated [image:23.555.103.440.354.560.2]signal
processing
electronics.Figure 1-5
shows a simpleschematicof another commontype
ofthermal
imaging
system,the
focal-plane
array.This
imaging
systememploys a2-D array
ofdetectors
located
atthe
focal-plane.
Detector
Array
Projection
in
Object
Space
Signal
Processor
Video
Display
Detector
Array
Located
atFocal
Plane
Figure 1-5 Schematic
ofasimplefocal-plane array
thermalPR
imaging
system.Focal-plane
array
imaging
systemsdo
not use mirrorsto
scanthe
detector
acrossthe
applications.
This
advantagemay be
offsetby
the
costofthe
detector
array
andofthe
electronics
associatedwith suchfocal
planearray
systems.However,
many
targeting
andreconnaissance
applicationsemploy
focal
planearray
imaging
systems.Thermal PR
imaging
systemsare superiorin
performanceto
othertypes
of passiveelectro-optical
imaging
devices
whenthe
primary
performanceconsiderationis operability
at
any
time
ofday
or night..This superiority is due
to the
high
contrast such systemsachieve
and,
asFigure
1-6
shows,
the
good atmospherictransmission
windows which areavailable
in
the thermal
ER.
wavelength region.100
80
2
60
to
40
c ea20
"1
2
3
4
5
6
7
8
9
10
11
12
13
14
Wavelength
(jim)
Far Infrared
|_Near
I
Middle
_ |~~
Infrared]
Infrared
TttTTT
TT
TT
T
Jt
T T
T
^^
h9o
a
7\
hJ.
H20
O
02
H20
C02
C02
H20
CO
2
Absorbing
Molecule
H20
co
co,
Figure
1-6
Transmittance
ofthe
atmosphereandabsorbing
moleculeThe
term
FLIR,
the
acronymfor Forward
Looking
Infrared,
generally
denotes
anIR
imaging
systemwhich operates onthe
samebasic
principles as atine
scanning
system.However,
the
mirrorfor
the
system pointsforward
andoptically
sweepsthe
field-of-view
of
the
thermal
detector(s)
acrossthe
sceneofinterest.
The
majorapplicationsfor FLERs
have in
the
pastbeen
limited
primarily
to
military
andintelligence
purposes.Their
functions
include
target
acquisition,
fire
control,
aerialnavigation, surveillance,
andintelligence
gathering.However,
non-military
applicationsofthermal
PR
imaging
arebecoming
more common.They
include
thermal
pollutionsurveys,
breast
cancerdetection
andother medical
diagnoses,
forest fire
prevention,
air-searescue,
manufacturing quality
control,
detection
offissures in
coalmines,
preventive maintenanceinspections
of electricalpower
equipment,
earth resourcessurveys,
aircraftlanding
aids,
crimeprevention,
andsmoke-penetrationaids
for
fire fighters
(Burnay,
etal.1988).
1.4 Thermal IR Simulation
All
thermal
ER
imaging
systems mustbe
tested
during
development
to
ensurethat the
desired
performanceis
realizedin
the
final
product.Field
testing
ofthese
imaging
systemsis
oftenacostly
approach when all ofthe
possible scenariosthat
mightbe
requiredfor full
system
testing
areconsidered.The
output ofthe
detector
portionofthe
imaging
systemmay
be
simulatedsothat, from
that
pointon,
systemperformance canbe
verifiedin
the
laboratory
undercontrolled conditions.Not
soeasily
simulatedis
the
actualthermal
IR
scene
that the
systemis
requiredto
image. This
simulationis
essentialin
orderto
verify
the
overallend-to-end performance of
the thermal
PR
imaging
system.Many
ofthe
systemsdescribed
aboveare requiredto
perform underless
than
ideal
conditions,
producing
images
while
viewing
scenesthrough
atmospherescontaining
a widevariety
ofobscurants.imaging
systemsis
wellestablished(Pritchard,
1988). For
the
majority
ofapplications,
the
simulation
system mustmeetthe
following
requirements:1. The
spatial resolution ofthe
simulated scene mustbe
atleast
ashigh
asthe
imaging
sensor undertest, preferably higher
by
afactor
oftwo to ten.
2. The
simulated scene mustbe dynamic
for
real-time applications.The settling
time (the time
requiredfor
the
simulated sceneto
setdeto
withinonegray
level)
mustbe
withinthe
framing
time
ofthe
imaging
systembeing
tested.
3.
The
simulated scene must producethe
rangeofradiances(apparent temperatures)
of
the
real world scenebeing
simulated.Generally,
alarge
temperature
rangewillcost
in
terms
ofthe
other performanceparameters.4.
The
simulated scenemustsimulate andmaintainthe
radianceof each pixelmodeled,
i.e.
have
the
proper radiometricresolution.Numerous
approachesto
self-emitting
thermal
ER
scenesimulationhave been
explored.
Details
ofthe
simulation systems are oftenCompany-proprietary,
but
someofthe
conceptshave been
reported(Barnett,
1987):
A. Infrared Cathode
Ray
Tube
-A
CRT
that
radiatesthermal
IR energy
whenhit
by
an electron
beam,
muchlike
the
operation of atelevision,
has
been
reportedby
Rusche (1987). This device
is
ableto
changethe
scenerapidly,
but is limited in
the
magnitude of
thermal
IR energy
output.Also,
the
outputwavelengthofthe thermal
IR energy
is discrete
ratherthan
broadband.
B. Scale Model
withHeat
Lamp
-Scale
modelsof
targets
andbackgrounds
real-world
thermal
ER
scenes(Barnett,
1987). Thermal
properties of materialstend
notto
scalewell and
simulating
the
dynamic
convection,
conduction,
andradiationheat
transfer
processesis
generally
too
muchto
askofascale model.C.
Array
ofMiniature
Heating
Coils
-Systems have
been
built
which
employ
alarge
number oftiny heating
elements,
eachindividually
controlled(Tsdaka,
1983
and
Schildkraut,
1987).
These
devices have
large
size, power,
andcooling
requirements.
There is
a gooddeal
oflateral
heat transfer,
andthe thermal
responseto
achanging
sceneis
very
slow.D.
Bly
Cell
The
Bly
Cell
is
a visible-to-ERtransducer
consisting
of avery thin,
blackened
membranehoused in
an evacuated cell(Bly,
1980). A
visibleimage
is
projected onto one sideof
the
membranethrough
avisible window.The
membraneheats
more wherethe
light is
moreintense,
andradiatesacorresponding
thermal
IR
image
through
aninfrared-transmitting
window onthe
opposite sideofthe
cell.The'
limiting
factor
ofthe
cellis its
somewhatlimited
temperature
rangeE. Thermo-Electric Element
Array
-A
solid-stateversionofthe
heating
coilarray
system,
sometimesreferredto
asElectrically
Heated
Pixels,
has been
reportedby
Pritchard
(1988),
Daehler
(1987),
andBurriesci
(1987). Resistor
elements areetched
from
a monolithic silicon substrateandareheated
above ambienttemperature
by
passing
an electric currentthrough
eachelement.Power
requirementsandheat
dissipation
present substantial problems sincethe
array
consistsofthousands
ofelements.
F.
Infrared Modulator
-A variety
oftechniques
for modulating
the
radiationfrom
anextended
blackbody
sourcehave been
investigated.
One
such methodusing
the
Infrared Liquid Crystal Light Valve
is
representative ofthis
approach(Efron,
1985).
crystal
light
valve.The
systemhas
aslowresponsetime,
asomewhat
limited
dynamic
rangeandthe
liquid
crystallight
valveis presently very
expensive.These
approaches canbe
separatedinto
three
categoriesofself-emitting
simulators;
those that
emitthermal
ER
radiation,
those that
modulatevisibleradiationbefore
converting
it
to thermal
PR
radiation,
andthose that
modulatethermal
ER
radiation.In
general,
emission
displays
canbe
very
accuratebut
sufferfrom
restrictedtemperature
range andpoor powerefficiency.
Modulated displays
can produceawidetemperature
range atthe
expenseofaccuracy.
Various
combinationsoffeatures
from
these
approacheshave
been
tried
withlimited
success,
such asHalftone Reflective Images
(Baer,
1988),
the
SCANAGON
scene projector(Woltz,
1988),
a video projector withthe
Bly
Cell
(Lee,
1988),
aLaser/Scanner/VO- Modulator
(Lujan, 1988),
aLaser/Color Temperature
Simulator
(Park, 1988),
Infrared Transparencies
(Ghilai, 1987),
andaThermal
Screen
(Purdy,
1976).
At
the
presenttime,
allfall
short ofsatisfying
all ofthe
above statedrequirements
by
varying
amounts.Batishko
(1988)
described
a simulation systemthat
employed a visibletight
source,
aspatial
light
modulator,
andavisible-to-ERtransducer
to
create aself-emitting
thermal
ER
scene.
The
workpresentedhere is
modeled onthat
systembut has been
modifiedto
include
animproved
spatiallight
modulatorandaBly
Cell in
place ofa graphitefoil
visible-to-ER
transducer.
The design
ofthis
systemis
reviewedin
the
next section.It
is
expected
that
the
proposedthermal
ER
simulation system willmeetthe
spatial resolutionanddynamic
scenerequirements mentioned abovethrough
the
useofthe
spatiallight
modulator.
Also,
suchasystem shouldmeetthe
range of radiances requiredfor
simulationof earth object scenes
through the
use ofthe
Ion laser energy
source andthe
Bly
Cell.
Finally,
it
is
expectedthat the
simulation system will simulateandmaintainthe
proper2.0
Thermal
IR
Self-Emitting
Simulation System Design
The
thermal
ER
simulation system proposedfor study
usesa visiblelight
source and aspatial
light
modulatorto
create a visibleversionofthe
thermal
ER
scene.This
visible sceneis
convertedto
aself-emitting
thermal
ER
scenethrough the
useof avisible-to-ERtransducer
(VIRT).
The
arrangementofthe
various componentsfor
this
simulation systemis
shownin
the
block
diagram below.
Input
Synthetic
ER
Images
Output
Thermal ER
Images
Figure 2-1
-Block diagram
of
the thermal
IR
simulation system.By
creating
the
simulated scenein
visiblewavelengths,
common opticalelementscanbe
usedkeeping
the
costofthe
simulation systemlower
than
if beam
expansion and spatialmodulation were performed
in
the thermal
IR
wavelengths.Also,
componentand system alignmentis
mucheasier withthe
energy beam
being
visibleto
the
eye.Each
component canbe
thought
of as asubsystem whoseperformance mustbe
each
subsystem
is
afunction
ofthe
requirementsandperformance ofthe
other subsystems.While
muchofthe
initial design
workstartedwiththe
desired
final
outputthermal
PR
image
and
moved
backwards
through
the
systemto
determine
the
design
parameters
of eachsubsystem
component,
the
simulationsystem willbe described
from
sourceto
output,
just
as
the
energy is
transferred through the
system.2.1
Energy
Source
The
energy
for
the thermal
ER
simulation systemwassuppliedby
anominal5-watt
Argon Ion laser
whoseoutputenergy is in
the
blue-green
region ofthe
visible spectrum(454
nmto
5 14.5
nm).The
power outputrequiredfrom
the
laser is
afunction
ofthe
subsystem component efficiencies.
The laser
providesthe
necessary energy in
acollimatedbeam approximately 1.5
mmin
diameter
whichhas
a gaussianintensity
profile.The laser
cavity
tube
contains glasswindowsinclined
atBrewster's
Angle,
that
is,
the
angle at whichthe
incident beams
reflectionis
zerofor
light
whoseelectric-fieldvectorties
in
the
plane ofincidence.
These
windows areusedto
increase
the transmission
ofenergy from
the
laser
cavity
tube
(less
internal
reflection)
andresultsin
the
outputbeam
being linearly
planepolarized with
the
electric-field vector vertical.This
polarizationis
anecessary feature in
the
operation ofthe
simulationsystem aswillbe discussed later in
this section.
The laser
systemis
conductively
watercooled,
providing
a stablehigh energy
sourcewith which
to
begin
the
simulation process.The laser
system providestwo
modes ofregulation
for
the
output,
light
regulationandtube
currentregulation.For
this
application,
the
system was operatedin
light
regulation which provides a stablelight
output regulatedto
0.2%
(Coherent,
1988). The
outputpowerfrom
the
laser
is
afunction
ofthe
wavelengthof
light
selected.The laser
system wasoperatedin
the
multiline modeproducing
ameasured output ofcontinuouspower
in
excess of7 Watts. Appendix A lists
the
2.2
Optics
The
smallbeam from
the
laser
mustbe
expandedin diameter for
usein
the
simulationsystem.
A
simplebeam
expander(Galilean
telescope)
expandsthe
diameter from 1.5
mmto
approximately
50
mm(measured
atthe
1/e2pointsofthe
beam
profile).This
methodeliminates
the
possibility
ofcreating
ozonedue
to
airbreakdown
atthe
focus
ofthe
laser
beam,
asmight occur withthe
Keplerian
methodofbeam
expansion.Because
the
beam is
not
brought
to
afocus,
no spatialfiltering
ofthe
laser beam
is
possible.This
resultsin
aminoramount ofnoise
in
the
laser energy
sourcebut
is
notdetrimental
to the
performanceof
the
simulation system.Appendix B
lists
the
optical elements used andillustrates
the
Galilean
method ofbeam
expansion.2.3
Spatial
Light Modulator
The
expandedenergy beam
mustbe
spatially
modulatedto
createthe
visible versionof
the thermal
ER
image.
This
is
accomplishedthrough the
use ofaspatialtight
modulator(SLM). This
spatial modulationis
similarto that
of a photographic slidein
a slideprojection system which creates a visible
image
by
the
selective spatialtransmission
oflight
to the
projection screen.The SLM
usedin
the
simulation systemis
a modifiedliquid
crystal
television
(Tai,
1986
andBoreman,
1988).
This device has been successfully
usedas aspatial
light
modulatorfor
optical pattern recognition(Yu,
etal,
1987
andGregory,
1986),
real-time optical signalprocessing
(Hughes, 1987; Yu,
etal,
1986; Young,
1986
and
Liu, 1985),
andin
specklemetrology
(Bates,
1988). Specifications for
the
specificLCTV
selectedfor
this
workarecontainedin Appendix
C.
When
used asa televisionreceiver, the
LCTV
uses a smallfluorescent
lamp
as alight
source
for
image
generation.The light
from
this
sourcepassesthrough
aplastic polarizercrystal
array
whichis
composedof240 horizontal
rowsofpictureelements
(pixels)
witheach row
containing
384
pixelsfor
atotal
of92,160
pixels.Each
pixel canbe
thought
ofasasingle
liquid
crystal cell.A
voltagecanbe
applied across each cellto
controlthe
liquid
crystal
twisted
nematic effect.When
there
is
no voltage acrossthe
cell,
the
planeofthe
polarized
light is
rotatedby
90 degrees
by
the
liquid
crystal.
After
exiting
the
array,
this
polarized
light
passesthrough
another plastic polarizer whose planeofpolarizationis
rotated
90 degrees
to the
input
polarizer,
allowing
the
light
to
passthrough.
This is
the
maximum
transmission
ofthe
liquid
crystal array.Input
Polarization
Plane
Liquid
Crystal Cell
Output
Polarization
Plane
Figure
2-2 Action
ofliquid
crystalcellrotating
the
planeof polarization ofan
incident
beam
of polarizedlight. Adapted from Magnavox (1989).
As
the
voltage acrossthe
cellis
increased,
the
amount of rotationdue
to the twisted
nematiceffectwill
decrease,
resulting
in less light
being
transmitted
through the
cell untilthe
pointis
reachedwhereno rotationoccursin
the
cell.This
is
the
point of minimumtransmission
To
usethe
LCTV
as aSpatial Light Modulator in
the
simulationsystem,
the
self-contained
light
sourcebehind
the
liquid
crystalarray
was removedto
allowthe
expandedlaser beam
to
passthrough the
array.The
low-quality
plasticpolarizerswerealsoremovedfrom both
sidesofthe
liquid
crystal array.A
high-quality
dichroic
polymer polarizer wasplacedon
the
outputsideofthe
LCTV. The
input
sidedoes
notrequirethe
use ofapolarizeras
the
beam from
the
laser
is
already
linearly
planepolarizeddue
to the
Brewster
windows mentioned
in
Section 2.1. The LCTV
createsthe
visibleimage
by
transmitting
the
expandedlaser beam in
image
areasthat
areto
be light
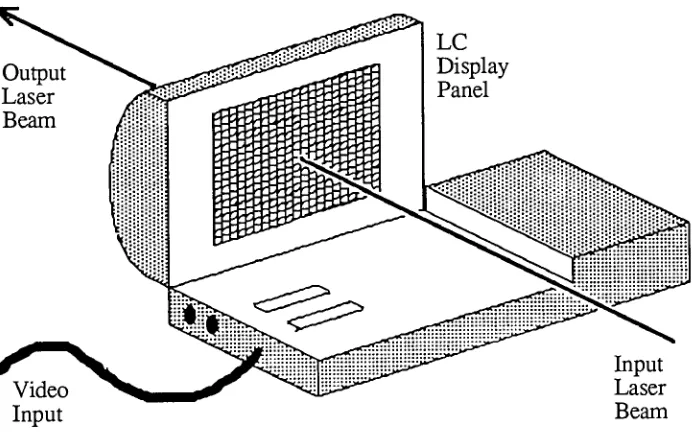
andnottransmitting
beam energy
in
areasthat
areto
be dark
asshownin Figure
2-3
below.
Video
Input
Input
Laser
Beam
Figure
2-3
Liquid
crystaltelevisionused as spatiallight
modulator.Because
it
wasdesigned
as aliquid
crystaltelevision,
the
SLM
accepts video signalsas
input
andtherefore
allowsdynamic input
to the
simulationsystem.The input images
arenot standard visible scene
images
sincethere
is
nocorrelationbetween
visibleimages
and [image:33.555.84.430.300.517.2]be
thermally
white(or
hot)
and,
therefore,
would notbe
the
properinput
to the
simulationsystem.
Such input
scenesmustbe
synthetically
createdfrom
thermal
modelsthat
accountfor
the
temperature,
emissivity,
andreflectivity
ofobjectsin
the thermal
ER
(Warnick,
etal,
1990).
The
generationofthese
synthetic scenesfor input
to the
simulation
systemis
outside
the
scopeofthis
work.2.4
Visible-to-IR Transducer
The spatially
modulatedenergy from
the
SLM
mustbe
convertedfrom
visiblewavelengths
(0.4
to
0.7
|im)
to thermal
IR
wavelengths(8
to
14
[im).
This
is
accomplished
through
a visible-to-ERtransducer
(VERT).
Such
adevice
has been
previously
used(Bly, 1980)
andis
commercially
available(Eppley
Labs,
1980). The
transducer
is
comprisedof avery
thin
(500
A)
membrane enclosedin
anevacuatedcellasshown
in
Figure
2-4 below. The
membraneis
coatedon one sidewith anabsorbing
film
(gold
black)
to
achievehigh
absorptionin
the
visible wavelengthsandhigh emissivity in
the thermal
ER
wavelengths(Harris,
1948). The
visibleimage is
projected ontoonesideofthe
membranewhereit is
absorbed and convertedto
localized heat. Because
the
heat
capacity
ofthe
membraneis
very
low,
the
surfacequickly
achieves a stabletemperature.
With
the
membranein
vacuum,
the
primary
method ofheat
transfer
is
radiationfrom both
the
front
andback
surfaces ofthe
membrane.The
vacuumcellhas
windows on oppositesidesof
the
membrane.One
windowtransmits
the
visibleenergy
to the
membrane whilethe
othertransmits
the thermal
ER energy
given offby
the
membrane.Bright
pointsin
the
visible
image
become hotter
than
dark
pointssothat
the
membraneradiatesthermal
IR
energy
in
away
similarto
arealscene.Specifications for
the
VERT
subsystem aregivenin
Cellulose Nitrate
Substrate
Gold Black
Deposit
Front Window
(Pyrex)
Rear Window
(Ge)
Vacuum Cell
Figure 2-4 VIRT
Construction Details. Adapted from Eppley.
2.5
Viewing
System
To
viewthe
simulatedthermal
ER
scene,
athermal
IR
imaging
system mustbe
employed.
For
this
work,
anInframetrics Model
600
Imaging
Radiometer
wasused,
providing
a real-time video output ofthe
simulatedthermal
IR
image.
This
system wascoupled
to
aPC-based image
processing
systemdeveloped
by
Werner Frei
Associates,
using
their
Imlab
software.This
image processing
system allowsthe
outputimage from
the
Inframetrics
to
be
digitized
and storedfor later
analysis.In
additionto
viewing
the
input
staticvideoimages into
the
SLM. A
videotime-base
corrector(TBC)
was used as avideo
frame
grabberto
hold
andcontinuously
display
the
videoimage input
to the
SLM
while
the
image
processing
system viewedthe
simulation systemoutputfor
that
input.
3.0
Experimental Methods
The
performance ofthe
simulation system wasquantifiedthrough
an evaluation ofits
output
thermal
PR
images. These
images
wereevaluated with respectto the
performanceparameters
described
in
Section
1.4, i.e.,
spatialresolution,
temporal
response,
maximumthermal
contrast,
andradiometricresolution.Experimental
methods weredeveloped for
the
measurement ofeachparameteras
it
relatesto
eachcomponent andto
the
completesimulationsystem.
Detailed
descriptions
ofthese
methodsarepresentedin
this
sectionwhile
the
results willbe
presentedin
the
following
section.3.1
System
Setup
andAlignment
The
first step
towards
creating
acrediblethermal
ER
scenein
the
laboratory
is
the
proper construction of
the
simulationsystem.The
system was constructed on atwo
metertriangular
opticalbench
asdescribed in
the
previous section.All
components weremounted on movable carriers
to
facilitate
alignmentandproper componentpositioning,
both
of which are criticalfor
optimal simulation system performance.Figure 3-1 illustrates
the
individual
components mounted onthe
triangularbench.
A
systematic procedure wasdeveloped
to
alignthe
system componentsduring
the
initial
constructionandto
verify
system alignmentbefore
each operation ofthe
simulationsystem.
During
systemoperation,
periodic component alignment checks were madeto
ensure optimal performance ofthesimulation system and
accuracy in
the
performancemeasurements.
Included in
the
setup
procedureis
the
evacuationofthe
"VTRT
cellto the
proper pressure
level
to
ensure maximumefficiency in
the
conversionofthe
visiblelight
image
to
athermalER image.
By
using
adiffusion
vacuumpumping
system, the
VERT
cellwas evacuated
to
apressure ofapproximately
IO'5
operation
(Eppley
Labs,
1980). The
VERT
cell canhold
this
vacuumfor approximately
12
hours
thus
allowing
ampletime
for
operationandtesting
ofthe
simulation system.Optics
Inframetrics
IR
Camera
TBC
-i;...hb
Y^
PC
Imaging
Workstation
Figure 3-1
-Simulation
system componentson
triangular
opticalbench.
3.2
Preliminary
Calibration Measurements
Before
the
performance parameters ofthe
simulation systemcouldbe
quantified,
several
preliminary
measurements werenecessary
to
assistin
determining
system andcomponentperformance.
The Werner Frei Imlab
software packageprovidesadjustment ofgain and offset
for
digitizing
the
outputimage
from
the
Inframetrics ER
camera,
thus
allowing
adjustmentsin
the
range ofdigital
counts(DC)
to
whichimage is
quantized.To
determine
the
proper values of gainandoffset,
a10-step
grey
scaleimage (which is
outputby
the
Inframetrics PR camera)
was used.Once
digitized,
the
DC
rangefor
this
grey
scaleimage
wasexaminedand adjustments were madeto the
gainand offsetsothat
the
minimumensuring
the
proper quantization ofthe
Inframetrics'outputimages.
These
valuesof gainand offset were recorded and verified
for
each operation ofthe simulation
system.In
orderto
quantify
the
performanceofthe
simulationsystem,
the
outputtemperatures
ofthe
simulatedthermal
ER
scenemustbe
measured.Since
the
outputfrom
the
Inframetrics
/
Werner
Frei viewing
systemis
a2-D array
ofdigital
counts(DC)
whichrepresents
the
sampled radiancevalues ofthe thermal
ER
image,
aconversionfactor from
DC
to
temperature
mustbe
established.For
real-worldscenes,
the
radiance sampledby
asensor
is
afunction
ofobjecttemperature,
emissivity,
and reflectedbackground
thermal
ER
energy.
Object emissivity
(reflectivity)
varies with materialtype
withinthis
real-worldscene,
making
conversionofimage DC
to
objecttemperature
quitedifficult.
However,
the
simulation systemhas
a constantemissivity
sincethe thermal
ER image is
generatedonthe
membraneof
the
VERT.
All
radiance contrastsobservedin
the
outputimage
aredue
to
temperature
differences. Since only
a single objectemissivity
valueis involved in
the
simulated
image,
aconversion ofDC
to temperature
is
possible.To
determine
the
DC-to-temperature
conversionfactor
for
the
Inframetrics
/
Werner
Frei viewing
system,
ablackbody
sourceofknown
uniformemissivity
andcontrollabletemperature
was employed.It
shouldbe
notedthat
ablackbody,
by
definition,
has
anemissivity
of1.0.
(The
blackbody
source usedin
this
workhas
anemissivity
of0.986
over
the
wavelength region of8
to
12
|immaking
it,
technically,
a greybody.However,
the term
blackbody
is
commonly
appliedto
suchasource with uniformemissivity
overthe
spectral region since
it
emitsaconstantfraction
ofthe
radianceemittedby
atrue
blackbody.) By imaging
the
blackbody
atvarioustemperatures
withthe
Inframetrics
/
Werner Frei viewing
systemandmeasuring
the
DC
ofthe
resulting
outputimage
ofthe
uniform
blackbody
surface,
aplot ofEffective Temperature
versusDC
was generated.The
effective
temperature
is
the
temperatureofthe
blackbody
multipliedby
it's emissivity
and,
as stated
in Section
1.3,
is
the temperature that the
blackbody
appearsto
be
as seenby
the
DC
versustemperature
data
to
yieldthe
slope andintercept
ofthe
regressionline,
thus
providing
the
equationfor
conversionofDC
to
effectivetemperature
for
the
Inframetrics
/
Werner Frei viewing
system.It
shouldbe
notedthat
this
equationis
validonly
overarangeof5
C
centered at25C,
both
of which wereusedonallmeasurements
ofthe
simulation system and components.
Any
changein
the
temperature
range ofthe
Inframetrics
ER
camerawouldresultin
achangein
the
DC-to-temperature
conversionfactor. Section 4.
1
containsthe
resultsofthe
preliminary
calibration measurements.3.3
Optical Transfer
Function
Theory
The
Optical Transfer Function
(OTF)
is
usedextensively
to
characterizethe
performanceof
imaging
systems.The
OTF
specifiesthe
relative attenuationofthe
spatialfrequency
componentsofthe
objectin
the
resulting
image
producedby
the
imaging
system.The
use ofthe
OTF in
performanceevaluation ofimaging
systemsbegan in 1935
withaseries of papers published
by
P.MDuffieux
(Williams
andBecklund,
1989).
By
the
late
1940s,
Schade
(1948)
began using Fourier
analysistechniques to
expandthe
OTF
conceptto
analysisofthe
image quality
oftelevision
systems.During
the
1960s,
the
Fast Fourier
Transform
wasdeveloped
by Cooley
andTukey (1965)
thus
making OTF
calculationssignificantly
easierandthus
expandedits
use.Through
the
1970s
and80s,
the
OTF
approach receivedwide acceptance and
is
considered essentialin
imaging
systemperformance evaluation.
In
the
analysis of opticalimaging
systems,
pointsources arefrequently
consideredasobjects,
examining
whateffectsthe
imaging
systemhas
onthe
formation
ofthe
image
ofthe
point sourceobject.For
such ananalysis,
all real-world objects canbe
consideredasaconvenient
for
mathematicalanalysis.These
small pointsources arecommonly
referredto
as
impulse
ordelta
functions
(Gaskill, 1978)
and aremathematically
expressed asS(x,y)
=Um
-L-Gaus(
|
,2.
)
(3.1}
The
image
ofa point sourcecanneverbe
as precise asthe
point sourceitself
due
to the
scattering
ofthe
pointsourceenergy
asit
passesthrough the
imaging
system.This
scattering is
afunction
ofmany
factors
suchasthe
diffraction,
aberration,
anddefocusing
effects
found
in
the
imaging
system components.The
mathematical expression ofthe
distribution
ofthe
energy in
the
image
ofapoint sourceis known
asthe
Point Spread
Function
(psf).
For
animaging
systemthat
is
both linear
andshift-invariant,
the
outputimage is
equalto the
input
object convolvedwiththe
ps/
(Dainty
andShaw, 1974),
ori(x,y)
=object(x,y)
*psf(x,y)
(3-2)
where*
indicates
the
convolution process.This
process canbe
expressedmathematically
as
oo
i(x,y)
=\\ox,p)
psf(x-a,y-P)dadP
(3-3)
-oo
where
o(a,P)
is
the object,
i(x,y)
is
the
image
ofthe
object,
andImaging
System
Object
Image
Figure
3-2
Simple
imaging
system responseto
a point source.The
convolution processis
carried outin
the
spatialdomain
and canmathematically
intensive.
The
processcanbe
recastby
transforming
to the
frequency
domain
viathe
Fourier
transform,
whichis
expressedmathematically
asF<Z,V)
=\\f(x,y)
ei2n(^+ny)
dxdy
(3-4)
where
F(t;,r\)
is
the
function in
the
frequency
domain,
andf(x,y)
is
the
function in
the
spatialdomain.
By
tra