•
Graphs and Notes
on the
Economic Situation
in the Community
Graphiques
et notes rapides
sur Ia conjoncture
dans Ia Communaute
European
Communities
Commission
Communautes
Europeennes
Commission
8-9
1968
GENERAL INFORMATION
COLOURS
ye I low brown , blue green Germany (FR)
Belgium France . Italy . Luxembourg, Netherlands , Community .
brown, broken line , red black
SOURCES
Statistical Office of the European Communities, National Statistical Offices, Ministries and Economic Research Institutes.
FREQUENCY OF TABLES
The Graphs and Notes of Group A appear m every issue and deal with:
A 1 Industrial production A 2 Unemployment A 3 Consumer prices A 4 Balance of trade
The others (Groups B, C and D) appear quarterly as follows:
January, April, July, October
B 1 Exports
B 2 T rode between member countries B 3 Bank rate and call money rates
B 4 Short-term lending to business and private customers
B 5 Gold and foreign exchange reserves
February, May, August, November
C 1 Imports C 2 Terms of trade C 3 Wholesale prices C 4 Retail sales C 5 Wages
March, June, September, December
D 1 Output in the metal products industries D 2 Dwellings authorized
D 3 Tax revenue D 4 Share prices
D 5 Long-term interest rates
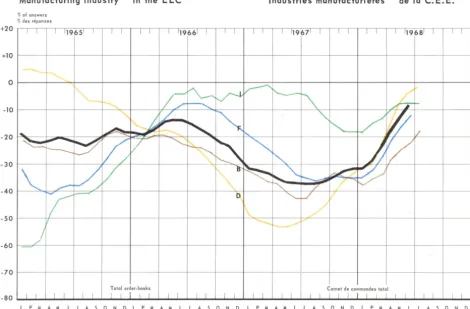
The last page contains results of the monthly business survey carried out among heads of enterprises in the Community.
REMARQUES GENERALES
Allemagne (R F) Belgique. France
COULEURS
jaune , brun • bleu I tal ie . .
Luxembourg. Pays-Bas Communaute
• vert ligne brune discontinue
rouge • no i r
SOURCES
Office statistique des Communautes europeennes, services nationaux de statistiques, ministeres et instituts d'etudes economiques.
PERIODICI TE
Les graphiques et commenta ires du groupe A,
a
sa voirA 1 Production industrielle A 2 Nombre de chomeurs A 3 Prix
a
Ia consommation A 4 Balance commercia lesont publies mensuellement. Ceux des groupes B, C et D sont trimestriels et figurent respectivement dans les numeros suivants:
Janvier, Avril, Juillet, Octobre B 1 Exportations
B 2 Echanges intracommunautaires
B 3 Taux d'escompte et de l'argent au jour le jour B 4 Credits
a
court terme aux entrepri ses et auxparticul iers
B 5 Reserves d'or et de devises
Fevrier, Mai, Aout, Novembre
C 1 Importations
C 2 T ermes de I' echange C 3 Prix de gros
C 4 Ventes au detai I C 5 Salaires
Mars, Juin, Septembre, Decembre
D 1 Production de l'industrie transformatrice des metaux
D 2 Autorisation de construire D 3 Recettes fi scales D 4 Cours des actions
D 5 T aux d' interet
a
long termeCommission of the European Communities
Directorate-General for Economic and Financial Affairs
Directorate for National Economies and Economic Trends
GRAPHS AND NOTES
ON THE ECONOMIC SITUATION
IN THE COMMUNITY
GRAPHIQUES ET NOTES RAPIDES
SUR LA CONJONCTURE
,
DANS LA COMMUNAUTE
Commission des Communauhis europeennes
Direction generale des affaires economiques et financieres
Al
INDUSTRIAL PRODUCTION
PRODUCTION INDUSTRIELLE
1958 =- 100
Unadjusted Indices bruts
200
E.E.C. C. E. E.
190
180
170
160
150
140
130
120
F M A M A 0 N
NOTES: Indices of the Statistical Office of the European Communities {excluding construction, food, beverages and tobacco). - The trend curves in the right-hand chart represent estimates which hove been estobl ished on the basis of indices prepared by the SOEC and ad jus ted for seasonal and fortuitous variations.
Industrial production in the Community continued to grow vjgorously in recent months. The rate of increase was particularly rapid in Germany. Because of an appre-ciable expansion of domestic and foreign demand order books in German industry are now considerably fuller and in some branches delivery dates are already appre-ciably longer. In France production got under way again following the strikes, and the seasonal slow-down in
July and August was relatively moderate because of the efforts being made to offset the shortfall of production. In Belgium foreign demand, particularly from neigh-bouring countries, and a slight acceleration of domestic demand provided a strong stimulus for the growth of productiOn. Added to this, both Belgium and Luxembourg continued to benefit from the favourable situation in the steel sector. In the Netherlands the expansion of indus-trial production seems to have slowed down somewhat following a period of rapid expansion early in the year, mainly owing to the new concerns in the chemicals and gas sectors which have gone into production. In Italy, where the index indicates a temporary slow-down in the rhythm of production, the late~t information suggests that in the export industries at least, the trend continues to be dynamic.
D
Trend Tendances
E.E.C. C. E. E.
190 r - - - t - - - t - - - r - - - t
....
,...
• • • • • 1966
••••
••
160 1 - - - + - - - + - - - + - - - j
150 1 - - - + - - - + - - - t - - - j
F M A M A 0 N D
R EMARQUES: Indices de !'Office stotistique des Commu-noutes europeennes{non compris Ia construction,l'olimentotion, boi sse ns et tobacs). - Les courbes de ten dance representent des estimations qui ont ete etablies sur Ia base des indices de I'O.S.C.E., corriges des variations soisonnieres et ace identell es.
L 'expansion de la production industrielle dans la
Commu-naut~ est demeur~e tres vigoureuse durant les derniers mois. Elle a ~t~ particuli~rement vive en Allemagne. Sous 1 'influence d 'une demande int~rieure et ext~rieure
en augmentation sensible, les commandes en carnet se sont fortement accrues dans 1 'industrie allemande, et les d~lais de livraison se sont d~ja allong~s notablement dans quelques secteurs. En France, la production s 'est
redress~e apr~s les gr~ves et, par suite des efforts
d~ploy~s pour rattraper les retards de production, le ralentissement saisonnier des mois de juillet et aout a ~t~ relativement mod~r~. En Belgique, 1 'expansion de la production a ~t~ stimul~e tant par la demande ~manant
de 1 ·~tranger - notamment des pays limitrophes -que par une l~g~re acc~l~ration de la demande int~rieure.
Ce pays, comme aussi le Luxembourg, a d 'ailleurs
continu~ de b~n~ficier de la conjoncture favorable de la
sid~rurgie. Aux Pays-Bas, il semble que la vive expan-sion du d~but de 1 'ann~e, qui avait r~sult~ essentiel-lement de la mise en service de nouvelles installations dans 1 'industrie chimique et le secteur du gaz, se soit
a pr~sent l~g~rement mod~r~e.
En Italie otl, du moins suivant 1 'indice, le rythme de la production s ·~taitAl
INDUSTRIAL PRODUCTION
PRODUCTION INDUSTRIELLE
1958
=
100Indices bruts
190 190 260
180 250
180 170 240
160 230
170 150 220
210
130 200
190
110 180
' ' 'v 170
140 160
220 140
Nederland
I I I I I I I
Luxembourg
210
160 200
130 I
,..
...150
190
180
120 170
160
150 110
I I
li ••
191
.,.,..
..
,
...
/\
/
..
·
'\
"'··-''""-"
..
~"' ,..;.-
\ ~, .. t' ••• ' 1! - ··.~['v'
1966\ l
\
\,{
I I I I I 'f/1 I IJ F M A M J J A s 0 N D J F M A M J J A S 0 N D
Trend Tendonces
250
I I I 119651 I I I I I I 119661 I I I I I I 119671 I I I I I I 119681 I I I
240
~
-
----
v
....-
~~y---
~--"""~
---
v-
--/
/
~ . /v
L.----
t----
(_.---~-
~__.
-~
l_..---
1-N---~-"--
---
c:::::
I,....-
~-
-
~v-r---...
1
_
---
-
_.
--~
...
-~-
'
:::::--
~
~ ~
1--
-
-
~_l_..---
~ ""F 230220
210
200
190
180
170
160
150
140
··--·
--
·-·
-
..
._.··-··- ---
l ......
..
·-·
...
...
.. .......
...
···
··-···
·-130
120
110 I I I I I I I I I I I I I I I I I I I I I I I I I I I I I I I I
A2
1400 1200
1000
800
600
400
300
200
UNEMPLOYMENT
I I I 119651 I I I I I I 119661 I I I
_I
D
/
/
_E."
NOMBRE DE CHOMEURS
I I I 119671 I I I I I I 119681 I I I
/~
..._
/ ...
....
-
--
"
-
~~
-
---
-..,..---
~---150
100
80
60
40
30
20
-l l 1 1
----...--::
-~
I I I I I I I I I I
N
/
~-
----v.
~/
~
1 j_ I I I I I I I I I I 1 I l l 1 1
J FM AM J J AS 0 N OJ FM AM J J AS 0 N D J FM AM J J AS 0 N D J FM AM J J AS 0 N D
N 0 T E S: End of month figures (thousands). The trends ore
based on series adjusted by the Statistical Office of the European Communities for seasonal and fortuitous variations.
- France: number of persons seeking employment. - Italy:
number registered as unemployed; (the curve representing the results of the ISTA T sample survey has been withdrawn for revision. - Luxembourg: negligible. - Belgium: provisional curve.
At the moment when complete freedom of movement has been achieved for workers in the Community, the trends apparent on the Community's labour markets vary quite appreciably. According to the information now available, the situation on the French labour market deteriorated further following the events of May andjune. Unemploy-ment rose sharply in the second of these two months, and this was followed by a further slight increase during the weeks that followed. Though the number of persons employed in industry declined only slightly, the total numbers of hours worked fell somewhat, as the
reduc-tions made in the working week were not completely
offset by overtime. It looks as if the decline in the
Italian unemployment figures has come to a standstill, despite the increase in the numbers employed in
indus-try; this may be mainly due to the exceptionally sharp
increase in the number of young people seeking
employ-ment. As against this, the situation on the labour markets
in the Netherlands, and even more in Germany, improved
further. Thanks to the steady growth of employment,
German unemployment figures now represent less than
1% of the labour force. Unemployment remained static
in Belgium, where the number of unfilled vacancies rose
slightly.
REMARQUES: Situation en fin de mois, en milliers.
Les courbes ont ete etablies
a
partir des series corrigees des variations soisonnieres et occidentelles par !'Office stotistiquedes Communoutes europeennes. - France: demondes d'emploi
non sotisfoites. - Ito lie: personnes inscrites aux bureaux de
placement; (Ia courbe relative aux resultats de l'enquete !STAT est temporairement supprimee, Ia methode d'ajustement preliminaire de Ia serie de base etant en cours de revision). -Luxembourg: donnee tres foible.- Belgique: courbe provisoire.
Au moment ou est instaur~e la pleine liberte de circu-lation de la main-d 'reuvre dans la Communaut~, les marches de 1 'emploi des pays membres accusent des tendances assez differenci~es. Ainsi,
a
en juger d 'apr~s les donn~es disponibles, le march~ fran~ais de 1 'emploi,apr~s les ~v~nements de mai-juin, a tout d 'abord et~
caract~ris~ par une d~t~rioration sensible. Le chomage a encore augment~ nettement, tandis que diminuait le nombre d 'offres d 'emploi non satisfaites. 1 outefois, les effectifs occup~s dans 1 'industrie ne se sont reduits que
A4
BALANCE OF TRADE
BALANCE COMMERCIALE
(in million units of account 1)) (en millions d'unites de compte 1))
+400
I I I 119651 I I I I I I 119661 I I I I I I 119671 I I I I I I 119681 I I I
I
[
_/'
~t
(
' - - -
__,.--+300
...
~
/I
\
D
/
~ ....... ..,.,
v
'
v
\
/
"v
;~v
It
,.
...-"\.
"'
~ ~r
~
I
\
~
~
~
'
-
2
~
~ b-~
~
~~
pc---~
~ / 7 "'~r--
-
~-.._
~
J
~
~
T
""
-~
~
-
-
WJ
" J
""
~
-+200
+100
0
/
~
\
v
1~
-
~\J
-100
\
~~
'---'
-200
-250 I I I I I I I 1 I l I I I I I I I I I I I I I I I I I I I I I I
J FM AM J J AS 0 N OJ FM AM J J AS 0 N D J FM AM J J AS 0 N D J FM AM J J AS 0 N D
N 0 T E S: Community: trade with non-member countries;
Cal-culated on the basis of the import and export figures adjusted
for seasonal variations by the Statistical Office of the
Euro-pean Communities; Three-month moving averages. Exports
fob, imports cif; excluding gold for monetary purposes. Curves
for recent months may be partly based on estimates. Belgium
and Luxemburg: common curve.
1) 1 unit of account= 0.888671 gm of fine gold= US $1 at the
official rate of exchange.
The surplus on the Community's balance of visible trade with non-member countries, which had already been
tending to decline in early spring, was further reduced towards the end of the second quarter. This was in part attributable to the continued upswing of economic activity in most member countries, which improved the sales possibilities available within the Community itself. In France, moreover, the strike affected exports to non-member countries more strongly than imports. Further-more, the effects of the changes introduced in the method of collating statistical data, which for a while inflated Italy's surplus, have been losing in importance. The rapid expansion of deliveries to the United States and
the United Kingdom, which in the first half of the year
was largely due to special factors, now shows signs of giving way to a quieter trend. In the months ahead this tendency will probably strengthen further as a result of the tax measures by which these two countries are endeavouring to reduce their deficits.
R EM A R Q U E S : par rapport aux pays non membres.
-Moyenne mobile sur trois mois du solde resultant des donnees
desaisonnal isees d'importation et d'exportation de !'Office
statistique des Communautes europeennes. - Exportation
f.o.b., importation c.i.f.; or monetaire exclu. - Belgique et
Luxembourg : courbe commune. - Les donnees rei atives aux
derniers mois peuvent etre basees sur des estimations.
1) 1 unite de compte= 0,888671 gramme d'or fin = 1 dollar U.S.
au taux de change officiel.
La tendance
a
la contraction qui, depuis le d~but duprintemps, caract~risait 1 'exc~dent de la balance commerciale de la Communaute
a
1 'egard des pays non membres, s 'est accentuee vers la fin du deuxi~metrimestre. Cette ~volution est, d 'une part, imputable au
d~veloppement de 1 'essor conjoncturel dans la plupart des pays membres, qui a ouvert
a 1 'industrie de la
Communaut~ de meilleures perspectives de ventes sur le march~ int~rieur. D'autre part, les gr~ves fran~aises
ont plus fortement affect~ les exportations que les
impor-tations. Enfin, la modification des m~thodes statistiques, qui avait exag~r~ 1 'importance du solde positif de la balance italienne, a eu une incidence moins grande. Du
cot~ des pays non membres, la vive expansion dont les ventes aux Etats-Unis et au Royaume-Uni avaient
t~moign~ au premier semestre, et qui ~tait due essen-tiellement
a
des facteurs exceptionnels, commence main tenanta
se moderer. Cette tendance devrait se poursuivre durant les prochains mois, etant donn~ les mesures restrictives de caract~re fiscal prises dansIMPORTS
IMPORTATIONS
from non-member countries 1958
=
100 en provenance des pays non membres280 270 260 250 240 230 220 210 200 190 180 170 160 150 140 130 I I
L'
r-,
~I
~
'\.""'-I I
I 119651 I
/ /
r-v
J
v
~
~
~
~
'I'
~
I
v
~
/
v
vI I I I
I I I I I 119661 I I I
/'\
.,.,/
A
rv
~
~
I
/
r-
,__-.1'---
l)c
~ ~... ~
~
-
-
-
~
,..,--/',ttt""' ,--r
~
~LJ
j
v~
~
\
'-../ '-/"
~
r-'
~
-...//
r---/
I I I I I I I I I I
I I I 119671 I I I I I I 119681 I I I
/\
I
A
.
/
\
I
/,/
\
I
'---
hi
\
I
")
~/
'
!
-~
,--..._
/.-...
~
~
A
~
~
~
~
~
~j-J~
--
..../
~
r
,;--/'
~
v
r -
,..---
\
\
/
\
"'I
vI
"-.)
I I 1 I I I I I I I I I I I I I
J FM AM J J AS 0 N OJ FM AM J J AS 0 N 0 J FM AM J J AS 0 N 0 J FM AM J J AS 0 N 0
N 0 T E S: Seasonally adjusted indices of value in u.a. pro-vided by theStatistical Office of the European Communities.-Three-month moving averages. - Curves for recent months may be partly based on estimate~. - Belgium and Luxem-burg: common curve.
Following some slackening at the beginning of the year, due at least in part to the disappearance of the special expansionary factors noted at the end of 1967, the Com-mWlity 's imports from non-member coWl tries have again been growing somewhat faster. From April to July their seasonally adjusted value was 2.5
%
higher than in the first three months of the year and 10% higher than in the corresponding period of 1967. In Germany, imports continued to expand briskly; the efforts to re-plenish stocks of raw materials and semi-manufactures appear to have slowed down, but in the past few months purchases of finished products have shown a more dynamic trend. In France, imports recovered rapidly in JWle, and still more in July, from the setback they had suffered during the strikes. In the Benelux countries the rise in imports from non-member countries, which had been fairly vigorous at the beginning of the year, flattened out somewhat, especially in the Netherlands where the raw materials and semi-finished goods (especA ially energy products) purchased abroad even showed an appreciable decline. In Italy, by contrast, the sharp decline in imports registered (partly for statistical reasons) in the first quarter gave way in the following months to a perceptible rise.REMARQUES : Indices de valeur en u.c., cornges des
variations soisonnieres, etablis par I'Office statistique des
Communautes europeennes.-Moyenne mobile sur trois mois. -Les donnees relatives aux derniers mois peuvent etre basees sur des estimations. - Belgique et Luxembourg : courbe
commune.
Apr~s une certaine pause enregistr~e au d~but de l'annee, par suite de la disparition des facteurs d 'expansion exceptionnels qui s ·~taient manifestes
a
la fin de l'ann~ederni~re, la croissance des importations de la Commu
-naut~ en provenance des pays non membres s 'est de nouveau l~g~rement acc~U~ree. Pour la p~riode avril -juin elles ont depass~ de 2,5% en valeur leur niveau du
premier trimestre; en comparaison annuelle, 1 'augmen -tation atteint 10
%
·
L 'expansion des importations est demeuree vive en Allemagne; si le stockage des mati~res premi~res et demi-produits paratt s ·~tre ralenti, en revanche 1 'evolution des achats de produits finis s 'estr~v~lee plus dynamique au cours des derniers mois. En
France, le mouvement de rattrapage des pertes encou -rues durant les gr~ves a ~te tres rapide en juin, et surtout en juillet. Dans les pays du Bznelux, le develop -pement assez vigoureux dont les importations en pro -venance des pays non membres avaient t~moigne au debut de 1 'ann~e s 'est quelque peu modere. Ceci est surtout le cas aux Pays-Bas, oil 1 'on a observe Wle notable reduction des achats de mati~res premi~res et de produits intermediaires, notamment de produits en
er-g~tiques. En Italie, par contre, la forte diminution des importations enregistr~e au premier trimestre, et qui avait tenu en partie
a
des facteurs de technique s tatis-tique, a fait placea
une expansion sensible au cours des mois suivants.C2
,
TERMS OF TRADE
TERMES DE L'ECHANGE
1958
=
100118
I I I 119651 I I I I I I 119661 I I I I I I 119671 I I I I I I 119681 I I I
114
D
-- "" I
r\
,
-~,.
J
/-~
... ..,..,. ,....---... ~
"'-..)
-
...---
~~
I f
~
~
""
~
(
~
i'--.
'-'
v
y
_/
~
~ ~~
N~
v
~
k-/
\
_/
~
~ V "\._V"---"'
~
_/
/~
~~
v
I
'-""'
...--~
..,..._
'
-110
106
102
98
~
~
'
·
~
I
~
~
~
I
~
v
~
~
""
I I I I I I I I I I I I I l I I I I I I I I I I I I I I
94
J FM AM J J AS 0 N OJ FM AM J J AS 0 N D J FM AM J J AS 0 N D J FM AM J J AS 0 N D
N 0 T E S: Index of average export prices in u.a. divided by
the index of average import prices in u.a. - Three-month
moving average. - Belgium and Luxembourg: common curve.
-France: foreign trade, including franc area. - F.R. of
Ger-many: new serie.
Contrary to what is usual for the period, the terms of trade improved slightly for the Community in the.. first quarter and, to judge by the very incomplete information available so far, in the subsequent months also. The main contribution came from the trend of average export values in the Netherlands and the Belgo-Luxembourg Economic Union, for while in the qther member countries these values remained at best stationary, in the Benelux countries they showed a more or less marked rise. Average import values tended slightly downwards in all Community countries, owing, it would seem, mainly to the continued easing of prices on international markets for certain important raw materials. There was, for instance, an overall decline in world prices for farm products (partly, as a result of excessive expansion ot production), with prices for seasonal foodstuffs going down appreciably, and to this should be added the con-tinued influence of the_ decline in prices for copper and semi-finished copper products. The events in Czechoslovakia have had no major impact on world market prices.
R E MARQUES: lndice de Ia valeur moyenne
a
l'exportQtion,en u.c., divise par l'indice de Ia valeur moyenne
a
!'impor-tation en u.c. - Moyenne mobile sur trois mois. - Belgique et
Luxembourg: courbe unique. - France: commerce avec
l'etranger et Ia zone franc. - R.F. d'AIIemagne: nouvelle
serie.
A l 'inverse de !'evolution saisonniere, les termes de 1 'echange de la Communaute se sont legerement ame-liores au premier trimestre. D'apres des donnees encore tres incompletes, il en aurait ete de meme les mois sui vants. Cette amelioration est principalement imputable
WHOLESALE PRICES
PRIX DE GROS
1958
=
100130 I I I 119651 I I I I I I 119661 I I I I I I 119671 I I I I I I 119681 I I I
A
r--v--
._/\
/
'
-/
~---~
/\
/
...___...
~
v
...
r-L
~
r--·1~~
_,/'"'-r----.,~
~
~
N
A_:
y
0
~
I - -'
/~
-...
I ' -
--1-=-a..
~
~
~
..._..., I -
--
...
~ ...
..___..,
~
~~
125
120
115
110
~
~'--...
D---
r--
"\
--
- --105
"-...-.
---
~
~
_...----"\~ ·
---~
100
95 I I I I I I I I I I I I I I I I I I I I I I I I I I I l I I I l
J FM AM J J AS 0 N OJ FM AM J J AS 0 N 0 J FM AM J J AS 0 N D J FM AM J J AS 0 N D
NOTES: Indices of prices in national currency. - F.R. of
Germany: price index for selected basic materials; from 1968
without purchase tax; excluding Saar. - Italy: New index as from January 1967.
In the second quarter wholesale prices in the Community were largely stable. The decline in world market prices for the main raw materials supported this tendency.
The quiet trend of wage costs in most member countries was also a factor contributing to the stability of prices for industrial products. In some countries, however, the improvement in demand and the reduction in the margin of unused capacity have of late been reflected in rising prices; in Germany, for instance, most of the increase in turnover tax on 1 July has been passed on in the form of higher prices. In France, the spate of wage increases touched off by the strike in May and June has had a considerable impact on the trend of costs, and wholesale prices for industrial products have as a result risen appreciably in the past few weeks. The stabilizing influence exerted by the wholesale prices of farm pro-ducts has in most member countries been markedly weaker in the past few months. The decline in prices for pigmeat, for instance, came to a halt in the course of the second quarter; so too did the prices of certain crop products, which had been comparatively low in the spring as a result of good harvests in the previous year.
REMARQUES: Indices des prix en monnaies nationales.-R.F. d'Allemagne: indice des prix des matieres de base; T.V.A. exclue depuis 1968; Sarre non comprise.- ltalie:
nouvel indice
a
partir de janvier 1967.Durant le deuxi~me trimestre, les prix de gros sont, en
g~n~ral, demeur~s stables dans la Communaut~. Cette tendance a ~t~ favorisee par la baisse des cours mon-diaux des principales mati~res premi~res. L ·~volution
relativement mod~r~e des salaires, dans la plupart des pays membres, y a ~galement constitu~ un facteur de
stabilit~ en ce qui concerne les prix des produits indus-triels. Toutefois, depuis peu, l 'am~lioration des ventes et un degr~ plus elev~ d 'utilisation des capacit~s se traduisent, dans quelques pays membres, par des hausses de prix. C 'est ainsi qu 'en Allemagne la majoration, au ler juillet, de la taxe sur le chiffre d'affaires a ~t~, dans une large mesure, r~percut~e sur les prix. En France, la vague d 'augmentation de salaires d~clench~e par les
gr~ves en mai et en juin a fortement influenc~ l'~volu
tion des coats, entra.Lnant ainsi, au cours des dernieres semaines, un raffermissement des prix de gros des produits industriels. Dans la plupart des pays membres, !'incidence stabilisatrice des prix de gros des produits agricoles s 'est nettement att~nu~e durant les derniers mois. Ainsi, la baisse du prix de la viande de pore s 'est
arr~t~e dans le courant du deuxi~me trimestre. 11 en est
de m~me pour les prix de quelques produits d 'origine
v~g~tale, dont le niveau a ~t~ relativement bas au prin-temps, par suite des r~sultats favorables des r~coltes
de !'an dernier.
C4
,
RETAIL SALES
VENTES AU DETAIL
1958
=
100300
I I I I I I I I I
B.R. Deutschland France
ltalia
250 300 1 - - - + - - - - + - - - - 1 - - - l
l:
500 t---- - - + - - - 1 -- -- f - - - jJ.>
,.
200 250 1---'.\+-+---+----.:oi..-L-
/:.-·
~--11967
-
.
/
..
···
.--·
'·
....
0:-
/'.··~~~.~
,.
/
... .
•••• ·1966
1966'
150 I I I I I I I I 200 ... ....~_ ... .._ ... ....,j.._ ... 300 ,-..,.--,--,---,--r--.----r--r----.--,---...,-...., 250
I I I I I I I I T
Nederland Belgique-Bel gie
250 200
.~~~
.
/_..-1967
~
I!
~~ ....· ... \~
/..
·-
·-
/::
200 150
....
~ .:~·..
···
..
~ ...·
. ...
19~~.··
150 100 I I I I I I I I
F M A M J J A s 0 N D F M A M J J A S O N D F M A M J J A S O N D
N 0 T E S: Indices of values in notional currency. -
Three-month moving overage. - F.R. of Germany and Netherlands: Total retail trade. - Other countries: sales of deportment
stores. -Curves for recent months may be portly on estimates.
In most member countries the trend of retail sales has of late reflected the more vigorous expansion that is .oc-curring in private consumption. Retail sales in Germany, for instance, have since the beginning of the second quarter again been distinctly higher than at the same periods in the two preceding years. In Belgium, too,
the expansion of private demand - to judge by the turn-over at department stores and domestic sales of motor cars - appears to have gathered further momentum.
In France, the strikes in May and june led to an appre-ciable fall in sales, but subsequently the vigorous rise
in wages led to a substantial expansion of spending on consumption, especially on consumer durables. In the Netherlands, too, retail sales continued to rise. In Italy,
the comparatively modest scale of the increase in retail sales is probably attributable to the uncertainty felt
about the economic outlook and to the caution exercised
by households because of this uncertainty.
REM A R QUE S: Indices des voleurs en monnoies notionoles. Moyenne mobile sur trois mois. - R.F. d'AIIemogne et Pays· Bas : ensemble du commerce de detoi I. - AtJtres pays : grands
mogosins. - Les donnees relatives oux derniers mois peuvent etre basees sur des estimations.
Ces derniers temps, 1 'evolution des ventes au detail a reflete, dans la plupart des pays membres, une expansion plus vive de la consommation privee. En Allemagne, elles depassent de nouveau nettement, depuis le debut du deuxi~me trimestre, leur niveau des deux derni~res
annees. En Belgique aussi,
a
en juger d 'apr~s 1 'evolution des chiffres d'affaires des grands magasins et des ventes d 'automobiles sur le marche interieur, 1 'expansion de la consommation privee semble a voir continue des'acce-lerer. Si, en France, les gr~ves des mois de mai et juin ont entraine une baisse importante des ventes, la forte hausse des salaires observee depuis lors dans ce pays y a suscite une nouvelle et notable augmentation des depenses de consommation, notamment pour les biens de consommation durables. Le developpement des ventes au detail s 'est egalement poursuivi aux Pays-Bas.
WAGES
SALAIRES
(in industry) (dans I' industrie)
1958 100
240 I I I 119651 I I I I I I 119661 I I I I I I 119671 I I I I I I 119681 I I I
230
220
~
t::=
.-1 r
...-210
~
----:;
~-"
~
...
=v/
-
~)I
-
~
..-~ I--"
~
v
---
1---~
~L.----L.----J
--
~~
...
----~
_L.----
--
~
_...----
~---
f.---
~
-
---
-/
v
----
- -8---
L.----1-""
200
190
180
170
160
150
140
130 I I I I I I I I I I I I I I I I I I I I I I I I I I I I I I I I
J FM AM J J AS 0 N OJ FM AM J J AS 0 N D J FM AM J J AS 0 N D J FM AM J J AS 0 N D
NOTES: Indices in national currency. - F.R. of Germany and Italy: overage hourly gross earnings; France: hourly wage
rates; Netherlan.ds and Belgium: agreed wages. - France and
Netherlands: excluding mining and quarrying; Italy and
Netherlands: excluding building.- The latest data based portly
on estimates.
In the second quarter there was an appreciable quick-ening of the pace at which wages were rising in certain member countries. As a result of the strikes in May and June, the upward movement was particularly marked in France. From April to July, hourly wage rates rose by some lO% and were thus almost 15 % higher than a year earlier. The statutory minimum wage in industry (SMIG) and in agriculture (SMAG) was raised to 3 francs, which means increases of 35% and 56% respectively. In Germany, too, the general level of wages went up more rapidly than before. 1he rise in agreedwages was comparatively moderate, but in the past few months there may well have been a further appreciable widening between agreed wages and actual earnings. In the other member countries the rise in wages continued at much the same pace as before. In the Netherlands the Gov-ernment has submitted to the Parliament a bill which would give both sides of industcy greater freedom in fixing wages.
R E MARQUES: lndicesr en monnoies notiono les. - R.F. d'AIIemogne et ltalie: gains moyens horoires bruts; France:
toux des soloires horoires; Pays-Bas et Belgique: soloires conventionnels. - France et Pays-Bas: industries extractives non comprises; Ito lie et Pays-Bas: construction non com-prise. - Les donnees les plus recentes constituent en partie des estimations.
Au cours du deuxi~me trimestre, le cythme de la hausse des salaires s 'est nettement acc~ll~r~ dans quelques pays membres. Le mouvement a ~t~ particuli~rement sensible en France,
a
la suite des gr~ves de mai et juin derniers : les taux des salaires horaires dans l 'industrie et le commerce y ont augment~ de lO% environ entre avril et juillet, d~passant ainsi de pr~s de 15 % le niveauenregistr~ un an plus tot. Le salaire minimum dans l 'industrie (SMIG) et dans l 'agriculture (SMAG) a ~t~ port~
a
3 francs, ce qui represente respectivement une majoration de 35 % et 56 %-En Allemagne aussi, la hausse du niveau g~n~ral des salaires s 'est acc~ler~e. Si l 'aug-mentation des salaires conventionnels y est rest~erelativement mod~r~e. il semble cependant que l 'ecart, par rapport aux gains effectifs, se soit de nouveau notablement ~largi au cours des derniers mois. Dans les autres pays membres, le rythme de la hausse des salaires ne s 'est gu~re modifie. Aux Pays-Bas, le Gouvernement a depose au Parlement un projet de loi accordant aux partenaires sociaux une plus grande
libert~ dans la fixation des salaires.
Dl
OUTPUT IN THE METAL
PRODUCTS INDUSTRIES
PRODUCTION DE L'INDUSTRIE
TRANSFORMATRICE DES MET AUX
1958 = 100230 I I I 119651 I I I I I I 119661 I I I I I I 119671 I I I I I I 119681 I T I
220
/
...
·--t - -
1
_____.,/
I ...210
/
./
200
I
/
'
'
/
~v
~
v
. / ·u
----
~
v
--
.../..
~
v
-....-...
-
!-""'"~
~
~.-
-
/
..._
r--
~~
r - - ~~
-~
...
..."""""""'
-~
I"""""""',...
1---'...
~ D__.,
....
-
-~
-190
180
170
160
150
--/
~'~
r
--
l.-/
140130 I I I I I I 1 l 1 1 I I I I I I I I I I I I I I I I I I I I I I
J FM AM J J AS 0 N OJ FM AM J J AS 0 N D J FM AM J J AS 0 N D J FM AM J J AS 0 N D
N 0 T E S: The curves represent estimated trends ; they have been established by the staff of the Commission on the basis
of indices after adjustment by the SOEC for seasonal and accidental variations.
Apart from the losses suffered by France in May and June, the output of the metal products industries in the Community continued to advance distinctly; after the summer holidays it even appears to have gathered addi-tional speed. This applies in particular to Gennany, where the satisfactory flow of orders led once again to a high degree of plant utilization in the industries concerned. In the Netherlands, too, expansion continued to be lively thanks to the drive for rationalization and the implementation by the gas production and chemical industries of large-scale investment programmes. In Belgium, the growth of production has been mainly a reflection of demand from abroad. In Italy, too, where at the beginning of the year output was virtually marking time owing to the sluggish trend of expenditure on plant and machinery, export demand provided vigorous stimuli to the growth of production. In France, the tempo of production returned to nonnal in July; the losses suffered in May and June were, however, such that for the first half of the year output dropped to about 8
%
below the level attained in the corresponding period of 1967.REM A RQ U E S : Les courbes representent des estimations de Ia tendance ; elles ont ete etablies par les services de Ia Commission sur Ia base des indices corriges des variations saisonnieres et accidentelles par !'Office statistique des Communautes europeennes.
Abstraction faite des pertes de production encourues en France pendant les mois de mai et juin, la production de 1 'industrie transfonnatrice des m~taux a continu~
d 'accuser de nets progr~s dans la Communaute; il semble meme qu 'une acc~l~ration se soit produite apr~s les les mois d ·~te. C 'est surtout le cas en Allemagne, oil 1 ·~volution favorable des entrees de commandes a pennis d 'atteindre un haut degr~ d 'utilisation des
capa-cit~s. Une vive expansion a egalement persiste aux Pays-Bas, sous 1 'influence des efforts de rationalisation et aussi de la mise en reuvre d 'importants programmes d 'investissements dans le secteur de la production de gaz nature! et dans 1 'industrie chimique. En Belgique, !'expansion de la production a surtout ete soutenue par la demande etrang~re. En Italie aussi, celle-ci a donn~
de vives impulsions
a
la production, qui avait ~t~DWELLINGS AUTHORIZED
180
160
140
120
100
70
(thousands)
I
T
1 !1965! l l lj~/
rv
v
7
I
~
II I I 119661 I
I
~
~
v
v
I .... 0
AUTORISATIONS DE CONSTRUIRE
(en milliers)
I I I I I 119671 I I I I I I 119681 I l l
.-....
,..__j
\
/
1
~
~
I
-
-
I
v
I
/
50
40 ~
_ /
1'---/
\
)
k-'\.
j
~
F
../~ ~---"~-
.... ~/. I\ , 3020
10
8
6
4
2
I (
-I
I
J
I I
r---
r--..,
I
-v
)t-'\
j~~
~
v
v
~
~~
I
'\./
I I I I I I
y
"
-v
--;-
~
'
'Y.
1\
/~
~~
"
r-v
\ I
\
~
\ I
"""'
'\1
v
v
~h
t""--...I I I I I I I I
_
V
...,
~ ~VJ
"-J
~
I
~
I
~/
~
J~
J
~
\ /
\ I \ I
\.I
v
\
v
v
"""
/ ~
"'
J
1\
IV
"rY
I
" '
I I I I I I I I I I I I I I I I
J F M A M J J A S O N D J F M A M J J A S O N D J F M A M J J A S O N D J F M A M J J A S O N D
NOTES: Number of dwellings for which permits have been
issued: excluding industrial, commercial and administrative buildings. F.R. of Germany: from 1968 West Berlin excluded.
At the beginning of the summer, building demand in the Community continued to be lively. Especially in Germany the number of building starts increased appreciably, and so did the volume of orders on hand and the volume of mortgage loans approved. In Italy, the exceptional dynamism that characterized the flow of orders may have had something to do with the new town planning law, under which-the area of land covered and the cubic content of the building· have in certain circumstances been subject to prescribed limits since the measure came into force on 1 September; but even without this special factor, demand for residential construction in this country had already been tending upwards for some time past. In the Netherlands the proposed increase in the number of subsidized dwellings to be built may perhaps be postponed as a result of the rapidly expanding demand for the private houses which can be built with the help of government grants. In the Beige-Luxembourg Eco-nomic Union, by contrast, the trend of building permits issued has been rather weak, even though in Belgium there was an appreciable increase in the construction of apartment houses. In France, where demand for residential construction failed to show any significant rise until the spring, the developments of May and june have led to an appreciable volume of speculative pur-chases on the real estate market, and so caused a distinct drop in the number of unsold dwellings.
R E MARQUES: Nambre de logements dont Ia construction a ete autorisee, a !'exclusion des botiments industriels, com-merciaux et administratifs. - R.F. d'AIIemagne: y compris Berlin-Ouest jusqu'a fin 1967.
La demande de construction est restee vive au debut de
·1 'ete. En Allemagne surtout, les autorisations de cons-truire, les commandes en carnet et 1 'octroi de prets hypothecaires ont augmente sensiblement.. Le . dyna-misme inhabituel dont les passations de commandes ont temoigne en ltalie est sans doute imputable, pour une part, a la perspective de 1 'application, au ler sep-tembre, de la loi sur 1 'urbanisme, qui limite, dans certains cas, les superficies ou cubages batissables; mais, independamment de ce facteur exceptionnel, la demande de construction de logements, depuis uncertain temps deja, accuse dans ce pays une tendance
a
1 'ac-croissement. Aux Pays-Bas, il n 'est pas exclu que 1 'expansion de la demande pour les logements benefi-ciant d 'une prime de l'Etat ne fasse renoncera
l'elar-gissement envisage du contingent de logements sociaux. Dans l'U.E.B.L., par centre, !'augmentation des autori-sations delivrees pour la construction de logements s 'est revelee assez faible, en depit d 'un developpement sensible de la construction d 'immeublesa
appartements en Belgique. En France, oil la demande de construction de logements ne s 'etait gu~re accrue jusqu 'au printemps, les evenements de mai-juin ont entratne, sur le marche immobilier, d 'importants achats speculatifs qui se sont traduits par une nette diminution du nombre de logements invendus.03
TAX REVENUE
RECETTES
FISCALES
I I 11,0
France Mrd NF
10,5 1---- - l - - - -t----l---1 1050 1 - - - j - - - - t - - - - + - - - 1
9,5 1- - - - + - - - -1- - -- + - - - 1
950 1 - - - t - - - - t - - - - + - - - 1
9,0 1---+-- - -1---+-- ---t
850 f - - - l - - - - l - -- --+-- ---1
8,5
~'---
,
..
19668,0
·~,:
1967
~
...
····
•'"7,5
7,0 ~.o..-..1 ..._
1
.._ ....
1__.,_~....__
,,_
,
..., ...
,
__.
,
...1
7,0 .._ ... _~.... ... __, 21 .1. I 1 ... 1 .1 I I I IBelg1que-Belg1e Mrd FB 2300
Nederland Mia Fl. lu~embourg Mio Flbg
2100 1 - - - + - - - - 1 - - - + - -- --t 20
700 f - - - l - - - - l - - - + - - - 1
19
18
/"'.,
I
.. i'· ...
"'--~
.
.
17
/
...~
16
.. ···
...
.
15
1100 ... 14 I I
IV Ill IV IV
N 0 T E S: Government tax revenue. - Monthly overages.
-Germany (FR): Federal and L1inder taxes. Including Soar
from July 1959.
In the second quarter most member countries registered only a modest rise in tax revenue. In Germany, revenue from this source was, it is true, higher than in the corresponding period of 1967, but the level reached was only that already attained in the second quarter of 1966. As the Federal Government's spending was at the same
time fairly low, the Federal budget closed with no more than a small cash deficit. In the Netherlands, the situ-ation was affected by delays in the payment of income tax; as expenditure was high, the cash transactions of the public authorities produced heavy deficits, and these contributed substantially to the increase in domestic liquidity. In Belgium, the statistics on tax revenue in the second quarter give a misleading picture owing to the delays which for technical reasons have occurred in the payment of taxes. In Italy, tax revenue was weak, but the budget closed with only a slight deficit because of the weakness with which expenditure grew after the vigorous expansion experienced in the preceding quarter. In France, tax revenue was no more than modest as a result of the events in May, and the cash deficit was considerable; the deficit for the full year, which in the first supplementary budget was for the full year
estimated at FF 5 500 million, will probably reach
FF 10500 million.
..
,.··
.
.
·~gp6
I I
.
-,
~
.
.
.
·.
·
..··
550 f - - - l - - - - 1 - - - + - - - !I I I I 500 __________ __._.._ ... __,
Ill IV IV Ill IV REMARQUES : Recettes fiscoles de I'Etot.- Moyennes mensuelles.- R.F. d'AIIemogne: y compris les impc5ts des «Lander».
Dans la plupart des pays membres, les recettes fiscales n 'ont augment~ que mod~r~ment au deuxi~me trimestre. Si, en Allemagne, elles se sont r~v~l~es plus impor
-tantes qu 'un an auparavant, elles n 'ont cependant pas
d~passe leur niveau du deuxi~me trimestre de 1966.
Comme, d 'autre part, les d~penses du Bund ont ~te assez
r~duites, le budget f~d~ral s 'est sold~ par un deficit de caisse limite. Aux Pays-Bas, des retards ont ~t~ enre-gistres dans le recouvrement de l'impot sur le revenu.
Les d~penses ayant et~ importantes, les op~rations de
tr~sorerie des pouvoirs publics ont laisse un d~ficit
~lev~. qui a largement contribu~
a
!'expansion desliquidit~s interieures. En Belgique, des retards
sur-venus, pour des raisons techniques, dans le paiement des impots ont alt~r~. au deuxi~me trimestre, la signi -fication des statistiques relatives aux rentr~es fiscales. En d~pit de recettes peu importantes, le budget de l'Etat
italien n 'a ete que l~g~rement dHicitaire au deuxi~me
trimestre, les d~penses n 'ayant plus augment~ que faiblement apr~s le brusque accroissement observ~ au debut de l'ann~e. En France, par suite des ~v~nements
de mai dernier, les recettes fiscales ont et~ faibles et
SHARE PRICES
COURS
DES ACTIONS
1958
=
100300
280
260
240
220
200
190
180
170
160
150
140
130
120
110
100
90
I I I 119651 I
...
'"I'--
---'"""
-
-
~
-"'
~~
~
I
'-':
~
L
~
l/'-I I I I I I
I I I I I 119661 I I I
~
-'
~
~
~
...
-
r--...
~rJ
'\.
~
/
.
~
'
"'
~
r----....
....
~
"'-...
"
I'\
~
~
r-....
...,.--
\
""""""
~
'
I I I I I I I I
~
I I I 119671 I I I I I I 119681 I I I
~
__,I
I
... ~D
-
~
--
~ ~~ ~
~
I//
K
-
/fo
~p
-~,
"\...v
A
_,
r
"'
-
v\
IA
/
/
~
I
~
v
'\.
:.-- IY" ...
..___,
u
,-v
I ' - -
L _ /
__,.
-J:
I ._ I I I I I I I I I I I I IJ FM AM J J AS 0 N OJ FM AM J J AS 0 N D J FM AM J J AS 0 N D J FM AM J J AS 0 N D
N 0 T E S: The Community's share price index is calculated
by the Statistical Office of the European Communities on the
basis of a weighted average of the national indices (Laspeyres
formula).
The stock exchanges of most member countries showed comparatively little reaction to the internal unrest
that occurred in France during May and June or to the events in Czechoslovakia. In France itself, however, the strikes and the fears about their repercussions led
to a sharp collapse in prices, and it was not until August that this gave way to a somewhat calmer attitude. In Italy, some measure of uncertainty about future developments in the business sphere was one of the factors which temporarily depressed the level of prices. Elsewhere in the Community the climate on the stock exchanges betrayed an optimistic assessment of the business situation. In Belgium, however, the upward
trend of prices was temporarily checked by the cautious attitude which the public adopted until the coalition
government was formed. The tone in the Netherlands and still more in Germany reflected the combination of heavier purchases by foreign investors and the increasing predilection for equities shown by the domestic public. In Germany, however, speculation about a change in the parity of the mark has of late had a damping effect on prices.
REMARQUES: L'indice des cours des actions de Ia
Com-munaute calcule par I'Office statistique des Communautes
europeennes, correspond
a
Ia moyenne ponderee des indicesnationaux d'apres Ia formule de Laspeyres.
La Bourse de la plupart des pays membres n 'a r~agi
qu 'assez faiblement aux tensions qui ont affect~. en mai-juin, la vie politique fran~aise, et aux ev~nements
de 1 checoslovaquie. T outefois, en France meme, les
gr~ves et les craintes qu 'elles ont suscit~es quant
a
leurs repercussions ont entrain~ une brusque chute des cours qui n'a fait place qu'au mois d'aoOt
a
une certaine accalmie. En Italie, l 'incertitude qui r~gne quanta l ·~volution ult~rieure de la conjoncture a sans doute, entre autres facteurs, contribu~ passag~rement
a
la baisse du niveau des cours. Dans les autres pays de laCommu-naut~. les cours ont accuse !'incidence d 'une appr~cia
tion optimiste de la conjoncture. En Belgique toutefois, la hausse a ete frein~e temporairement par 1 'attentisme
dont le public a t~moign~ avant la formation du
gouver-nement de coalition. Aux Pays-Bas, et plus encore en Allemagne, outre l 'intervention plus large des acheteurs nationaux, les achats accrus d 'acqu~reurs ~trangers ont
jou~ un role important. Dans le second de ces pays, cependant, les speculations sur la parite de change du mark ont, ces derniers temps, influence les cours dans le sens de la baisse.
DS
LONG-TERM INTEREST RATES
%
9
8
7
6
5
l l
lll96511I
T
A
UX D'INTERET A LONG TERME
J FM AM J J AS 0 N OJ FM AM J J AS 0 N D J FM AM J J AS 0 N 0 J FM AM J J AS 0 N 0
N 0 T E S: Yield on fixed-interest-bearing securities. - Bel-gium: government securities maturing in 5 to 20 years
(4-5 %) ; beginning of month. - France: interest rates on
fixed-interest-bearing securities in the private sector. -
Nether-lands: average yield on nine government stocks. - Germany (FR): all stock exchange securities quoted. - Italy: yield on
bonds.
Since May the situation on the bond markets of most member countries has been rather tighter. In France, the sharp rise in interest rates in May and June was attributable to the strikes which not only severely under-mined the propensity to save and increased the prefer-ence for assets in liquid form but, in particular, led to a heavier outflow of capital. Since July, however, there
have been signs that the situation in this country is
returning to normal. In the Netherlands, the volume of
loans floated by the Government and the Bank voor
Nederlandse Gemeenten in June, July and August was
almost as great as in the preceding five months. In
Italy, too, the volume of issues floated by the public
authorities was very substantial; here, however, there
was support buying by the Banca d 'Italia, and this
pre-vented too sharp a rise in interest rates. In Belgium,
the downward trend has given way to a certain tendency for rates to level off. Only in Germany did long-term rates continue to tend downwards; the volume of fixed-interest-bearing securities being issued has remained high, with an increasing number of foreign borrowers floating loans on the German capital market.
REMARQUES: Rendement des valeurs
a
revenu f i x e .-Belgique: titres de I'Etat de 5
a
20 ans (4-5%); debut de mois.-France: taux d'interet des valeurs
a
revenu fixe du secteurprive. - Pays-Bas: moyenne de 9 renfes d'Etat. - R. F.
d'AIIemagne: ensemble des valeurs cotees en Bourse.-Ita lie: taux de rendement des obligations.
Une legere tension s 'est manifestee, depuis le mois de
mai, sur le marche des obligations de la plupart des
pays membres. La forte hausse des raux d'interet
observee en France durant la peri ode mai-juin est en
relation avec les greves qui se sont produites dans ce pays. Celles-ci ont entraine non seulement un
affaiblis-sement de la propension
a
1 'epargne et une preferenceplus marquee du public pour les placements liquides,
mais aussi et surtout des sorties accrues de capitaux.
Il semble toutefois qu 'un retour progressif
a
unesitua-tion normale se soit amorce au mois de juillet. Aux
Pays-Bas, 1 'Etat et la Banque des Communes
neerlan-daises ont emis, entre juin et aoOt, presque autant
d 'emprunts que durant les cinq mois precedents. Le
montant des emissions publiques a egalement ete tres
eleve en Italie. Des achats de soutien effectues par la
Banque d 'Italie ont toutefois permis d 'eviter une hausse
plus forte des taux. En Belgique, le mouvementde baisse
a fait place
a
une certaine stabilisation. Ce n 'est qu 'enAllemagne que 1 'evolution des raux d 'interet
a
longterme est restee orientee
a
la baisse. Les emissions devaleurs