This is a repository copy of
Mathematics Achievement of Language-Minority Students
During the Elementary Years.
.
White Rose Research Online URL for this paper:
http://eprints.whiterose.ac.uk/72543/
Version: Published Version
Monograph:
Hampden-Thompson, Gillian orcid.org/0000-0002-4882-4565, Mulligan, Gail, Kinukawa, A
et al. (1 more author) (2008) Mathematics Achievement of Language-Minority Students
During the Elementary Years. Research Report. U.S. Government Printing Office ,
Washington, DC.
eprints@whiterose.ac.uk https://eprints.whiterose.ac.uk/
Reuse
Items deposited in White Rose Research Online are protected by copyright, with all rights reserved unless indicated otherwise. They may be downloaded and/or printed for private study, or other acts as permitted by national copyright laws. The publisher or other rights holders may allow further reproduction and re-use of the full text version. This is indicated by the licence information on the White Rose Research Online record for the item.
Takedown
If you consider content in White Rose Research Online to be in breach of UK law, please notify us by
December 2008
Between 1979 and 2006, the number of school-age children (ages 5–17) who spoke a language other than English at home increased from 9 to 20 percent of the population in this age range (U.S. Department of Education 2008, indicator 7). Given the growing numbers of these children (language-minorities) within the nation’s schools, it is important to understand their educational achievement. This Issue Brief uses longitudinal data to examine the scores of public-school language-minority students on a mathematics assessment in 1st grade, as well as the gain in their scores between 1st and 5th grades.1,2 Scores are reported by three background characteristics—student’s race/ethnicity, poverty status,3 and mother’s education—that have been found to be related to achievement (see Rathbun and West 2004).
Data for this brief are drawn from the Early Childhood Longitudinal Study, Kindergarten Class of 1998–99 (ECLS-K), conducted by the U.S. Department of Education’s National Center for Education Statistics. The ECLS-K uses a nationally representative sample of children who were kindergartners in the 1998–99 school year. The analysis uses data from spring 2000 (when most of the children were in 1st grade) and spring 2004 (when most of the children were in 5th grade) and is restricted to children who were first-time kindergartners in 1998–99 and who attended public school in 2000 and 2004.4
For this Issue Brief, students are categorized by language background and English language proficiency into three groups: (1) language-minority, English Proficient students, (2) language-minority, English Language Learners, and (3) students whose primary home language is English.5 The grouping of language-minority students into either English Proficient or English Language Learners is based on their score on a direct measure of oral English language proficiency in the fall of their kindergarten year.6
Characteristics of Language-Minority Students
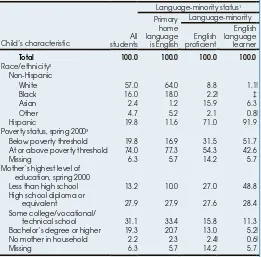
Of public school students who were first-time kindergartners in 1998–99, some 12 percent were language- minority students, equally divided between English Language Learners and those proficient in English (data not shown in tables). The remaining 88 percent were students whose primary home language was English.Most language-minority students were Hispanic (71 percent of English Proficient students and 92 percent of English Language Learners) (table 1). Asians were the second largest group, constituting 16 percent of English Proficient students and 6 percent of English Language Learners.
Approximately one-third of English Proficient students (32 percent) and one-half of English Language Learners (52 percent) lived in poverty. In contrast, 17 percent of students whose primary home language was English lived in poverty.7
Mathematics Achievement of
Language-Minority Students During the Elementary Years
U.S. Department of Education NCES 2009–036
Issue
Brief
Almost half of all English Language Learners (49 percent) had a mother with less than a high school education. Higher percentages of English Language Learners and English Proficient students had a mother with this education level, compared to students whose primary home language was English (49 and 27 percent vs. 10 percent).
Mathematics Achievement in 1st Grade
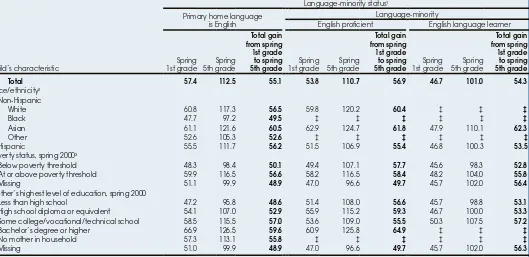
On a scale of 0 to 153, the overall mean 1st-grade (spring 2000) mathematics score for students whose primary home language was English (57 points) was higher than the score for English Proficient students (54 points) and English Language Learners (47 points) (table 2).8 Among language-minority students, those proficient in English outperformed English Language Learners by 7 points, on average. The following sections provide information about student performance by various background characteristics.
Race/ethnicity. Regardless of race/ethnicity, English Language Learners generally scored lower than English Proficient students and students whose primary home language was English. Specifically, among Asian and Hispanic students, English Language Learners had lower scores (48 and 47 points, respectively) than their English Proficient peers (63 and 52 points, respectively) and peers whose primary home language was English (61 and 56 points, respectively).
Poverty status. While English Proficient students living at or above the poverty threshold had higher 1st-grade mathematics scores than their peers living in poverty (58 vs. 49 points), no measurable difference was observed between the scores of English Language Learners by poverty level.
The pattern of performance for students living at or above the poverty threshold was similar to the overall results: English Language Learners had lower scores than English Proficient students and students whose primary home language was English (48 vs. 58 and 60 points, respectively). Among students living in poverty, English Language Learners scored 3 points lower, on average, than English Proficient students (46 vs. 49 points), but not measurably different than students whose primary home language was English (48 points).
Mother’s education. Among English Proficient students, those whose mothers had a bachelor’s degree or higher outscored students whose mothers had less than a high school education (61 vs. 51 points). A similar finding was observed for students whose primary home language was English (67 vs. 47 points). No measurable differences were found in scores by mother’s education level among English Language Learners.
NCES 2009-036
2 Issue Brief December 2008
Mathematics Gain Scores Between 1st and 5th
Grades
Despite a 10-point spread in 1st-grade scores, no measurable differences were found among the three language groups in the total number of points that students gained in their mathematics score between 1st and 5th grades. Gain scores ranged from 54 to 57 points. Differences were found within and between the language groups, however, when students’ background characteristics were examined.
Race/ethnicity. In general, Asian language-minority students had larger gain scores than their Hispanic peers. For example, English Proficient Asians (62 points) made greater gains than English Proficient Hispanics (55 points). In addition, among English Language Learners, Asians made greater gains than Hispanics (62 vs. 54 points, respectively).
For both Asian and Hispanic students, no measurable differences were found among language groups. Gain scores for Asian students ranged from 61 points for students whose primary home language was English to 62 points each for
English Proficient students and English Language Learners. Hispanic students’ gain scores ranged from 54 points for English Language Learners to 56 points for students whose primary home language was English.
Poverty status. Among students living in poverty, those proficient in English made greater gains than English Language Learners or students whose primary home language was English (58 vs. 53 and 50 points).
Mother’s education. Among students whose primary home language was English and English Proficient students, those whose mothers had a bachelor’s degree or higher made greater gains than their peers whose mothers had less than a high school education.
Among students whose mothers had less than a high school education, English Proficient students and English Language Learners had greater mathematics gains than their peers whose primary home language was English (57 and 53 vs. 49 points, respectively). Among students whose mothers had a high school diploma, English Proficient students made greater gains than English Language Learners and students whose primary home language was English (59 vs. 53 and 53 points, respectively).
Summary
Of first-time public school kindergarten students in 1998–99, some 12 percent were language-minority students, with an almost even split between English Proficient students and English Language Learners. The majority of language-minority students were Hispanic. Approximately half of all English Language Learners lived in poverty and had a mother with less than a high school education.
Overall, language-minority students scored lower on a 1st-grade mathematics assessment than did students whose primary home language was English. English Language Learners generally scored lower than English Proficient students and students whose primary home language was English. This was true for students overall, for Asian and Hispanic students, as well as for students who lived at or above the poverty threshold.
Between 1st and 5th grades, there was no measurable difference in gain scores on the mathematics assessment among the three language groups. However, differences within and between the language groups were found by student background characteristics. For example, Asian language-minority students made greater gains than their Hispanic peers. Among students living in poverty and students whose mothers had a high school diploma, English Proficient students made greater gains than English Language Learners and students whose primary home language was English. Finally, among students whose mothers had less than a high school education, language-minority students had larger gain scores than students whose primary home language was English.
References
Rathbun, A., and West, J. (2004). From Kindergarten Through Third Grade: Children’s Beginning School Experiences (NCES 2004-007). National Center for Education Statistics, Institute of Education Sciences, U.S. Department of Education. Washington, DC. Retrieved October 3, 2007, from http://nces.ed.gov/pubsearch/pubsinfo. asp?pubid=2004007.
Rock, D.A., and Pollack, J.M. (2002). Early Childhood Longitudinal Study-Kindergarten Class of 1998–99 (ECLS-K), Psychometric Report for Kindergarten Through First Grade (NCES 2002-05). U.S. Department of Education. Washington, DC: National Center for Education Statistics Working Paper.
Table 1. Percentage distribution of first-time public school kindergartners in 1998–99, by language-minority status and selected characteristics: Spring 2000
Child’s characteristic
All students
Language-minority status1
Primary home language is English Language-minority English proficient English language learner
Total 100.0 100.0 100.0 100.0
Race/ethnicity2
Non-Hispanic
White 57.0 64.0 8.8 1.1!
Black 16.0 18.0 2.2! ‡
Asian 2.4 1.2 15.9 6.3
Other 4.7 5.2 2.1 0.8!
Hispanic 19.8 11.6 71.0 91.9
Poverty status, spring 20003
Below poverty threshold 19.8 16.9 31.5 51.7 At or above poverty threshold 74.0 77.3 54.3 42.6 Missing 6.3 5.7 14.2 5.7 Mother’s highest level of
education, spring 2000
Less than high school 13.2 10.0 27.0 48.8 High school diploma or
equivalent 27.9 27.9 27.6 28.4 Some college/vocational/
technical school 31.1 33.4 15.8 11.3 Bachelor’s degree or higher 19.3 20.7 13.0 5.2!
No mother in household 2.2 2.3 2.4! 0.6!
Missing 6.3 5.7 14.2 5.7
! Interpret data with caution. Standard error is more than 30 percent of estimate’s value. ‡ Reporting standards not met (too few cases).
1 Language-minority status was determined by parent’s report of primary language at
home and Oral Language Development Scale (OLDS) results in 1998–99. Language-minority children were classified as English proficient or English language learners based on their score on the OLDS. The OLDS is an English language proficiency screener that measured children’s listening comprehension, vocabulary, and ability to understand and produce language. The range of possible scores was 0 to 60, and children who received scores higher than 36 were considered English proficient.
2 All race categories exclude Hispanic origin. “Other” includes Native Hawaiian, Pacific Islander,
American Indian (including Alaska Native), and those reporting more than one race.
3 The federal poverty level status composite variable is derived from household income and
the total number of household members. Federal poverty thresholds are used to define households below the poverty level. Students living in households where the income fell below the appropriate threshold (based on Census information from 1999) were classified as living “below” the poverty threshold.
[image:3.612.37.298.69.326.2]3
Issue Brief December 2008
NCES 2009-036
The Issue Brief series presents information on education topics of current interest. All estimates shown are based on samples and are subject to sampling variability. All differences discussed are statistically significant at the .05 level as measured by two-tailed t tests; this means a difference is discussed only if the probability that it is due to chance (i.e., sampling variability) is less than 1 in 20. No adjustments were made for multiple comparisons. In the design, conduct, and data processing of National Center for Education Statistics (NCES) surveys, efforts are made to minimize the effects of nonsampling errors, such as item nonresponse, measurement error, data processing error, or other systematic error. For more information on the Early Childhood Longitudinal Study, Kindergarten Class of 1998–99 (ECLS-K), visit http://nces.ed.gov/ecls.
This Issue Brief was prepared by Gillian Hampden-Thompson (American Institutes for Research) of the Education Statistics Services Institute (ESSI), Gail Mulligan (NCES), Akemi Kinukawa and Tamara Halle (Child Trends). For further information, contact Lisa Hudson, NCES, at 202-502-7358 or lisa.hudson@ed.gov. To order additional copies of this Issue Brief or other NCES publications, call 1-877-4ED-PUBS or visit http://www.edpubs.org. NCES publications are also available on the Internet at http://nces.ed.gov.
U.S. Department of Education, National Center for Education Statistics. (2008). The Condition of Education 2008 (NCES 2008-031). Washington, DC: U.S. Government Printing Office.
Endnotes
1 The mathematics assessment was one of the direct cognitive tests specifically
designed for the ECLS-K to measure a child’s knowledge at a given point in time, as well as that child’s academic growth since kindergarten entry. In order to measure academic growth, overlapping items were included in at least two rounds of data collection.
2 Mathematics achievement was chosen as the focus of this analysis because
the mathematics assessment was conducted in both English and Spanish in first grade, while the reading assessment was conducted only in English. Therefore, the analytic sample from the mathematics assessment was more inclusive of the language-minority population.
3 The poverty status variable is derived from household income and the total
number of household members. Federal poverty thresholds are used to define households below the poverty level. Students living in households where the income fell below the appropriate threshold (based on Census information from 1999, see http://www.census.gov/hhes/www/poverty/threshld/thresh99 .html) were classified as living in poverty.
4 The final analytic sample includes 7,130 students.
5 Language-minority students are defined as those who speak a language other
than English at home as reported by the parent. The language-minority categories are based on the student’s status upon kindergarten entry.
6 Language-minority children were classified as English Proficient or English
Language Learners based on their score on the Oral Language Development Scale (OLDS). The OLDS is an English language proficiency screener that measured children’s listening comprehension, vocabulary, and ability to understand and produce language. The range of possible scores was 0 to 60, and children who received scores higher than 36 were considered English proficient and received the full English direct assessment. If a child scored 36 or below on the language screener but spoke Spanish, he or she was administered a Spanish form of the mathematics assessment. Analyses indicate that the English and Spanish mathematics assessments function in a similar manner (Rock and Pollack 2002). In other words, there was no advantage or disadvantage to taking the assessment in Spanish.
7 Based on household poverty status in spring 2000 (when most students
were in 1st grade).
8 The original ECLS-K 1st grade overall mathematics scale score had a
potential score range of 0 to 64. However, the score was reestimated to have the potential score range of 0 to 153, the same score range as the 5th grade scale score, allowing comparisons between the two grades.
Table 2. Mean mathematics scale scores at 1st and 5th grade and achievement gains for first-time public school kindergartners in 1998–99, by language-minority status and selected characteristics: Spring 2000 and spring 2004
Child’s characteristic
Language-minority status1
Primary home language is English
Language-minority
English proficient English language learner
Spring 1st grade Spring 5th grade Total gain from spring 1st grade to spring 5th grade Spring 1st grade Spring 5th grade Total gain from spring 1st grade to spring 5th grade Spring 1st grade Spring 5th grade Total gain from spring 1st grade to spring 5th grade
Total 57.4 112.5 55.1 53.8 110.7 56.9 46.7 101.0 54.3
Race/ethnicity2
Non-Hispanic
White 60.8 117.3 56.5 59.8 120.2 60.4 ‡ ‡ ‡
Black 47.7 97.2 49.5 ‡ ‡ ‡ ‡ ‡ ‡
Asian 61.1 121.6 60.5 62.9 124.7 61.8 47.9 110.1 62.3
Other 52.6 105.3 52.6 ‡ ‡ ‡ ‡ ‡ ‡
Hispanic 55.5 111.7 56.2 51.5 106.9 55.4 46.8 100.3 53.5
Poverty status, spring 20003
Below poverty threshold 48.3 98.4 50.1 49.4 107.1 57.7 45.6 98.3 52.8
At or above poverty threshold 59.9 116.5 56.6 58.2 116.5 58.4 48.2 104.0 55.8
Missing 51.1 99.9 48.9 47.0 96.6 49.7 45.7 102.0 56.4
Mother’s highest level of education, spring 2000
Less than high school 47.2 95.8 48.6 51.4 108.0 56.6 45.7 98.8 53.1
High school diploma or equivalent 54.1 107.0 52.9 55.9 115.2 59.3 46.7 100.0 53.3
Some college/vocational/technical school 58.5 115.5 57.0 53.6 109.0 55.5 50.3 107.5 57.2
Bachelor’s degree or higher 66.9 126.5 59.6 60.9 125.8 64.9 ‡ ‡ ‡
No mother in household 57.3 113.1 55.8 ‡ ‡ ‡ ‡ ‡ ‡
Missing 51.0 99.9 48.9 47.0 96.6 49.7 45.7 102.0 56.3
‡ Reporting standards not met (too few cases).
1 Language-minority status was determined by parent’s report of primary language at home and Oral Language Development Scale (OLDS) results in 1998–99. Language-minority children
were classified as English proficient or English language learners based on their score on the OLDS. The OLDS is an English language proficiency screener that measured
children’s listening comprehension, vocabulary, and ability to understand and produce language. The range of possible scores was 0 to 60, and children who received scores higher than 36 were considered English proficient.
2 All race categories exclude Hispanic origin. “Other” includes Native Hawaiian, Pacific Islander, American Indian (including Alaska Native), and those reporting more than one race.
3 The federal poverty level status composite variable is derived from household income and the total number of household members. Federal poverty thresholds are used to define households
below the poverty level. Students living in households where the income fell below the appropriate threshold (based on Census information from 1999) were classified as living “below” the poverty threshold.
NOTE: The sample is limited to children in kindergarten for the first time in 1998–99 who attended public schools in the spring of 1st grade and 5th grades. The original ECLS-K 1st grade overall mathematics scale score had a potential score range of 0 to 64. However, the score was reestimated to have the potential score range of 0 to 153, the same score range as the 5th grade scale score, allowing comparisons between the two grades. Detail may not sum to totals because of rounding. Estimates were weighted by C456CW0. Standard errors are available at http://nces.ed.gov/pubsearch/pubsinfo.asp?pubid=2009036.
[image:4.612.48.577.60.317.2]Mathematics Achievement of Language-
Minority Students During the Elementary Years
U.S. Department of Educa
tion
ED Pubs 8242-B Sandy Court
Jessup, MD 20794-1398
NCES 2009–036
The Issue Brief series presents information on education topics of current interest.