A STUDY OF THE EVOLUTION
OF CONCENTRATION
IN THE FOOD INDUSTRY
IV/ A-3
I V/70/75- E
""'
()./· ~
---
A STUDY OF THE EVOLUTION
OF CONCENTRATION
IN THE FOOD INDUSTRY
,
The present volume is part of a series of sectoral studies on the
evolution of concentration in the member states of the European
Community.
These reports were compiled by the different national Institutes and
experts, engaged b,y the Commission to effect the study programme in
question.
Regarding the specific and general interest of these reports and the
responsibility taken by the Commission with regard to the European
Parliament, they are published wholly in the original version.
The Commission refrains from commenting, only stating that the
responsibility for the data and opinions appearing in the reports,
rests solely with the Institute or the expert who is the author.
Other reports on the sectoral programme will be published by the
Commission as soon as they are received.
The Commission will also publish a series of documents and tables of
syntheses, allowing for international comparisons on the evolution of
PROCESSING INDUSTRY
Part
1:INDUSTRY STRUCTURE
& CO NCE NTRA T
10 N,1969-72
A Report prepared for the
Directorate General for Competition
of the
COMMISSION OF THE EUROPEAN COMMUNITIES
by
DEVELOPMENT A 1\JAL YSTS LIMITED
January
1975Analysts Ltd., under the direction of R.W. Evely,
B .Sc. (Econ), in consultation with Professor
P.E. Hart, B.Sc. (Econ), of the University of
Reading, and Professor S. J. Prais, M.Com.,
Ph.D., Sc.D (Cantab) of the City University,
London and the National Institute of Economic and
Social Research. Thanks are also due to the staff
of Development Analysts Ltd., more particularly
to Mrs. J~A. Carter, B.Sc. (Econ), and Miss
B.A. Playll, B.A., who contributed greatly to
1 :
2:
Introduction
Trends in the Food Processing Industry
3: The Structure of the Food
4:
5:
6:
Processing Industry
The Leading Food Processing Firms
Measures of Concentration
Summary and Conclusion
Appendices:
A: Concentration Indices
B: The relationship between the
Linda Index and the parameters of the lognormal distribution
C: The sensitivity of the Concen-tration Measures to Accounting data relating to non-food activities
D: Changes in Rank Order of the
Largest Enterprises, 1969 and 1972
Pages
2 -
5
6 - 21
22 -
5960 - 100
101 - 131
132 - 137
138 - 179
180 - 184
185 - 189
1 . 1: This Report forms part of a two-stage Study
of Concentration in the U.K. Food Processing Industry, commissioned
by the Directorate-General for Competition of the Commission of
the European Communities. The two stages are:
(1) a study of concentration at the
industry scale, and changes in
concentration since 1969;
(2) a series of studies of the structure
and level of concentration in
specified industries and
product-markets, namely:
Food canning
Manufactured milk products Sugar
Margarine Grain Milling Ice Cream
Frozen and Dehydrated Foods Baby Foods
Biscuits
1 .2: The food processing industries have shown an
exceptionally rapid rate of real growth in the last two decades as
a result of changes in both demand and supply factors. On the
demand side, the rise in consumers' real incomes (by two-thirds
between 1952 and 1972) has meant that the housewife has been
enabled to buy from others certain services that she previously
was obi iged to supply herself. Cakes and biscuits, for example,
and only rarely baked at home, and more generally, depending
on the item and on the technical possibilities, even if the final
cooking stages are carried out at home, washing and other
pre-cooking stages have been moved to the factory wherever possible.
The housewife has been prepared to pay for the saving in her
labour that is involved, using the time saved either in leisure
and in activities which raise the standard of living of the
house-hold, or to go out to work and to improve the household's income
in that way.
1 .3: On the supply side the main technical
changes have been the development of frozen foods and the
improvement of pasteurization processes, both of which have
meant that storage for longer periods has become possible. Thus,
it became increasingly practicable to centralise food processing
operation in factories, to manufacture for stock, and deliver to
more distant places. The scale of food manufacturing plants
increased over time and their costs per unit of production fell
progressively. The far-reaching transformation of household habits
to accommodate the ensuing changes in relative costs was
accelerated in this period by the now familiar new marketing
techniques, particularly television advertising: in Britain
11
commercial11
television, permitting advertisements, was
intro-duced in 1954 and became an established part of the marketing
process by the end of that decade.
1 .4: These factors have combined to make not
only for large manufacturing plants engaged in food processing,
but also for giant multi-plant enterprises which have the financial
resources necessary to launch 11new products11 on a massive scale.
recently thought to be the inevitable preserve of the housewife
in her home have, within a few decades, so increased in scale
that they have become the field of activity for multi-national
corporations.
1 .5: The scale of these activities has been such
that in some food trades, and particularly for certain products,
high levels of concentration have ensued. For example, in
1968 five firms accounted for more than 90 per cent. of the
sales of the following products:
sugar
condensed milk self-raising flour breakfast cereals,
soups, coffee, ice cream, quick frozen fish
and vegetables.
These general factors must be borne in mind when considering
the assessment of the changes in concentration that have occurred
in the relatively short time-span of the 1969-72 period with which
this report is mainly concerned.
1 .6: This study initially considers the
longer-term trends in the food processing industry as far as consumer
spending, changes in output, employment and investment, imports
and exports and advertising are concerned. These aspects are
dealt with below in Chapter 2.
1 .7: In the following Chapter 3, the changes in
the structure of the food processing trades as derived from Census
of Production data are examined, as well as changes in
of sales) between 1963 and 1968. The scale of merger activity
among food processing companies and the relative importance of
foreign-owned concerns are also covered in Chapter 3.
1 .8: In Chapter 4 the leading food processing
companies are identified, and their rates of growth and scale of
acquisitions are presented as well as their spread of interests
both throughout food processing and forward into retailing. More
detailed histories of 22 concerns are also given in Chapter 4.
1 • 9: Quantitativ~ measures of the changes in
concentration among the largest food processing concerns at the
industry level between 1969 and 1972 are presented in Chapter
2. 1: For the most part, the source of statistical
data relating to food manufacturing is the Census of Production,
from which it is possible to extract the trades which most nearly
correspond to processed food products. The other major sources
relating to consumption are the National Income and Expenditure
statistics and the National Food Survey, and to imports and
exports, the Overseas Trade Statistics.
2.2: The scope of the food processing industry
from the Census of Production data has been taken as the whole
of Food, Drink and Tobaccc (SIC Order
r·rl),
with the exceptionof animal and poultry foods (Industry code 219), Brewing and
malting (231), Soft drinks (232), Spirit distilling and compounding
(239.1), British wines, cider and perry (239.2), and Tobacco
(240), although for some indicators, it has been necessary to vary
this definition. The National Income and Expenditure data on
household and total expenditure on food includes fresh produce
as well as manufactured products, but the National Food Survey
provides a basis for making this distinction, as well as between
broad co tegor i es of processed foods •
Long term trends in consumer demand
2.3: While total spending on food in the United
Kingdom rose from under £5,400 millions in 1963 to £9,800
millions in 1973, the volume of spending has increased only
slightly. Between 1963 and 1968, as can be seen from Table
2,1, the increase was only 4.7 per cent., and while spending
rose comparatively fast in the next two years, it fell away again
TABLE
2.1
UK Household, Catering and Total Expenditure on Food,
1963, 1968-73
At current prices (£ Mns):
1963
1968
1973
Volume-index
(1963
==100)
1968
1969
1970
1971
1972
1973
Household expenditure
4,689
5,655
8,460
104.4
104.5
106.2
106.1
105.4
106.3
Catering expenditure
709
869
1,340
106.8
109.0
111 . 8
109.9
107.8
108.6
Source: National Income & Expenditure,
1963-73
£.mns. Current
12POO Prices.
8,000
C>
4,UOO <J
C>
<J I>
<J
C>
<J
C>
<J
0 I>
1963
~Household
L.d
Expenditure.0
CateringExpenditure
1968 1973
Volume
Index. (1963=100)
112
108
I
I
104
I
/
I
/I /
1 /
/
100
1963 '68 '69 '70
Total expenditure
'71
5,398
6,524
9,800
104.7
105.1
106.9
106.6
105.7
106.6
[image:12.585.39.515.483.735.2]fa lis to 2 per cent. in the ten years.
2.4: Even so, the tendency has been for household
spending on food to increase more slowly than food expenditure
by caterers. Thus, from Table 2.1 it will be seen that the latter
rose in real terms by nearly 12 per cent. between 1963 and 1970
as compared with I ittle more than 6 per cent. for household
spending, although by 1973 it had fallen again to 8.6 per cent.
more than in 1963.
2.5: At the same time, there have been significant
changes in the pattern of household spending on food, with the
volume of spending on convenience foods increasing much faster
than the total. In Table 2.2 is shown the 1963-72 changes in
the per capita volume of household spending in Great Britain on
all foods and convenience foods, based on the National Food
Survey data. Between 1963 and 1968, when the increase for all
foods was under 2 per cent., the rise for convenience foods was
nearer 16 per cent., and in the next two years, spending per
head on convenience foods increased by over 5 percentage-points
as compared with a 1 percentage-point rise for all foods.
Further-more, while spending per head on convenience foods fell between
1970 and 1972, the decline was much less than occurred for all
foods.
2. 6: Within the convenience foods category, the
1963-72 period as a whole has witnessed a dramatic growth in
the volume of spending on quick-frozen foods. By 1968, it was
TABLE 2.2
Volume of Household Spending per head (GB), by Types of Food
1963, 1968-72 Index: 1963
=
1001968 1969 1970 1971 1972
Convenience Foods.
1972 Household
£ mns. Spending (G.B.)
l,ooo-800
.
600·
.
400·
.
200·
-Quick Frozen r
-Canned
.----Source:
Other ,___
All
foods
101 . 9 102.4 103.0 102.0 1oo·.2
Based on
220
200
180
160
140
12
Convenience foods: Convenience
foods
Quick
Canned 0 ther
frozen
115.7 110.3
118.7 112.3
121 .0 115.8
115.5 105.4
120.5 110.8
National Food Survey
lndex.(1963= 100)
I
I
I
I
I
151 .4 175.0 182.5 187.1 219.0
'68 '69 '70 '71 '72
[image:14.590.34.505.355.707.2]sumption of canned and other types of convenience foods was
little more in 1972 than it was in 1968.
2. 7: Convenience foods, as defined by the
National Food Survey, accounted for under one-quarter of total
household spending on food in 1972, and quick-frozen foods
alone for I ittle more than 2 per cent. as compared with nearly
9 per cent. for canned goods and 13 per cent. for other types
of convenience foods. There is, however, a wide range of
processed food products - such as dairy products, fats, sugar
and preserves, bread and cereal products - which are not classified
as convenience foods. Bringing such products into account under
the description of manufactured foods, the l\lational Food Survey
data suggest that they accounted for about 58 per cent. of toto I
household food spending in 1972.
2. 8: Apart from population- increases, therefore,
growth in the output of the food industry has "derived basically
from changes in the type of food eaten, and in particular in
the amount of pre-purchase processing undergone by that food.
A switch from the consumption of cod to that of an equal
quantity of fish fingers or packaged, frozen cod steaks will lead
to an increase both in the value of consumption and in the output
of the food industry. Similarly, a switch from a slightly processed
product, such as bacon, to that of a more highly processed variant,
such as vacuum-packed bacon, represents an increase in the value
of consumption and in the value-added by the industry, and
there-fore an increase in output."*
* Food Manufacturing EDC: Economic Assessment to 1972,
TABLE 2.3
UK Food Processing rndustries: Gross Output and Net Output
Gross output Net output
Index Index
£ Mns.
(1968 = 100} £ Mns (1968 = 100}
1963
1968
1970 1971
1972 (Provisional)
TABLE 2.4
2,498 (66) 744
3,787 100 1, 083
4,660 123 1,396
4,997 132 1,564
5,526 146 1,817
Source: Censuses of Production 1963, 1968, 1970-72
UK Food Processing Industries: Employment and Wages & Salaries
1963
1968
1970 1971 1972
(Provis iona I)
Employment
Index
Wages
&
Salaries of netThousands
546.2
583.8
583.9 591.9 584.4
Source:
Index (1968= 1 00}
(94)
100
100 101 100
£Mns Index output
336.2
497.1
612.7 695.6 768.6
(1968= 1 00) per
person
(68} (73)
100 100
123 129
140 142
155 168
Censuses of Production 1963, 1968, 1970-72
(69)
100
129 144 168
Wages &
Salaries as percent.
of net output
%
45.2
45.9
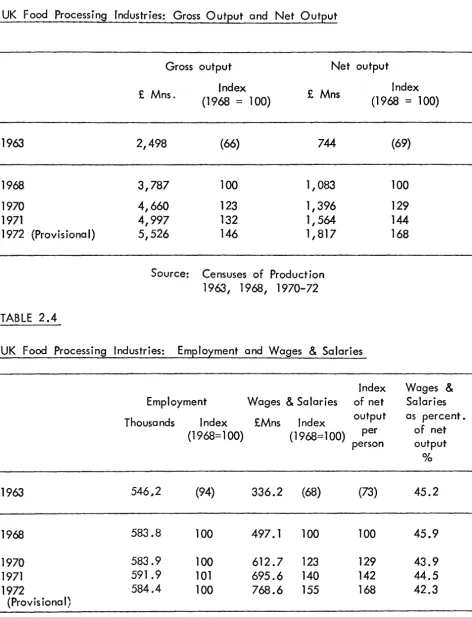
[image:16.592.56.528.115.732.2]2. 9: The changes in the gross and net output of
the food processing industry (as defined in para. 2.2 above) since
1968 are shown in Table 2.3, together with the 1963 data (as
given in the Census for that year) which are not directly
com-parable with 1968 mainly because of changes in the definition
of some of the constituent trades. Since 1968, the gross output
of the food processing industry has increased by 32 per cent. up
to 1971 and by 46 per cent. (provisionally) up to 1972. Net
output has, however, risen more than gross output during both
these periods: by
44
per cent. up to 1971 and 68 per cent. upto 1972.
2. 10: During the same period, employment in food
processing has remained virtually unchanged at around 580-590,000
with the result that net output per person employed has risen to
the same degree as net output itself. The industry's wage and
salaries bill, as can be seen from Table 2.4, has risen less than
net output since 1968, with a consequent fall in its proportion
of net output from nearly 46 per cent. in 1968 to under 42! per
cent. (provisionally) in 1972.
2.
11: The index of net output shown in Table 2.3does not allow for price-increases, but the index of production
for the food industry (which includes, however, animal and
poultry foods) shows an increase in real terms of 2! per cent.
between 1968 and 1971, followed by a further increase of nearly
4 per cent. in 1972 and 2 per cent. in 1973. Thus, for the
1968-73 period, assuming that employment has not changed
sign-ificantly during 1973, output per head has been increasing at
TABLE 2.5
UK Food Processing Industries: Net Capital Expenditure
£
Mill ionsLand and
Total net Plant
&
capital New existing Machinery Vehicles
1963
1968
1970 1971
1972 (Provisional)
TABLE 2.6
building buildings
expenditure
(net) (net)
79.8
119. 1
131
.4
122.5 151 • 1
20.2
26.4
25.8 22.0 29.2
- 0.1
- 1.6
- 2.2 - 1. 9 - 5.1
49.8
78.5
91
.2
85.4 107.1
Source: Censuses of Production
1963, 1968, 1970-72
(net)
9.9
15.8
16.6 17.0 19.9
UK Food Processing Industries as proportion of All Manufacturing Industries
1963
1968
1970 1971
1972 (Provisional)
Percent.
Gross Net
Output Output Employment
9.0 6.9 6.9
9.8 7.1 7.5
9.8 7.5 7.3
9.9 7.8 7.5
10.0 8.1 7.6
Source: Censuses of Production 1963, 1968, 1970-72
Net Capital Expenditure
7.8
7.8
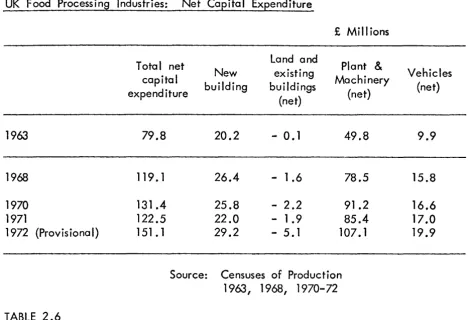
[image:18.589.58.527.122.442.2]2.12: The total net capital expenditure of the food
processing industry increased from £119.1 millions in 1968 to
£131.4 millions in 1970, but fell to £122.5 millions in 1971 and
is provisionally put at £151.1 millions in 1972. As can be seen
from Table 2.5, net investment in plant and machinery accounts
for the larger part of the total net expenditure, the proportion
increasing from 66 per cent. in 1968 to nearly 71 per cent. in
1973. New building work, on the other hand, represented a
sma II er proportion of the toto I in 1973 (19 per cent.) than in
1968 (22 per cent.), with comparative little change in the share
of net expenditure on vehicles.
Relative importance of food processing industry
2.13: Food processing, as can be seen from Table
2 .6, has slightly increased its share of the total gross output of
a II UK manufacturing industry between 1968 and 1972, and in
terms of net output, more significantly from 7.1 per cent. in
1968 to 8.1 per cent. in 1972. Its share of UK manufacturing
employment has remained virtually unchanged at around 7! per
cent., while its contribution to net capita I expenditure has
tended to fall.
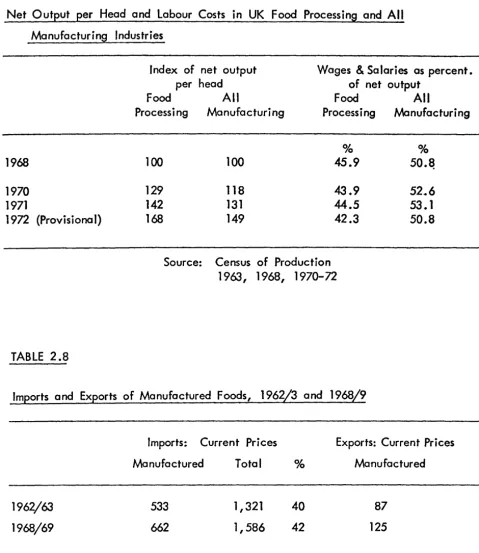
2.14: Net output per head has risen considerably
more between 1968 and 1972 in food processing than in
manu-facturing industry generally. As Table 2.7 shows, net output
per head in food processing rose by nearly 30 per cent. between
1968 and 1970 as compared with 18 per cent. in all manufacturing,
and by 68 per cent. for the four-year period to 1972 as against
TABLE 2.7
Net Output per Head and labour Costs in UK Food Processing and All
Manufacturing Industries
1968
1970
1971
1972
(Provisiona I)TABLE 2.8
Index of net output per head
Food
All
Processing Manufacturing
100
100
129
118
142
131
168
149
Wages & Salaries as percent.
of net output
Food All
Processing Manufacturing
% %
45.9
50.~43.9
52.6
44.5
53.1
42.3
50.8
Source: Census of Production
1963, 1968, 197Q-72
Imports and Exports of Manufactured Foods,
1962/3
and1968/9
1962/63
1968/69
Imports: Current Prices
Manufactured
533
662
Total
11321
1,586
%
40
42
Exports: Current Prices
Manufactured
87
125
Source: Food Manufacturing EDC,
[image:20.597.54.533.106.659.2]facturing, and whereas that proportion has tended to fall in food
processing, for all manufacturing industry it was the same in 1972
as it was in 1968 after increasing in 1970 and 1971.
Imports and Exports of Manufactured Foods
2.16: The share of UK food imports represented by
manufactured foods rose from 40 per cent. in 1962/63 to 42 per
cent. in 1968/69, which was a continuation of a trend evident
from the mid-1950's. At constant prices, imports of manufactured
foods rose by 6 per cent. during the same period, whereas raw
food imports increased by less than 1 per cent. According to the
Food Manufacturing EDC, imports of manufactured foods from the
mid-1950's to 1968/69 rose at a faster rate than the total UK
consumption of manufactured foods, thereby taking a larger share
of British markets. (see Table 2. 8).
2. 17: Exports of manufactured foods rose between
1962/63 and 1968/69 from £87 millions to £125 millions, or by
44 per cent. at current prices. In volume terms, the increase
was 27~ per cent. during the same period, with exports consisting
mainly of the "more sophisticated foods, with a high value-added
content e.g. biscuits, chocolate and sugar confectionery etc. 11
In 1968/69, the value of UK exports of processed foods was,
therefore, equivalent to roughly one-fifth of processed food
imports, as well as representing about 3 per cent. of the total
UK product ion of manufactured foods.
2.18: It is unfortunate that the breakdown of food
been pub I ished for later years. According to the British Food
Export Council, exports of processed foods have risen from
£113 millions in 1969 to £238 millions in 1973, or by 110 per
cent. Total imports of food in 1973 amounted to £2,714 millions,
of which it is estimated processed food imports amounted to over
£1,000 millions. Un this basis, processed food imports
repre-sented a lower proportion of all food imports in 1973 than in
1968/69, while processed food exports were equivalent to
between 20 and 25 per cent. of processed food imports.
Advertising and Market Research
2.19: The 1968 Census of Production provides
information collected on a sample basis of expenditure on
advertising and market research for eight groups of products
within the food census trades. The data are given in Table
2.9, from which it will be seen that for the most well-defined
product groups, advertising expenses were highest in 1968 for
groin milling, animal and poultry foods, followed by cocoa,
chocolate and sugar confectionery, and fruit and vegetable
products. The product-groups showing the largest relative
increases in expenditure on advertising and market research
combined between 1963 and 1968 ore (excluding vegetable
oils and fats) the miscellaneous group (56 per cent.), groin
milling and animal and poultry foods (54 per cent.) and fruit
and vegetable products (51 per cent.), the remaining
product-groups registering increases of 25-30 per cent.
2.20: Another and more comprehensive source
of advertising expenditure is the MEAL Monthly Digest, which
shows that the food product group's spending on press and TV
advertising rose from £64.2 millions in 1968 to £89.2 millions
Ex~enditure on Advertising
&
Market Researchbl
Census Food Trades, 1963 and 1968Advertising Market
Product Group Research
1963 1968 1963 1968
Grain milling and animal and poultry
foods 12.4 19.4 0.5 0.5
Bread and flour
con-fectionery & biscuits 6.4 8.2 0.2 0.3
Bacon curing, meat
and fish products 6.9 8.8 0.2 0.3
Sugar 0.1 0.4 N.a.
Cocoa, chocolate &
sugar confectionery 13.2 16.5 0.2 0.5
Fruit and vegetable
products 8.8 13.2 0.2 0.4
Vegetable and animal
oils and fats 0.1 0.4 0.1
Milk and milk products, margarine starch and
miscellaneous foods 19.6 30.4 0.6 1 .2
Source: Censuses of Production
1963, 1968, 1970-72
£ Millions
Total
1963
12.9
6.6
7.1
0.1
13.4
9.0
0.1
20.2
1968
19.9
8.5
9.1
N.a.
17.0
13.6
0.5
[image:23.595.104.555.117.524.2]a large increase as occurred for the 21 combined
product-groups identified by MEAL during the same period, with the
result that food's share of the total fell from 21.7 per cent.
in 1968 to 19.3 per cent. in 1973.
2.21: Even so, food products is by far the largest
spender among the 21 groups, its nearest rivals being retail
and rna i I order (£50. 7 m iII ions in 1973), household stores
(£32. 7 mill ions), toiletries and cosmetics (£32. 6 mill ions),
financial advertising (£32.1 millions) and drink (£30.0 millions).
In relation to total household food spending, the press and TV
advertising expenditures shown in Table 2.10 declined slightly
from 1.14 per cent. in 1968 to 1.05 per cent. in 1973.
2.22: What can also be seen from Table 2.10 is
that advertising of food products on TV has increased relative
to press advertising. In 1968, TV advertising already accounted
for over 85! per cent. of the combined TV and press total; by
1973 it had increased to over 88 per cent. At the same ·time,
food products accounted in 1973 for 35! per cent. of the total
TV advertising expenditure as compared with nearly 39 per cent.
in 1968.
2.23: Finally, the food product-lines which were
most heavily advertised in 1973 were:
Chocolate confectionery £12.0 milt ions
Ready-to-eat cereals £ 5.4 millions
Margarine £ 4.9 mill ions
Biscuits £ 4.3 mill ions
Cheese £ 3.6 millions
Coffee and coffee extracts £ 3.5 mi II ions
Expenditure on Press
&
TV Advertising, by Food and All Product Groups£ Mill ions
Food Total
TV
Press TotalTV
Press Total1968 55.0 9.2 64.2 141 .5 154.0 295.5
1969 58.7 10.8 69.5 146.5 176.1 322.7
1970 56.2 14.2 70.4 141.5 173.9 315.4
1971 64.0 10. 1 74.1 163.6 182.5 346.1
1972 79.3 9.2 88.5 205.5 217.9 423.4
1973 78.6 10.6 89.2 221 .6 241.7 463.3
There were, in addition, another seven products groups where
1972 expenditure exceeded £2 mill ions, namely:
Bread and bakeries Tea
Meat and vegetable extracts Canned vegetables and pasta
Sugar confectionery Convenience desserts Sauces, pickles and
sa lad creams
Altogether these 13 product groups (out of 54 altogether)
accounted for
8J
per cent. of the food TV spending but under50 per cent. of the food press spending, or 62 per cent. of
3.1: The analysis of Census of Production data by
enterprises relates on the one hand to each individual trade (on
a Minimum List Heading basis) and to each SIC Order (that is,
a group of trades) on the other. This means that at the SIC
Order level the enterprise analyses refer to the whole of Food,
Drink and Tobacco (Order Ill), which as already described in
paragraph 2.2 extends beyond the scope of the food processing
industry. It is also worth emphasising at the outset that the
UK definition of an enterprise - "one or more establishments
under common ownership or control11
- differs from that used in
other EEC countries where each legal entity is treated as a
separate enterprise, irrespective of whether it is an independent
or subsidiary company. To that extent, the UK definition is
closer to what is required in economic analyses of concentration.
3.2: It is clearly desirable to establish as far as
possible the enterprise structure of the food processing industry
as a whole, and at first sight this might seem to involve no more
than aggregating the published Census data for all the trades
comprising food processing. Unfortunately matters are not as
straightforward as that, for the reasons given in the Census
report covering enterprise analyses (Volume 128 of the Report on
the Census of Production, 1968), namely:
"The enterprise unit (also) varies according to the level of analysis •.• at the Standard Industrial Classification order level of analysis, the enter-prise consists only of those establishments under its ownership and control classified to the industries of that Standard Industria I Classification order; at the census industry level of analysis the enterprise consists only of those establishments {or establishment) under its ownership or control classified to that
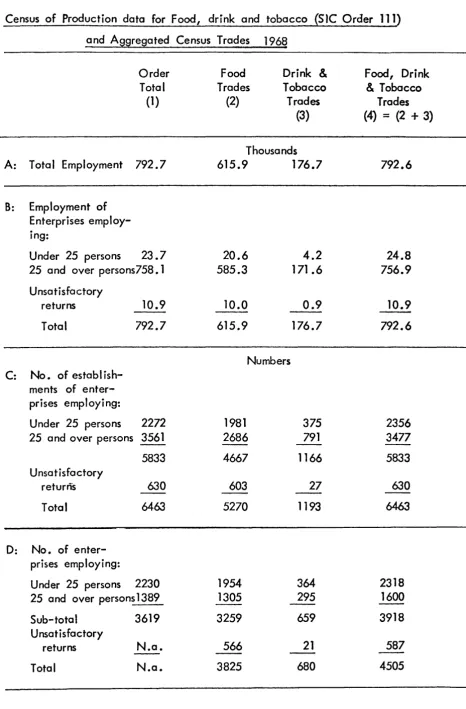
3 • 3: Who t this means as far as the Census
enterprise statistics are concerned can be explored with the
assistance of Table
3.1.
In section A of Table3.1
is shownthe total employment of the SIC Order Ill (Food, Drink and Tobacco)
on the one hand, and those shown by summing the constituent census
industries for Food trades (i.e. industry codes
211 - 229. 1:
and229.2)
and Drink and Tobacco (i.e. industry codes,231,232,
239.1
and239.2
and240)
on the other. The SIC Order totalemployment is shown to correspond with that obtained by
aggre-gating the industry totals. In Section B of Table
3.1
is shownthe breakdown of the Order and census trades' total employment
as between enterprises employing (i) under
25
persons (ii) over25
persons, and unsatisfactory returns. ~ The employment coveredby unsatisfactory returns is the same for the Order total as for the
aggregated census industries. But whereas the SIC Order total
employment for enterprises employing under
25
persons is23, 700
persons, the aggregated census industries' figure is slightly higher
at
24,800,
with the result that the larger enterprises SIC Ordertotal employment at
758, 100
is higher than the756,900
on theaggregated census industries basis.
3.4:
The third Section C of Table3.1
gives thenumber of establishments of enterprises relating to the employment
figures given in Section B. The number of establishments covered
by the unsatisfactory returns is once ago in the same for the SIC
Order as for the aggregated census trades. But whereas there are
2, 272
establishments operated by enterprises employing under25
persons according to the SIC Order statistics, there are
2, 356
such establishments when the census trades' data are aggregated.
Similarly, the Order total for the larger enterprises is
3,561
estab I ishments, whereas for census' trades summed together the
Census of Production data for Food, drink and tobacco (SIC Order l11)
and Aggregated Census Trades 1968
Order Food Drink & Food, Drink
Total Trades Tobacco & Tobacco
(1) (2) Trades Trades
(3) (4) = (2
+
3)Thousands
A: Total Employment 792.7 615.9 176.7 792.6
B:
Employment ofEnterprises employ-ing:
Under 25 persons 23.7 20.6 4.2 24.8
25 and over persons758. 1 585.3 171 .6 756.9
Unsatisfactory
returns 10.9 10.0 0.9 10.9
Total 792.7 615.9 176.7 792.6
Numbers
C:
No. ofestablish-ments of enter-prises employing:
Under 25 persons 2272 1981 375 2356
25 and over persons 3561 2686 791 3477
5833 4667 1166 5833
U nsa tis factory
returns 630 603 27 630
- -
- -
-Total 6463 5270 1193 6463
D: No. of
enter-prises employing:
Under 25 persons 2230 1954 364 2318
25 and over persons 1389 1305 295 1600
-Sub-total 3619 3259 659 3918
Unsatisfactory
returns N.a. 566 21 587
[image:29.588.71.538.107.816.2]
3.5: Finally, Section D of Table 3.1 shows the
number of enterprises controlling the establishments given in
Section C. For the SIC Order, the toto I number of enterprises
submitting satisfactory returns comes to 3,619, but the number
of enterprises relating to the unsatisfactory returns is not ova ilable.
However, the toto I number of enterprises submitting satisfactory
returns summed for the Census trades comes to 3, 918, nearly
300 (or 8 per cent.) more than the SIC total. This is because,
as pointed out in paragraph 3 .2, the same enterpdse can make
more than one appearance in the census trades' total but only appear
once in the SIC Order data. It will also be noted that whereas
the number of enterprises employing under 25 persons is under
4 per cent. lower than on the aggregated census trades basis,
the difference amounts to over 15 per cent. for the larger
enter-prises.
3.6: The fact that the same enterprise may make
more than one appearance among the census trades but only one
appearance in the SIC Order toto I means that it may appear as
a small enterprise (i.e. under 25 persons) in more than one census
trade but is transformed into a larger enterprise (i.e. employing 25
or more persons) in SIC Order terms. What is more, even if it
is a large enterprise in each of the census trades where it operates,
its size classification on the SIC Order basis will refer to its total
employment within the SIC Order as a whole.
3.7: It is also true that the same enterprise may
appear among those numbered under the Drink and Tobacco trades
in Table 3.1 as well as under the Food trades heading. But as
an approximation to the overall structure of the food trades it is
conceptually better to base it on the difference between the SIC
the data for the food trades as such since the overlap and
double-counting would be considerably greater by the latter method.
The Structure of the Food Processing Trades
3.8: With all the qualifications that must be
attached to the data in the I ight of the above considerations,
Table 3.2 shows the 1968 size-distribution of 2,499 enterprises
classified to food processing trades as defined in paragraph 2.2.
This toto I has been arrived at by two stages: first, by deducting
from the SIC Order total the enterprises classified to the Drink
& Tobacco trades making satisfactory returns (see Table 3.1,
3, 619 minus 659 = 2, 960}, and second, by further subtracting
the enterprises classified to Animal and poultry foods (industry
code 219) amounting in 1968 to 461 {after excluding unsatisfactory
returns}.
*
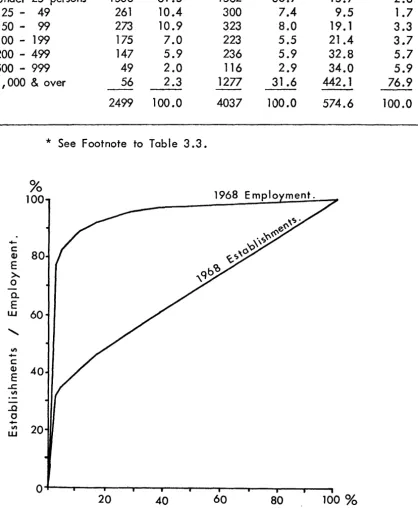
3.9: It will be seen from Table 3.2 that over
three-fifths of the approximate total of 2, 500 enterprises in
food processing employed less than 25 persons on this basis, and
although they accounted for close on two-fifths of the 4, 000
establishments, their share of the 575,000 employment was less
than 3 per cent. At the other end of the scale, there were 56
enterprises (less than 2~ per cent. of the total} employing more
than 1, 000 persons in over three-tenths of the establishments but
accounting for more than three-quarters of the total employment.
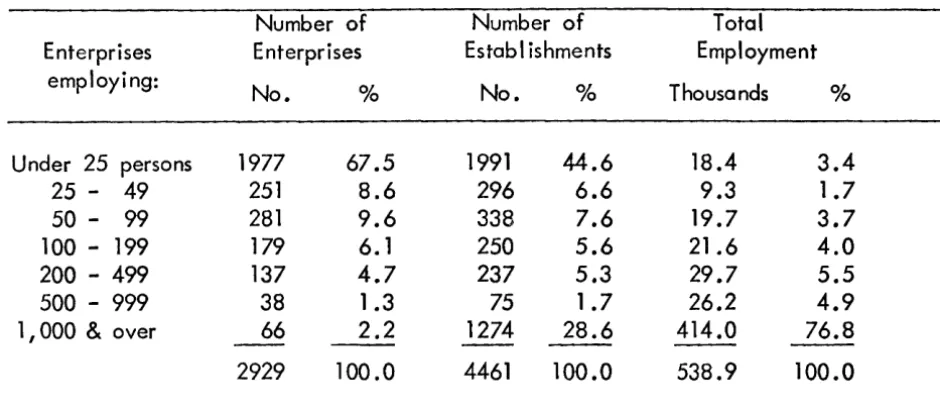
3.10: In Table 3.3 are shown the comparable data
from the 1963 Census of Production. It wi II be seen that for
the whole of the food processing trades the number of enterprises
was 2,929 in 1963, some 430 more than in 1968, although the
*
See footnote to Table 3.2 for further qualification toTABLE 3.2
*
Size-distribution of food processing enterprises, 1968
Number of Number of
Enterprises Enterprises Establishments
employing:
No. % No. %
Under 25 persons 1538 61 .5 1562 38.7
25 - 49 261 10.4 300 7.4
50 - 99 273 10.9 323 8.0
100 - 199 175 7.0 223 5.5
200 - 499 147 5.9 236 5.9
500 - 999 49 2.0 116 2.9
1, 000 & over 56 2.3 1277 31 .6
-2499 100.0 4037 100.0
*
See Footnote to Table 3.3.%
100
-
c:Q)
E
>..
0
Q.
E
[image:32.593.65.484.260.768.2]w 60
...
V)
-
c:Q) 40
E
....c:
V)
...0
0
-
V)20
w
20 40 60 80
Total Employment
Thousands %
15.7 2.8
9.5 1. 7
19. 1 3.3
21.4 3.7
32.8 5.7
34.0 5.9
442.1 76.9
574.6 100.0
100%
Size-distribution of food processing enterprises, 1963*
Number of Number of Total
Enterprises Enterprises Estab I ishments Employment
employing:
No.
%
No.%
ThousandsUnder 25 persons 1977 67.5 1991 44.6 18.4
25 - 49 251 8.6 296 6.6 9.3
50 - 99 281 9.6 338 7.6 19.7
100 - 199 179 6.
1
250 5.6 21 .6200 - 499 137 4.7 237 5.3 29.7
500 - 999 38 1 .3 75 1 • 7 26.2
1, 000 & over 66 2.2 1274 28.6 414.0
2929 100.0 4461 100.0 538.9
*
Of the 2, 929 enterprises in 1963, approximately 1, 011 were in theBread and Flour Confectionery Industry. By 1968 this number had
%
3.4 1 .7 3.7 4.0 5.5 4.9 76.8
100.0
fallen to approximately 685 out of 2,499 enterprises. This is important
since the treatment of bakers varies substantially among the EEC
countries. In the U.K. production at small bakehouses {i.e.
bake-houses with fewer than 25 employees) attached to bakers shops is
excluded. In practice this means that only bakehouses supplying
[image:33.591.66.536.168.373.2]whole of the difference was accounted for by a decline in the
number of enterprises employing less than 25 persons. The
number of establishments fell by much the same figure as the
number of enterprises, again reflecting the change among small
enterprises. Employment, on the other hand, increased between
1963 and 1968 by 35,700, or 6.6 per cent.
3.
11: While the proportion of total employmentheld by enterprises each employing over 1, 000 persons was
virtually the same in 1963 as in 1968, and such enterprises
represented the same proportion of the total number of
enter-prises, their numbers were 66 in 1963 as compared with 56 in
1968. There was also a fall in the number of
enterprisesemploy-ing at least 25 persons but under 1, 000 between the two years,
from 905 to 886, with their share of total employment falling
slightly.
3.12: For this reason, it is worthwhile to compare
the size-distribution of the larger enterprises (i.e. those employing
25 or more persons) in 1963 and 1968, more particularly because
other relevant Census data relate only to these larger enterprises.
The enterprise, establishment and employment distribution data
are shown for the two years in Table 3 .4. The proportion of
establishments and employment controlled by enterprises employing
1, 000 or more is not significantly different in 1968 from what it
was in 1963, although the number of such enterprises fell as stated
earlier from 66 to 56 during this period. Indeed, the whole
distribution of both establishments and employment is very similar
in both years.
3.13: The same picture emerges when attention is
Size-distribution of larger food processing enterprises, 1963 and 1968
Larger
Enterprises Establishments Employment
Enterprises
employing: 1963 1968 1963 1968 1963 1968
25 - 49 persons 26.4 27.2 12.0 12.1 1 . 8 1 • 7
50 - 99 29.5 28.4 13.7 13.1 3.8 3.4
100 - 199 18.8 18.2 10.1 9.0 4.2 3.8
200 - 499 14.4 15.3 9.6 9.5 5.7 5.9
500 - 999 4.0 5. 1 3.0 4.7 5.0 6.1
1, 000
&
over 6.9 5.8 51 .6 51 .6 79.5 79.1100.0 100.0 100.0 100.0 100.0 100.0
Base: 952 961 2470 2475 520.5 558.9
(Thousands)
%
100
+-c:
(I)
80
E
>..
0
a.
E w
[image:35.590.86.455.432.780.2]60
...
II)
+-c
(I)
40
E
L II)
..0
0
-
II)20
w0
20
40
60
80
100%
expenditure by size of enterprise in 1963 and 1968. The
rele-vant data are given in Table 3 .5, incorporating a degree of
estimation in some cases. The proportion of net output controlled
by enterprises employing 1, 000 or more in each of the two years
shows a marginal decline, while their share of total net investment
shows an even smaller increase.
3. 14: Too much must not be read into these
com-parisons in view of the method by which they have been reached,
but there is I ittle indication from these figures that the general
structure of the food processing industry as a whole changed in
any significant way in the five years between 1963 and 1968.
Concentration among the food processing industries
3.15:
The changes that occurred between 1963 and1968 in the number of enterprises employing (a) more than 200
persons and (b) more than 1, 000 persons in each of the census
trades within food processing are shown in Table 3.6. It will
be seen that the number of enterprises employing more than
200 persons fe II between 1963 and 1968 in five of the nine
census trades for which data are available, namely: Grain
milling, Bread and flour confectionery, Biscuits, Cocoa,
choco-late and sugar confectionery, and Fruit and vegetable products.
In the case of the other four trades - Bacon curing, meat and
fish products, Milk and milk products, Vegetable and animal
oils and fats, and Starch and miscellaneous foods - there was
an increase in the number of enterprises employing more than
200 persons. These increases are, however, likely to have been
associated with changes in the Census coverage of the trades
Larger food processing enterprises: Net output and Net capital expenditure,
1963 and 1968
Larger Net output Net Capital
expenditure Enterprises
1963 1968 1963 1968
employing
%
o/o
% %25 - 49 persons 1 .4 1.4 1 .3 1 .5
50 - 99 3.0 3. 1 2.8 3.5
100 - 199 4.3 3.9 4.5 4.5
200 - 499 8.2 8.4 9.8 7.4
500 - 999 3.2 4.4 4.4 5.2
1, 000 & over 79.9 78.8 77.2 77.9
[image:37.589.75.539.127.372.2]scope of the Bacon curing trade in 1968, milk heat-treaters for
retail or wholesale distribution into Milk and milk products,
and tea blending and coffee roasting and blending into Starch
and miscellaneous foods.
3.16: The same qualification applied to the number
of enterprises employing more than 1, 000 persons in these three
trades, of which two - Bacon curing etc. and Milk - show an
increase in such enterprises between 1963 and 1968, and the
other (Starch and miscellaneous foods) no change. Otherwise
there has been a fall in the number of enterprises employing
more than 1, 000 persons (as well as those employing more than
200) in the same five trades cited in the preceding paragraph.
3.17: The shares of employment and net output,
as well as the proportion of enterprises employing more than 200
and more than 1, 000 persons in the five census trades of
com-parable coverage in 1963 and 1968 are shown in Table 3.7.
For all five trades, the total number of enterprises fell between
1963 and 1968, the decline being relatively most marked for
Grain milling (39 per cent.), Bread and flour confectionery
(32 per cent.) and Cocoa, chocolate and sugar confectionery
(26 per cent). The proportion of the total number of enterprises
employing more than 200 persons rose for these same three trades,
as did their shares of trade employment and net output. For
Biscuits, enterprises employing more than 200 persons represented
the same proportion of the total number in 1968 as in 1963, with
their shares of employment and net output falling slightly. For
the Fruit and vegetable products trade, the proportion of
enter-prises employing more than 200 persons fell but their relative
importance in terms of trade employment and net output increased
Number of enterprises employing {a) more than 200 and {b) more than 1,000
in census food processing trades, 1963 and 1968
Number of enterprises employing:
More than More than
200 1,000
1963 1968 1963 1968
Grain milling 17 14 7 6
Bread and flour confectionery 66 61 15 13
Biscuits 25 21 12 10
Bacon curing, meat and
fish products 57 68 12 16
Milk and milk products 20 56 6 10
Sugar N.a. N.a. N.a. 3
Cocoa, chocolate and sugar
confectionery 43 41 14 12
Fruit and vegetable products 53 41 13 11
Vegetable and animal oils
and fats 10 11 N.a. N.a.
Margarine N.a. 4 N.a. N.a.
Starch and miscellaneous
[image:39.590.67.537.177.487.2]TABLE 3.7
Relative importance of enterprises employing (a) more than 200· and
(b) more than 1, 000 in certain food processing census trades
Total Enterprises employing Enterprises employing
No. of more than 200 as percent. more than 1, 000 as percent.
Enter-Enter- Employ- Net Enter- Employ- Net
prises
prises ment Output prises ment Output
Grain milling:
1963 405 4 75! 79 1! 63! 68
1968 248 5! 78! 82 2! 65 70!
Bread and flour confectionery:
1963 1011 6! 84 84! 1! 71 72
1968 685 9 88! 89 2 74! 76
Biscuits
1963 78 32 97 97 15! 81! 84
1968 65 32 96! 96 15! 84 84
Cocoa, chocolate &
sugar confectionery
1963 461 9! 87 89 3 73! 76!
1968 340 12 90 91! 3! 75 77!
Fruit and vegetable products
1963 315 17 87 90 4 64 69
the proportion of such enterprises as far as total enterprises are
concerned occur for the same three trades as before, and each
shows an increase in their shares of trade employment and net
output. For Biscuits, however, the largest enterprises are again
the same proportion of the total number in 1968 as in 1963, but
in terms of employment (but not net output) their relative importance
has increased. The remaining trade Fruit and vegetable products
-shows, however, a much more significant increase in the share of
the largest enterprises of trade employment and net output than
was the case for the enterprises employing more than 200 persons.
Sales concentration-ratios for selected products
3.19: The 1968 Census of Production gives
concen-tration ratios in terms of the sales by larger establishments (i.e.
those employing 25 or more persons) for 33 products in that year,
with comparable data for 1963 for 30 out of the 33 products.
The concentration-ratios show the share of sales for the five
enter-prises with the largest sales in the two years, and also the number
of enterprises in 1963 accounting for the same proportion of sales
as the largest five in 1968.
3.20: In Table 3.8 are shown the 14 products for
which the concentration-ratio of the five largest enterprises has
increased by more than 1 percentage-point between 1963 and
1968. It will be seen from this Table that there were four
products where the five enterprises with the largest sales accounted
for over 80 per cent. of the sales in 1968, and the average increase
in their concentration ratios between 1963 and 1968 came to under
3 percentage-points. For another six products, the 1968 sales
TABLE
3.8
Sales concentration-ratios of five largest enterprises in food product-groups,
1963
and1968
Trades with increases in concentration ratio
Meal and flour (excluding self-raising flour and semolina)
- white flour for breadmak ing
Bread sold in loaves or rolls Flour confectionery
Biscuits for human consumption Bacon and ham, cured and smoked Sausages (other than black puddings)
and sausage meat
Sugar confectionery (excl. chocolate) Marmalade and jams
0 ther preserved fruit
Vegetables preserved in airtight con-tainers (other than homogenised baby foods)
Vegetables, quick frozen Pickles, sauces and rei ishes
Vegetable and seed oils (other than I ubricating)
Self-raising flour
Trades with Static Concentration Ratios
Fish and fish products, quick frozen Cheese and processed cheese
Condensed (incl. evaporated) milk Sugar
Cocoa products
Fish and marine oils (other than I ubricating)
Margarine
1963
o/o
79.2
71
.4
51 .0
65.5
47.4
52.2
35.9
72.9
37.7
65.3
93.3
68.0
82.3
88.0
91
.778.5
93.4
98.6
82.3
92.8
92.8
1968
o/o
80.8
77.3
60.1
71
.0
56.9
56.2
43.5
75.6
45.7
66.7
97.1
71
.5
84.3
91
.791 .
177.7
94.4
99.3
83.3
92.9
93.8
No. of enterprises
in
1963
with thesame
concentration-ratios as in
1968
6
9
8
7
86 7 6 7
5 6 6
6 8
5
5 5 5 6
Sales concentration-ratios of five largest enterprises in food product-groups,
1963 and 1968
Trades with falls in concentration
ratio
Meal and flour (excluding self-raising flour and semolina)
other flour
Cereal breakfast foods in packets for retail sale
Butter
Milk powder
Ice cream, including loll ies Potato crisps
Soups
Compound fat (including shortening) Coffee, and coffee and chicory
extracts and essences
Trades with concentrations ratios for
1968 only
Dressed poultry, frozen, fresh or chilled and carcase meat and poultry, quick frozen
Heat treated milk Tea, blended
1963
o/o
71 .6
97.7
85.5
88.9
93.1
91.692.5
84.8
98.4
N.a. N.a. N.a.
1968
%
67.2
93.5
78.4
84.7
91 .283.3
90.4
82.6
93.7
39.2
44.2
82.9
Source: Census of Production, 1968
No. of enterprises in 1963 with the same concentration-ratios as in 1968
<5
<5
<5
<5
<5
<5
<5
<5
<5
1963-68 increases averaging around 4! percentage points. For
the other four products, the 1968 sales concentration-ratios
ranged between 40 and 60 per cent. in 1968, with an average
increase of over 7 percentage points since 1963.
3.21: There were, in addition, seven products
where the sales concentration ratio changed by no more than
1 percentage point between 1963 and 1968. For five out of these
seven products, all of which had sales concentration-ratios in
excess of 80 per cent. in 1968, there were increases rather than
decreases in those concentration-ratios. For the other two, one
had a concentration-ratio of over 90 per cent. in 1968; the
other just under 80 per cent.
3.22: Finally, apart from the products with only
a 1968 concentration-ratio, there were nine products where the
sales concentration-ratio was lower in 1968 than in 1963. Five
out of these nine products had concentration-ratios of more than
90 per cent. in 1963, the average fall in their concentration
ratio amounting to just over 4 percentage points. Another three
products had 1963 concentration-ratios of 80-90 per cent., and
in their case, the average fall came to nearly 4! percentage
points. For the remaining product, with a sales
concentration-ratic of over 70 per cent. in 1963, the percentage-points fall
in the ratio also came to nearly 4! percentage points.
3.23: It will also be seen from Table 3.8 that
for 13 out of the 14 products with higher sales
concentration-ratios in 1968 than in 1963, the number of enterprises accounting
for the 1968 proportion of product-sales was greater than five i.e.
the number of enterprises on which the 1963 and 1968
for six out of the 13 products, the number of enterprises
respons-ible in 1963 for the 1968 share of the largest five was seven or
eight, and for the remaining six products, the number was six.
3. 24: The reasons for these changes in product
concentration-ratios between 1963 and 1968 will be further
explored in the product market studies which comprise the second
part of this Study. But it is clear from these data that changes
in the level of concentration at the product-level between 1963
and 1968 are much more evident than changes in the overall
structure of the food processing industry during the same period.
J .25: It will be recalled that earlier in this
Chapter, reference was made to the Census of Production data
which showed a fall in the estimated number of enterprises in
food processing from 2, 929 in 1963 to 2,499 in 1968, but for
larger enterprises (i.e. those employing 25 or more persons), a
slight increase from 952 to 961 • It is a I so the case that there
were changes in the definition of three census trades between
the 1963 and 1968 {see para. 3.15 above) censuses which
contributed to a significant increase in the number of
enter-prises in those trades. The increase in the number of larger
enterprises in the three census trades concerned amounted to
just over 300 between 1963 and 1968. While it cannot be
assumed that these enterprises were not already represented
elsewhere among the census trades comprising food processing,
it is more than possible than on a strictly comparable coverage
the number of larger enterprises in food processing would have
3.26: At the census industry level, the total
number of enterprises are available for 1970 and 1971. These
data are shown in Table 3.9, from which it will be seen that
during the 1968-71 period the number of enterprises rose for
eight out of the 11 census trades in food processing. Of the
two trades with dec I ining numbers, the fall was numerically
greater for Milk and milk products (down by 139) than for
Cocoa, chocolate and sugar confectionery (down by 26), while
the number of enterprises in the Margarine trade remained the
same.
3.27: Unfortunately the precise number of larger
enterprises are not ova ilable from the 1970 and 1971 Census
data so far published, such figures for larger enterprises as
are available for 1970 relating to returns received.
Merger activity among food processing companies
3.28: A comprehensive analysis of merger activity
among U.K. quoted companies with assets of more than £500,000
in 1961 was pub I ished by the Department of Trade and Industry
in 1970. This covered the period 1958-68 inclusive, with
separate data relating to the Food industry. The "population"
of companies included in the analysis remained unchanged, apart
from disappearances through mergers, so that no companies which
first became large enough to meet the size qualification after
the beginning of 1961 have been brought in.
3.29: In Table 3.10 are shown the changes in the
number of quoted Food companies covered by the analysis in the
six years 1958-63 inclusive, and the next five years, 1964-68
Number of Enterprises in Census Food Industries, 1963, 1968, 1970 and 1971
All Enterprises:
1963 1968 1970 1971
Grain Milling 405 248 297 289
Biscuits 78 65 69 69
Bread and flour confectionery 1 '011 685 696 714
Bacon curing, meat and fish products 667 734 864 848
Milk and milk products 306 598 515 459
Sugar 19 16 17 18
Cocoa, chocolate and sugar
confectionery 461 340 328 314
Fruit and vegetable products 315 261 275 288
Vegetable oils and fats 113 119 130 126
Margarine 20 14 14 14
Starch and miscellaneous foods 223 249 267 265
Source: Censuses of Production,
from 85 to 51, and in the second period to 39. At the same
time, the net assets of these companies rose from £487 millions
at end-1957 to £749 millions six years later, and stood at
£1,014 millions at end-1967.
3 .30: The number of mergers occurring in the
1958-63 period, therefore, totalled 34, and the net assets
involved in these mergers amounted to £80 millions. In the
next five years, when there were only 12 mergers involving
these companies, the net assets transferred amounted to £91
mi II ions.
3.31: For the whole of the 1958-68 period, the
total net assets involved in quoted Food company mergers amounted
to £171 millions, and Table 3.11 shows how this was divided
between mergers within the Food sector and those involving
companies outside it. Thus, out of the £171 millions, £86
millions was accounted for by 27 mergers within the Food
sector, the other 19 mergers relating to companies in other
sectors, the most important being retail distribution (£41 mill ions)
and tobacco (£15 millions) within the quoted company sector with
another £15 millions being involved in acquisition of companies
outside it. It will be noted that the average net assets involved
in these mergers was little more than £3 millions within the food
sector, whereas other acquisitions within the quoted company
sector average £5 millions.
3.32: In addition, Table 3.11 shows that there
were 13 acquisitions of quoted food companies by other quoted
companies during the 1958-68 period involving net assets of
£58 millions. Eight out of these 13 mergers involved companies
classified to retail or wholesale distribution acquiring food
Number of companies, net assets and merger activity in Food Trade, 1958-68
1957 1963 1968
TABLE 3.11
No. of Companies:
end-year
85 51 39
Net Assets:
end-year
£ Mns
487 749
1 I 014*
*
End-1967 net assetsNo. of mergers
in period
N.a. 34 12
Source: DTI: A Survey of Mergers, 1958-68
Net assets transferred
in period
£ Mns
N.a. 80 91
Number of mergers involving Food companies and net assets acquired, 1958-68
No. of Mergers Net Assets Acquired (£ Mn)
Within
Other Total Within Other Total
food food
By food companies 27 19 46 86 85 171