R
ESEARCHA
RTICLEThe mzqLibrary – An open source Java library supporting
the HUPO-PSI quantitative proteomics standard
Da Qi
1, Huaizhong Zhang
2, Jun Fan
3, Simon Perkins
1, Addolorata Pisconti
1,
Deborah M. Simpson
1, Conrad Bessant
3, Simon Hubbard
2and Andrew R. Jones
11Institute of Integrative Biology, University of Liverpool, Liverpool, UK 2The Faculty of Life Sciences, University of Manchester, Manchester, UK
3The School of Biological and Chemical Sciences, Queen Mary University of London, London, UK
Received: November 14, 2014 Revised: May 2, 2015 Accepted: May 29, 2015 The mzQuantML standard has been developed by the Proteomics Standards Initiative for
cap-turing, archiving and exchanging quantitative proteomic data, derived from mass spectrometry. It is a rich XML-based format, capable of representing data about two-dimensional features from LC-MS data, and peptides, proteins or groups of proteins that have been quantified from multiple samples. In this article we report the development of an open source Java-based library of routines for mzQuantML, called the mzqLibrary, and associated software for visualising data called the mzqViewer. The mzqLibrary contains routines for mapping (peptide) identifications on quantified features, inference of protein (group)-level quantification values from peptide-level values, normalisation and basic statistics for differential expression. These routines can be accessed via the command line, via a Java programming interface access or a basic graphical user interface. The mzqLibrary also contains several file format converters, including import converters (to mzQuantML) from OpenMS, Progenesis LC-MS and MaxQuant, and exporters (from mzQuantML) to other standards or useful formats (mzTab, HTML, csv). The mzqViewer contains in-built routines for viewing the tables of data (about features, peptides or proteins), and connects to the R statistical library for more advanced plotting options. The mzqLibrary and mzqViewer packages are available from https://code.google.com/p/mzq-lib/.
Keywords:
Bioinformatics / Data standard / MzQuantML / Proteomics standards initiative (PSI) / Software / XML
Additional supporting information may be found in the online version of this article at the publisher’s web-site1
Introduction
The Proteomics Standards Initiative (PSI) is a collective of academic groups, journal editors and industrial organisations (mainly instrument or software vendors) working together to
Correspondence: Dr. Da Qi, Biosciences Building, Institute of In-tegrative Biology, University of Liverpool, Crown Street, L69 7ZB, Liverpool, UK
E-mail: [email protected]
Fax:+44 151 795 4410
Abbreviations: API, application programming interface;CV,
con-trolled vocabulary;PCA, principal component analysis;PSI,
pro-teomics standards initiative;PSM, peptide-spectrum match;XML,
extensible markup language;XSD, XML schema definition
improve data sharing and reporting for proteomics. The PSI produces a number of output types as follows. First, the PSI has written minimum reporting guidelines describing what information should be included in a materials and methods section of an article or accompanying a data set, described in a “parent” document [1] and a set of modules describing individual techniques used in proteomics [2–8]. Second, the PSI has developed standard data formats, including mzML for raw or processed MS data [9], mzIdentML for peptide or protein identification data [10] and two formats with differ-ent levels of support for quantitative data – mzQuantML [11] and mzTab [12] (further described below). Third, the differ-ent data formats require a common terminology set, which
Colour Online: See the article online to view Figs. 1 and 3 in colour.
C
is captured in a controlled vocabulary (CV) – called the PSI-MS CV [13]. The PSI-PSI-MS CV is updated approximately every week, and currently contains>2400 different entries (release 3.76.0, May 2015), including terminology for names, mod-els/versions and parameters for instruments and software used in proteomic analysis, as well as various other necessary concepts. Each entry contains a term name, a definition, the unit that should accompany a given parameter if appropriate and synonyms etc. All of the formats described above must be populated with PSI-MS CV terms to make valid exam-ples (and which can be checked with validation software [14]), thus ensuring that files produced from different exporters encode information in a consistent and systematic manner. Lastly, groups affiliated with the PSI produce software tools or programming interfaces to assist either end users or other bioinformatics developers to use the standards correctly.
The mzQuantML format (or “.mzq”) is XML-based, and can contain a detailed trace of analysis steps that have been performed on data to detect and quantify 2D features in LC-MS data, peptide-level values inferred from these features, and protein or grouped protein (that cannot be separated due to shared peptides) quantitative values, in turn inferred by some methodology from peptide-level values. The format is designed to store tables of quantitative data (so called
Quant-Layers, italic indicating element name in mzQuantML) for
different levels (peptides, proteins or groups of proteins) de-rived from, and aligned across multiple samples (called As-says) or across pooled replicates (calledStudyVariables), for example where some averaging process has been performed. mzQuantML can also store descriptions of the processing steps that have occurred at each stage in a pipeline, cap-turing the software name, parameters, inputs and outputs. Lastly, the format can store statistics (e.g. p-values for differ-ential expression acrossStudyVariables) or other scores as-sociated with confidence of quantitative values. mzQuantML has several different modes – supporting individual types of technique: (i) MS1label-based (e.g. SILAC, N15, dimethyl
la-belling); (ii) MS2 tag-based (e.g. iTRAQ or TMT); (iii) MS1
intensity-based label free; (iv) label free spectral counting ap-proach and (v) SRM [15]. The same XML schema is shared across all modes, but the specific usage of general structures is governed by a set of “semantic rules” describing which structures should be used in each mode – which is checked by validation software [16]. As such, mzQuantML reading software is able to determine the quantitation mode in a given file, supporting the capability for designing analysis algorithms for only a subset of all proteomic techniques.
There is a close association between mzQuantML and the recently released mzTab format [12]. mzTab similarly cap-tures quantitative values about peptides and proteins, mea-sured across individual samples or grouped replicates (
As-says and StudyVariables), but in a simplified tab-separated
format designed to be loaded straightforwardly into spread-sheet or statistical processing software. mzTab can also con-tain peptide and protein identification data, using simplified structures from the (more detailed) mzIdentML format. As
such, mzTab is intended to be an output file from completed analysis pipelines, rather than acting as an internal analysis format supporting open source development.
We have previously developed a Java application program-ming interface (API) for mzQuantML, called jmzQuantML, which supports reading mzQuantML files into Java objects, and writing Java objects back to mzQuantML files on disk [16]. In this article, we describe the development of new resources building on top of jmzQuantML – the mzqLibrary and the mzqViewer. The package is copyrighted under the Apache Software License 2.0 (http://www.apache.org/licenses/ LICENSE-2.0.html). In a label-free quantitative proteomics pipeline (for example) there are a number of different steps that could be described aspre-processing/processing steps per-formed by a variety of packages (reviewed in [17]): e.g. base-line correction; feature detection and quantification; retention time (RT) alignment of chromatograms from parallel LC-MS runs; identification of peptides and proteins for example by a search engine. There are then steps that could be described
as post-processing – mapping identifications onto features;
inferring quantitative values for proteins or protein groups from peptide values; performing normalisation; performing statistics for differential expression testing [18, 19] and data visualisation. The mzqLibrary aims to provide open source mzQuantML-supporting routines for post-processing steps, i.e. all steps in a pipeline after feature detection and align-ment of chromatograms (if performed). There are numerous examples of on-going research to develop new algorithms for normalisation [20] and statistical testing [19, 21, 22], but new algorithms are often difficult to test in combination with data processed through standardised pipelines, due to file format incompatibilities. Similarly, although there are several excel-lent integrated proteomic pipelines and tools available, no-tably the TPP for example [23], we aim to provide tools that are fully compatible with the PSI standards. The provision of the mzqLibrary will therefore enable new routines devel-oped by other groups to be plugged into a complete analysis pipeline, so long as their routine supports mzQuantML for input and output. We have also created a visualisation pack-age, mzqViewer, which provides access to methods within the mzqLibrary and enables straightforward visualisation of mzQuantML files.
2
Materials and methods
2.1 Development of mzqLibrary and mzqViewer
(http://www.r-project.org/), which must be co-installed by the user to gain full functionality of the mzqViewer. The prereq-uisites and installation guide for running mzqLibrary can be found at the website (https://code.google.com/p/mzq-lib/).
2.2 Description of routines
The current release of both the mzqLibrary and mzqViewer is 1.0-beta. The “beta” status reflects that a large number of different routines are contained, and all have been tested to a reasonable level of validation, but we expect that there will be some bugs reported as the software gains usage with mzQuantML files generated from a wider range of source pipelines. A 1.0-final release will be made at the end of 2015. The following sub-sections briefly describe each routine, the algorithms contained within, and the appropriate input and output formats – as summarised in Table 1. With the excep-tion of the “VISUALISATION” routines (only available in the mzqViewer) – all other routines can be accessed via three dif-ferent routes (i) command-line access, which makes it pos-sible to embed routines in other non-Java based pipelines under any platform, e.g. Galaxy [26], (ii) Java API library for other Java applications to invoke routines directly and (iii) access from a simple graphical user interface (GUI) em-bedded in the mzqViewer – enabling end users to run sin-gle routines independently. We will later be releasing a full software package for proteomics analysis called ProteoSuite (http://www.proteosuite.org/), which will include the mzqLi-brary, mzqViewer and quantitation by label-free or tag-based (iTRAQ/TMT) approaches.
2.2.1 Progenesis LC-MS converter
Progenesis LC-MS (recently renamed to Progenesis QI from Waters Corp.) is a quantitative analysis software package for label-free proteomics by LC-MS. In the mzqLibrary, we have bundled the previously described PPP package from our group [25]. Alongside other quantitation-based functions, the PPP contains a converter for creating valid (label-free) mzQuantML files from Progenesis results exported in the Peptide/Feature.csv and Protein.csv formats.
2.2.2 MaxQuant converter
MaxQuant is popular free software for stable isotope-based and label-free quantitative proteomic analysis [27]. We have included in the mzqLibrary a converter that takes as input MaxQuant files: evidence.txt, peptides.txt, proteinGroups.txt, ExperimentalDesignTemplate.txt and summary.txt, and con-verts to valid mzQuantML, supporting label-free and SILAC workflows. The converter has been tested on the latest release of MaxQuant (version 1.4.0.8), but we cannot guarantee that the converter will function on all older and future releases of MaxQuant since the formats of the output files have not been stable across all releases.
2.2.3 OpenMS consensusXML converter
OpenMS is flexible and powerful open source software for constructing analysis pipelines for proteomics [28]. There is planned native support in OpenMS longer term for mzQuantML as an input and output format, but to date, there is no released converter for taking label-free results in OpenMS and converting to mzQuantML. Hence, we have developed a simple converter for OpenMS consensusXML files (following alignment of parallel LC-MS maps) and con-verting to mzQuantML files. Our converter is not a general purpose OpenMS to mzQuantML converter, and as such is flagged as an alpha release.
2.2.4 mzTab, HTML, CSV and XLS converters
We have incorporated file format converters for exporting mzQuantML to various useful formats. The mzTab exporter embeds the jmzTab API [24], writing valid files that for ex-ample could be submitted to the ProteomeXchange pub-lic repository [29] or loaded into a spreadsheet or statis-tical software easily. To support end user visualisation of results and downstream analysis, we have also written ex-porters to a simple Comma Separated Values (CSV) file mat (not-standardised), equivalent version in XLS (Excel for-mat) and HTML for viewing mzQuantML formatted results in web-pages.
2.2.5 IDMapper
Typically different algorithms or software packages used in analysis workflows for quantifying peptides (e.g. feature de-tection and quantification from MS1 data in LC-MS maps)
are from those used to identify peptides, via for example se-quence database search of MS2peak list spectra. Peptide (and
protein) identifications and associated scores can be stored in the mzIdentML standard [10], and each peptide-spectrum match (PSM) can be associated with the RT when the scan was generated. It is possible for statistics and other post-processing steps on identification results to be performed using the mzidLibrary from our group [30]. For quantifica-tion workflows there is a requirement to map identificaquantifica-tions from PSMs to quantified features from MS1data, which can
be achieved by the IDMapper routine. The IDMapper can be used in scenarios for mapping search engine results (from any mzIdentML supporting search engine) onto quantified features from any software output that can be converted to mzQuantML – it is not used for the results presented in this manuscript, since identifications have already been mapped on features via Progenesis.
Ta b le 1 . The routines presented in the cur rent release o f the mzqLibrary and m zqV iewe T y pe R outine S tatus T ec hniques co vered Inputs (I:) and outputs (O:) P arameter s IMPOR TER P rogenesis L C-MS con ver ter PPP R e lease 1 .0.4 Label-free I: P e ptide.csv or F eature.csv and P rotein.csv (P rogenesis) O: 1 m zq file IMPOR TER MaxQuant con ver ter 1.0-beta Label-free and SILA C I: peptides.txt, proteinGroups.txt, summary .txt, experimentalDesignT emplate.txt O : 1 mzq file None IMPOR TER OpenM S c onsensusXML con ver ter Alpha Label-free I: 1 c onsensusXML file O : 1 mzq file containing quantified peptide list None EXPOR TER mzT a b c on ver ter 1 .0-beta A ll I: 1 m zq O: 1 m zT ab None EXPOR TER HTML con ver ter 1 .0-beta A ll I: 1 m zq O: 1 H TML file None EXPOR TER CS V c on ver ter 1 .0-beta A ll I: 1 m zq O: 1 C S V (non-standard format) N one EXPOR TER XLS con ver ter 1 .0-beta A ll I: 1 m zq O: 1 XLS (Excel) fi le None PROCESSING IDMapper 1 .0-beta Label-free I: 1 m zq file w ith feature lists and list of aligned but unidentified peptides and n mzIdentML files – one per F eatureList, O : 1 mzq file The pairings of raw fi le name and mzIdentML file PROCESSING Normalisation 1 .0-beta Label-free I: 1 m zq file c ontaining “raw” peptide QuantLayer O: 1 m zq file c ontaining “raw” a nd “normalised” p eptide-level QuantLayer s PSI-MS CV accession identifying the d ata type o f the input (raw peptide) QuantLayer and output (normalised peptide) QuantLayer PROCESSING P rotein quant inference 1.0-beta An y that u ses AssayQuant- Layer s I: 1 m zq file c ontaining quantified peptides O: 1 m zq file c ontaining quantified peptides and p rotein groups PSI-MS CV accession identifying the data type of the input (peptide) QuantLayer and o utput (protein group) QuantLayer PROCESSING ANO V A 1 .0-beta A n y that uses AssayQuant- Layer s (no ratio-based ANO V A) I: 1 m zq file c ontaining a p rotein or protein-group level AssayQuantLayer O: 1 mzq file with added G lobal QuantLayer containing p-values N a rr ays of Assays; P SI-MS CV accession identifying the data type of the input (protein or protein g roup) QuantLayer VISUALIS A TION Heat map 1 .0-beta A n y I: 1 m zq file v ia mzqV iewer; O: on-screen or PDF User selects the QuantLayer VISUALIS A TION Line plots 1 .0-beta A n y I: 1 m zq file v ia mzqV iewer; O: on-screen User selects peptides or proteins to plot VISUALIS A TION P
rincipal Component Analysis
requiresnmzIdentML files as input – one per FeatureList (e.g. each sourced from one raw file analysed). If the soft-ware that generated the mzIdentML file did not include RT values for PSMs, then there is a routine in the mzidLibrary
(AddRetentionTimeToMzid) for retrieving these values from
the source spectrum file (currently supporting MGF format-ted peak lists containing the attribute RTINSECONDS in the header of each spectrum). If the RT values are completely unknown, the IDMapper cannot function.
The IDMapper applies the following algorithm. In the first step, it loops through each of then mzIdentML files – for which there will bencorrespondingFeatureListsin the mzQuantML file. For each PSM, them/zand RT are matched against eachFeaturein the appropriateFeatureList. Specifi-cally, them/zis tested for a match between the precursor m/zfrom the PSM (mzIdentML) versus them/zof the quan-tifiedFeature(mzQuantML) within a given tolerance. The RT is tested whether it is within the reported RT window width of theFeature. If the mzQuantML file does not contain the RT window but only the RT centroid point, a standard toler-ance window is applied (e.g. defaults to+/– 0.05 Da and+/– 10 sec). Meanwhile, users can also set their own tolerance window.
In the second step, the identifications are propagated up to the level ofPeptideConsensuselements in mzQuantML.
Pep-tideConsensuselements describe peptide/features that have
been mapped as reporting on the same entity for multiple samples/replicates, for example in label-free pipelines fol-lowing RT alignment. The IDMapper populates
PeptideCon-sensuselements with identifications (peptide sequence and
modifications) if at least oneFeaturereferenced from the
Pep-tideConsensushas a mapped identification. In case of conflicts,
i.e. thePeptideConsensusreferences Features in different
Fea-tureListscarrying different peptide identifications, then the
most common identification among theFeatureLists(largest number ofFeatureListscarrying this identification) is assigned to thePeptideConsensus. Any conflicted identifications across
PeptideConsensuselements are flagged in the file, using
user-Paramelements.
2.2.6 Normalisation
The normalisation method we have implemented as the ref-erence method in the mzqLibrary follows the general scheme used in Progenesis LC-MS (http://www.nonlinear.com) for label free global normalisation, based on the assumption that the majority of data points between a reference run and an-other run should be distributed around a log ratio=0.
The routine takes parameters of: the level (peptide, pro-tein or propro-tein group); the type of input QuantLayer (cur-rently onlyAssayQuantLayer supported in version 1.0-beta,
RatioQuantLayerto be supported in later releases); the CV
accession and CV name identifying the data type of the
in-putQuantLayer, e.g. MS:1001893: “Progenesis:peptide raw
abundance”; optionally the identifier of a singleAssayto be
used as reference; a string used to identify any decoy peptides or proteins (so they are excluded from the input to normal-isation); the CV accession and CV name to be assigned to the outputQuantLayer, e.g. MS:1001891: “Progenesis: pep-tide normalised abundance”; and aprocessingLevel, indicating whether only identified peptides should be used for quantita-tion, or all peptides (allpeptideConsensuselements identified and unidentified) – when performing peptide-level normali-sation.
The algorithm proceeds as follows. If noAssayis supplied as the reference run, then the procedure automatically deter-mines the reference to use. This is achieved by using alln
Assaysindependently as the reference run for normalisation
(see below) – to producenvectors of scaling factors, one for each possible reference. The algorithm calculates the stan-dard deviation (stdev) of each vector, and then calculates the median stdev across all vectors. The chosen reference is that which has the stdev closest to the median stdev, to select a reference that is not an outlier and is central in terms of its position with respect to the others.
The normalisation procedure takes either the user-defined referenceAssayor the one automatically calculated, defined asAr here. For each non-referenceAssay An, the following
procedure is applied:
(i) Data is transformed onto a log ratio scale log10(Ar/ An) for
every peptide, protein or protein group value.
(ii) Calculation of median absolute deviation (MAD). Assum-ing the data is normally distributed, the standard coeffi-cient of 1.4826 is applied to the calculated MAD [31]. (iii) Outliers, not within the 95% confidence interval
(calcu-lated as 2, where = 1.4826 MAD), are subsequently removed and steps (ii) and (iii) are repeated until conver-gence.
(iv) Averaging (mean) of the remaining ratio values within the confidence interval is performed to derive a robust single estimate for each assay.
(v) Anti-log transformation of the average yields the scaling factor for this givenAssay.
(vi) The scaling factors obtained from each AssayAnis
mul-tiplied by the data value for every row (peptide, protein or protein group) to create normalised values that are en-coded within a newly createdAssayQuantLayer.
Any “Null”, “NaN” or zero values for abundance are ig-nored for the purposes of the calculation of scaling factors, though retained subsequently.
2.2.7 Protein Abundance Inference
normalisedQuantLayers), the parameters required to produce valid output in terms of CV accessions and CV term names for the new protein group levelQuantLayers, and the math-ematical operation to be performed (sum, mean, median). For label-free quantification, the sum operation is strongly recommended.
The algorithm then performs the following steps. First, a mapping from peptides to proteins is obtained from the input file, and all peptides are classified as either “unique” ping to only a single protein accession), or “common” (map-ping to same-set or subset groups of proteins) [32]. Peptides that are “conflicted” (mapping to multiple protein accessions that have unique peptides) are removed. To achieve this, pro-tein groups are initially seeded from unique peptide-propro-tein mappings generated from theProteinList, and expanded with same-set proteins sharing common peptides. Secondly, pro-tein group abundance is then calculated for both raw peptide abundance and normalised peptide abundance, respectively, using only the unique and common peptides; note, the latter will be unique to the protein group, but not necessarily the protein. A single group leader protein is then selected to rep-resent each group (flagged with CV term “anchor protein”). This will be the single protein in a unique group, the first pro-tein assigned to a same-set group, or the propro-tein associated with the most peptides in a sub-set group. Protein abundance data is then calculated according to the user selected method (sum, mean, median of peptide abundance values) and output as a protein group list in the output mzQuantML file, which includes the protein group information and the
AssayQuant-Layers(e.g. protein group raw abundance and protein group
normalised abundance). More advanced protocols for pro-tein quantification inference (for example weighted averag-ing by different schemes) will be added at a later date. In the current version, “Null” and “NaN” values are replaced with zero values in the calculation of protein abundance from pep-tide abundance, since for the recommended (sum) operation these produce identical results. When support for ratio-based protein aggregation is added, more customisable options will be added for the treatment of missing values.
2.2.8 ANOVAPValue
The routine provides an ANOVA statistical test over two or more groups ofAssays to test for evidence of differen-tial expression. TheANOVAPValue routine calculates the p-value for each protein or protein group and adds an
ex-traGlobalQuantLayer(containing the p-values) to the output
mzQuantML file. The user (or code calling the routine) must specify howAssaysare grouped by providing a listing of As-sayID values, separated by commas, and using semicolon to separate groups. The calling code must also specify a CV ac-cession used to identify theAssayQuantLayercontaining the quantitative values over which the ANOVA will be performed. If there is a “Null” or “NaN” value of protein abundance, the p-value is set to “NaN”. Zeroes in protein abundance are
re-placed with 0.5 as the calculation of p-value is based on log of abundance values, following standard statistical convention [33].
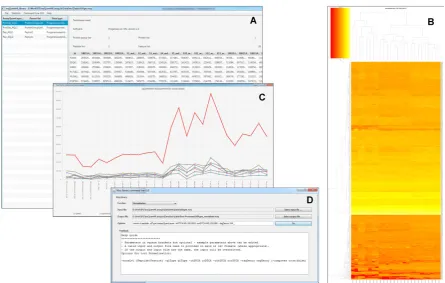
2.2.9 Data visualisations in the mzqViewer
The mzqViewer provides basic viewing functions for mzQuantML files. It displays the metadata of the file, includ-ing the quantitative technique (mode) used in the experiment, the software used to produce the data in the file, the detailed structure of the mzQuantML file (number ofFeatureLists,
Pep-tideConsensusLists,ProteinListsandProteinGroupLists), and the
table of all theAssayQuantLayersin the file. Users can browse the quantitation values in eachAssayQuantLayerand display multiple selected rows in a line plot, for example to show how several proteins or peptides are behaving across differ-ent replicates or samples measured (Fig. 1). The mzqViewer also can call out to R to perform log scaling of all the data within any selected AssayQuantLayer, and generate a heat map which can be viewed in an R window, or saved as a PDF file. The software can also call out to R to generate a PCA on anyAssayQuantLayerselected by the user (peptide or protein quantification values) to determine if individual Assays (for example within replicate groups) are clustering together.
2.3 Use cases for testing the mzqLibrary and mzqViewer
Figure 1. Screenshots of the mzqViewer. (A) The main window for viewing quantitative data within the file and calling other plotting features. (B) A heat map exported from the viewer in PDF format. (C) Line plots of a single protein and its constituent peptides. (D) The basic GUI for calling individual routines within the mzqLibrary.
and a batch file for reproducing our output is available from the project website: https://code.google.com/p/mzq-lib/.
The following processing pipeline was applied to test the functionality of several routines of the mzqLibrary and mzqViewer. Themdx_progen_peptide_raw.mzqfile was analysed by (i) mzqLibrary:ProteinAbundanceInference, (ii) mzqLibrary:Normalisation, (iii) mzqLibrary:ANOVA, (iv) ex-port to mzTab and (v) various visualisations to check the data. The exported results were imported into the R statistical pack-age (version 3.1.1) and compared versus the natively exported Progenesis Protein.csv file, for count of total protein groups quantified, Pearson correlation of log ratios (mdx/wt) and Pearson correlation of ANOVA p-values.
Case 2: as a second test of the mzqLibrary on a sample with a controlled protein content, we analysed the CPTAC Study 6 data set – for details and methods see [35]. In brief, the CPTAC set was created by splitting a single yeast culture into five equal samples (60 ng/uL yeast protein per sample), into which 48 human proteins were spiked at increasing con-centrations (Sigma UPS1 standard at 0.25, 0.74, 2.2, 6.7 and 20 fmol/ul). These samples were designated A–E (A=lowest and E=highest concentration of spiked proteins) and run in triplicates on various MS platforms. The authors of the original study reported that UPS proteins could not be de-tected in the A samples, and thus we analysed B–E samples only. Comparisons of the spike-in concentrations thus sim-ulate “known” ratios, e.g. E/B (27:1); E/C (9:1); E/D (3:1)
against a complex background assumed not to be changing. In previous analyses of this data set on various software pack-ages, we have observed that the spike-in UPS proteins are well controlled in the given ratios, but the yeast background is not optimally controlled at 1:1:1:1 in all conditions and thus the data set is not ideal for full benchmarking of differential expression analysis. Nevertheless, for the purposes intended in this article, i.e. to demonstrate comparable performance of the mzqLibrary reference methods and Progenesis for post-processing, the data set serves as an adequate test case. We performed the same data processing steps (label-free quan-tification in Progenesis; idenquan-tification using Mascot – using the search database and parameters recommended in [35]) and post-processing steps as for Case 1. We additionally used R to generate boxplots of the log2 protein abundance values for mean E (three replicates)/mean B; mean E/mean C and mean E/mean D for the two pipelines.
3
Results and discussion
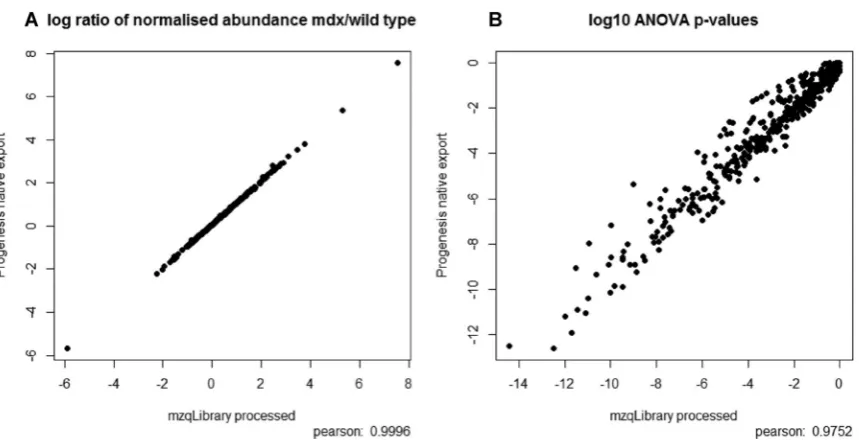
Figure 2. MDX processed data shown as (a) a scatter plot of log2 ratios (mean of mdx/ mean of wt for normalised protein abundance) as produced natively by Progenesis and by mzqLibrary processing, and (b) as a scatter plot of log10(p-values) as derived from an ANOVA test for differential expression on normalised protein abundance values, natively exported from Progenesis and from mzqLibrary processing.
conversion from Progenesis to mzQuantML, using the mzqLibrary to perform peptide to protein quantification, nor-malisation and then ANOVA, using the same set of quantified peptides from Progenesis as the source. We wish to empha-sise that we are not aiming to demonstrate that our modules are superior in performance to Progenesis, simply that they produce broadly the same results, as we are performing rela-tively standard types of routines. The modules are intended to act as reference methods, such that new developments in pro-tein inference, normalisation and statistics can be compared against “standard practice”, potentially as part of a bench-marking study. This is an important point, since quantitative proteomics pipelines consist of multiple steps, and the mzqLi-brary thus provides common routines to support fair compar-isons of individual steps that would otherwise be impossible. It should be noted that for the protein inference step, due to the way in which data are exported from Progenesis, the method can only arrive at the same count of protein groups (Progenesis only exports peptides mapped to a single group leader). As expected, in the two pipelines, the same num-ber of protein group-level quantitation results were reported – 464 in both pipelines. We next performed a scatter plot and Pearson correlation on the log2 ratios of normalised pro-tein abundance of the study groups (mdx/wt), as calculated by the mzqLibrary and exported natively from Progenesis as shown in Fig. 2(a). The majority of the ratios are identical (r2=1), with very minor differences likely due to rounding
errors. We next performed a scatter plot and Pearson corre-lations on the log10 p-values (from ANOVA on normalised protein abundance across study groups) from both pipelines (Fig. 2(b)), which also displayed a high correlationr2=0.97.
The slight differences between the p-values produced by the
two pipelines are presumably due to differences in normalisa-tion, and in particular, the method of selecting the reference run. It is known that ANOVA can be sensitive to alterations in normalisation, and as such, this is likely to explain the differences in p-value observed. Nevertheless, using a cut-off of p-value<0.05 with Bonferroni correction (further dividing the threshold by the number of proteins identified 464), Pro-genesis classifies 121 proteins as differentially expressed and the mzqLibrary classifies 134 – with agreement on 118 of the proteins, indicating that differences in the two pipelines do not fundamentally alter the biological conclusions that would be drawn. We have also tested that the ANOVA routine pro-duces identical results to those produced from Progenesis if provided with the same input data, e.g. protein group quan-titation values converted directly from Progenesis (data not shown).
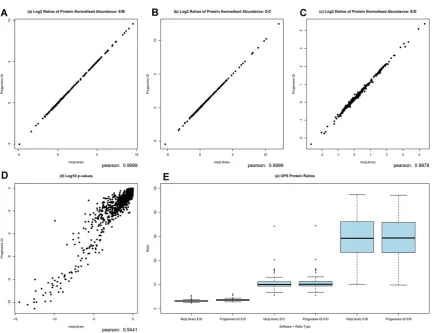
Figure 3. CPTAC processed data shown as a scatter plot of all protein log2 ratios for (a) E/B, (b) E/C and (c) E/D, showing a strong correlation between values derived from both Progenesis and the mzqLibrary. Log10 p-values are shown for proteins (d) from the ANOVA test for differential expression, again indicating a good degree of agreement between values from Progenesis and the mzqLibrary. Finally boxplots are used (e) to show the ratios of UPS proteins for conditions B, C, D against E, from both Progenesis processed data and mzqLibrary processed data.
highly similar results are obtained from post-processing with either the mzqLibrary or Progenesis.
We have also profiled the memory and CPU requirements for analysis of case studies 1 and 2. Only three mzqLibrary routines were applied to our example cases (1 and 2) and their performance metrics are shown in Table 3.
We plan to make further improvements and developments to the mzqLibrary to support open source developers. These developments include incorporating state-of-the-art routines for protein inference, outlier rejection, normalisation and advanced/bespoke statistical tests, as well as support for more complex workflows, for example where pre-fractionation of
Table 2. Counts of proteins passing an ANOVA p-value cut-off of 0.05, with Bonferroni correction (dividing threshold by protein count of 1263) for various categories
Category Protein count
Total proteins passing (ANOVA p-value) threshold from mzqLibrary 109
Total proteins passing (ANOVA p-value) threshold from Progenesis QI 81
Total proteins passing (ANOVA p-value) threshold from both mzqLibrary & Progenesis QI 76
UPS proteins identified in both pipelines 47
UPS proteins passing (ANOVA p-value) threshold from mzqLibrary 44
UPS proteins passing (ANOVA p-value) threshold from Progenesis QI 44
UPS proteins passing (ANOVA p-value) threshold from both mzqLibrary & Progenesis QI 44
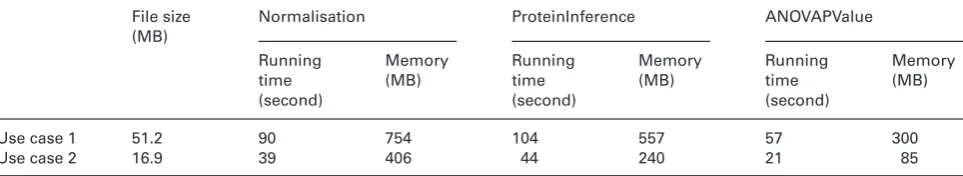
[image:9.595.62.538.592.687.2]Table 3. The performance metrics of the mzqLibrary in terms of speed and memory usage of each use case for three mzqLibrary routines (i.e. Normalisation, ProteinInference and ANOVAPValue)
File size (MB)
Normalisation ProteinInference ANOVAPValue
Running time (second)
Memory (MB)
Running time (second)
Memory (MB)
Running time (second)
Memory (MB)
Use case 1 51.2 90 754 104 557 57 300
Use case 2 16.9 39 406 44 240 21 85
The “File size” is measured from the input mzq file before normalisation routine of each case. The “Running time” and “Memory” values
are measured using JProfiler (version 8, https://www.ej-technologies.com/products/jprofiler/overview.html) on a PC with XeonR E5-2630
v2 2.6GHz 2.6GHz CPU and 32GB RAM.
proteins has occurred. We welcome feedback on the library, and will endeavour to work with external groups to incorpo-rate modules and libraries requested.
4
Concluding remarks
We anticipate that the release of the mzqLibrary will make it simpler for the following tasks to be performed. First, through the inclusion of converters from Progenesis LC-MS (and Progenesis QI), MaxQuant and OpenMS, it will be more straightforward for bioinformatics groups to compare and benchmark multiple software packages for label-free analysis, using the same methods (in the mzqLibrary) downstream of feature detection and alignment, thus removing variability in these steps. Second, the mzqLibrary should help bioinformat-ics groups wishing to develop new algorithms for individual analysis steps to construct complete pipelines to benchmark their tools. Third, the provision of the mzqViewer should help both bioinformaticians and lab-based scientists to visu-alise and understand their data. Lastly, the two tools used in combination should help groups to prepare quantitative data in PSI standard format (mzQuantML or mzTab) for sub-mission to PRIDE/ProteomeXchange [29] in support of pub-lished studies.
We gratefully acknowledge funding that has supported this work, including grants from BBSRC [BB/I00095X/ 1,BB/I000631/1] to ARJ, SJH, CB and Henning Hermjakob from the EBI (HH), [BB/K01997X/1] to ARJ and HH and EU FP7 grant ProteomeXchange (grant no. 260558). We would also like to thank Prof Rob Beynon and the Centre for Proteome Re-search at the University of Liverpool for assistance in the label free proteomics analysis.
The authors have declared no conflict of interest.
5
References
[1] Taylor, C. F., Paton, N. W., Lilley, K. S., Binz, P.-A. et al., The minimum information about a proteomics experiment
(MI-APE).Nat. Biotech.2007,25, 887–893.
[2] Binz, P.-A., Barkovich, R., Beavis, R. C., Creasy, D. et al., Guidelines for reporting the use of mass
spectrome-try informatics in proteomics. Nat. Biotech. 2008, 26,
862–862.
[3] Domann, P. J., Akashi, S., Barbas, C., Huang, L. et al., Guide-lines for reporting the use of capillary electrophoresis in
pro-teomics.Nat. Biotech.2010,28, 654–655.
[4] Gibson, F., Anderson, L., Babnigg, G., Baker, M. et al., Guide-lines for reporting the use of gel electrophoresis in
pro-teomics.Nat. Biotech.2008,26, 863–864.
[5] Hoogland, C., O’Gorman, M., Bogard, P., Gibson, F. et al., Guidelines for reporting the use of gel image informatics in
proteomics.Nat. Biotech.2010,28, 655–656.
[6] Jones, A. R., Carroll, K., Knight, D., MacLellan, K. et al., Guide-lines for reporting the use of column chromatography in
pro-teomics.Nat. Biotech.2010,28, 654–654.
[7] Martinez-Bartolome, S., Deutsch, E. W., Binz, P. A., Jones, A. R. et al., Guidelines for reporting quantitative mass
spec-trometry based experiments in proteomics.J. Proteomics
2013,95, 84–88.
[8] Taylor, C. F., Binz, P.-A., Aebersold, R., Affolter, M. et al., Guidelines for reporting the use of mass spectrometry in
proteomics.Nat. Biotech.2008,26, 860–861.
[9] Martens, L., Chambers, M., Sturm, M., Kessner,
D. et al., mzML—a Community Standard for Mass
Spectrometry Data. Mol. Cell. Proteomics 2011, 10,
R110.000133.
[10] Jones, A. R., Eisenacher, M., Mayer, G., Kohlbacher, O. et al., The mzIdentML data standard for mass
spectrometry-based proteomics results.Mol. Cell. Proteomics2012,11,
M111.014381.
[11] Walzer, M., Qi, D., Mayer, G., Uszkoreit, J. et al., The mzQuantML data standard for mass spectrometry-based
quantitative studies in proteomics. Mol. Cell. Proteomics
2013,12, 2332–2340.
[12] Griss, J., Jones, A. R., Sachsenberg, T., Walzer, M. et al., The mzTab Data Exchange Format: communicating MS-based proteomics and metabolomics experimental results to a
wider audience.Mol. Cell. Proteomics2014,13, 2765–2775.
[13] Mayer, G., Montecchi-Palazzi, L., Ovelleiro, D., Jones, A. R. et al., The HUPO proteomics standards
initiative-mass spectrometry controlled vocabulary.Database2013,
[14] Montecchi-Palazzi, L., Kerrien, S., Reisinger, F., Aranda, B. et al., The PSI semantic validator: A framework to check
MIAPE compliance of proteomics data.Proteomics2009,9,
5112–5119.
[15] Qi, D., Lawless, C., Teleman, J., Levander, F. et al., The representation of selected-reaction monitoring data in the
mzQuantML data standard.Proteomics2015,under review.
[16] Qi, D., Krishna, R., Jones, A. R., The jmzQuantML program-ming interface and validator for the mzQuantML data
stan-dard.Proteomics2014,14, 685–688.
[17] Gonzalez-Galarza, F. F., Lawless, C., Hubbard, S. J., Herm-jakob, H., Jones, A. R., A critical appraisal of techniques, software packages and standards for quantitative proteomic
analysis.OMICS2012,16, 431–442.
[18] Cox, J., Mann, M., MaxQuant enables high peptide identi-fication rates, individualized p.p.b.-range mass accuracies
and proteome-wide protein quantification.Nat. Biotechnol.
2008,26, 1367–1372.
[19] Choi, M., Chang, C. Y., Clough, T., Broudy, D. et al., MSstats: an R package for statistical analysis of quantitative mass
spectrometry-based proteomic experiments.Bioinformatics
2014,30, 2524–2526.
[20] Karpievitch, Y., Dabney, A., Smith, R., Normalization and
missing value imputation for label-free LC-MS analysis.BMC
Bioinformatics2012,13, S5.
[21] Choi, H., Nesvizhskii, A. I., Semisupervised Model-Based Validation of Peptide Identifications in Mass
Spectrometry-Based Proteomics.J. Proteome Res.2008,7, 254–265.
[22] Taverner, T., Karpievitch, Y. V., Polpitiya, A. D., Brown, J. N. et al., DanteR: an extensible R-based tool for quantitative
analysis of -omics data.Bioinformatics2012,28, 2404–2406.
[23] Deutsch, E. W., Mendoza, L., Shteynberg, D., Slagel, J. et al., Trans-Proteomic Pipeline, a standardized data processing pipeline for large-scale reproducible proteomics informatics. Proteomics Clin. Appl.2015, DOI 10.1002/prca.201400164. [24] Xu, Q.-W., Griss, J., Wang, R., Jones, A. R. et al., jmzTab: a
Java interface to the mzTab data standard.Proteomics2014,
14, 1328–1332.
[25] Qi, D., Brownridge, P., Beynon, R. J., Xia, D. et al., A software toolkit and interface for performing stable isotope labelling
and top3 quantification using Progenesis LC-MS. OMICS
2012,16, 489–495.
[26] Goecks, J., Nekrutenko, A., Taylor, J., The Galaxy, T., Galaxy: a comprehensive approach for supporting accessible, repro-ducible, and transparent computational research in the life
sciences.Genome Biol.2010,11, R86.
[27] Cox, J., Mann, M., MaxQuant enables high peptide identi-fication rates, individualized p.p.b.-range mass accuracies
and proteome-wide protein quantification.Nat. Biotechnol.
2008,26, 1367–1372.
[28] Sturm, M., Bertsch, A., Gropl, C., Hildebrandt, A.
et al., OpenMS - an open-source software framework
for mass spectrometry. BMC Bioinformatics 2008, 9,
163.
[29] Vizcaino, J. A., Deutsch, E. W., Wang, R., Csordas, A. et al., ProteomeXchange provides globally coordinated
pro-teomics data submission and dissemination.Nat.
Biotech-nol.2014,32, 223–226.
[30] Ghali, F., Krishna, R., Lukasse, P., Mart´ınez-Bartolom ´e, S. et al., Tools (Viewer, Library and Validator) that facilitate use of the peptide and protein identification standard
for-mat, termed mzIdentML. Mol. Cell. Proteomics 2013, 12,
3026–3035.
[31] Hampel, F. R., The influence curve and its role in robust
esti-mation.J. Am. Stat. Assoc.1974,69, 383–393.
[32] Nesvizhskii, A. I., Aebersold, R., Interpretation of shotgun
proteomic data: the protein inference problem.Mol. Cell.
Proteomics2005,4, 1419–1440.
[33] McDonald, J. H.,Handbook of Biological Statistics, Sparky
House Publishing, Baltimore , Maryland 2014.
[34] Mercuri, E., Muntoni, F., Muscular dystrophies.Lancet2013,
381, 845–860.
[35] Paulovich, A. G., Billheimer, D., Ham, A. J., Vega-Montoto, L. J. et al., A CPTAC inter-laboratory study characterizing a yeast performance standard for benchmarking LC-MS