promoting access to White Rose research papers
White Rose Research Online
Universities of Leeds, Sheffield and York
http://eprints.whiterose.ac.uk/
This is an author produced version of a paper published in Journal of Chemical Physics.
White Rose Research Online URL for this paper: http://eprints.whiterose.ac.uk/3931/
Published paper
Blanchet, V., Raffael, K., Turri, G., Chatel, B., Girard, B., Garcia, I.A., Wilkinson, I. and Whitaker, B.J. (2008) Time-dependent photoionization of azulene: Competition between ionization and relaxation in highly excited states,Journal of Chemical Physics, Volume 128 (16), 164318.
Time-dependent photoionization of azulene.
Competition between ionization and relaxation in highly excited states
Valérie Blanchet, Kevin Raffael, Giorgio Turri, Béatrice Chatel, Bertrand Girard
Laboratoire Collisions Agrégats Réactivité (UMR 5589, CNRS -Université de Toulouse, UPS), Institut de Recherches sur les Systèmes Atomiques et Moléculaires Complexes, France
and
Ivan Anton Garcia, Iain Wilkinson , Benjamin J Whitaker
School of Chemistry, University of Leeds, Leeds, LS2 9JT, United Kingdom
Correspondence should be addressed to V.B. (e-mail: val@irsamc.ups-tlse.fr)
ABSTRACT
Pump-probe photoionization has been used to map the relaxation processes taking place
from highly vibrationally excited levels of the S2 state of azulene, populated directly or via internal
conversion from the S4 state. Photoelectron spectra obtained by 1+2’ two-color time-resolved
photoelectron imaging are invariant (apart from in intensity) to the pump-probe time delay and to
pump wavelength. This reveals a photoionization process which is driven by an unstable electronic
state (e.g. doubly excited state) lying below the ionization potential. This state is postulated to be
populated by a probe transition from S2 and to rapidly relax via an Auger like process onto highly
vibrationally excited Rydberg states. This accounts for the time invariance of the photoelectron
spectrum. The intensity of the photoelectron spectrum is proportional to the population in S2. An
exponential energy gap law is used to describe the internal conversion rate from S2 to S0. The
vibronic coupling strength is found to be larger than 60±5 µeV.
PACS: 07.77.Gx, 31.10.+z, 31.70.Hq, 33.00.00, 82.53.-k
Keywords: azulene, time resolved photoelectron imaging, excited state dynamics, doubly excited
state.
I. INTRODUCTION
The electronic structure of azulene is noteworthy due to the atypical fluorescence which
occurs from the second excited S2(2 )A1 state, instead of the lower S B1(1 )2 excited state. As such, it
is well known as the textbook exception to Kasha’s rule that “the emitting level of a given
multiplicity is the lowest excited level of that multiplicity”.1 Little is known about the higher electronic valence states,2-4 other than their use as stepping-stones through which to prepare highly excited molecules in order to observe the unimolecular dynamics of the molecule.5,6
Azulene is a planar asymmetric top molecule that belongs to the C2v point group (see Figure 1).
There are four distinct regions in the absorption spectrum of the molecule; 700-500 nm, 350-310
nm, 290-260 nm, and 240-200 nm with relative oscillator strengths 0.01, 0.06, 1, and 0.4 (see Table
1). The S2(2 )A1 ←S0(1 )A1 and the S4(3 )A1 ←S0(1 )A1 absorptions are optically allowed with an
electric dipole transition moment along the z axis. TheS B1(1 )2 ←S0(1 )A1 and
3(2 )2 0(1 )1
S B ←S A transitions are y polarized. Like the S B1(1 )2 ←S0(1 )A1 transition the
2(2 )1 0(1 )1
S A ←S A transition is characterized by the creation of double bond type character on the
transannular connection. Early fluorescence quantum yield experiments suggested long lifetimes7
for single vibrational levels in S2 and sub-picosecond ones for the S3 and S4 levels.2 The 2-3 ns
lifetimes of the S2 vibrational levels were later confirmed by picosecond-resolved quantum beat
experiments.8,9 Intriguingly, Diau et al.10 observed an additional fast exponential component in the ion time-profile in two colour photoionization experiments, with a 350 fs decay on the top of the
long decay component when exciting the S2 state with 470 meV excess vibrational energy. We have
performed time resolved pump-probe photoionization and photoelectron spectroscopy via the
electronically excited states (S2 to S4) of azulene. At all the wavelengths studied here the transient
signals exhibit two distinct and well-defined behaviours: (i) Short-term (on the order of a
internal conversion from S2 to S0 and treated via a statistical model, and focus principally on the
photoionization processes occuring within the electronically excited states of azulene.
Although for most of our experiments a 1+1’ photoionization process is energetically
allowed, we will present a series of converging arguments to conclude that the photoionization
actually proceeds via a complex (1+2’) mechanism with fast internal conversion taking place within
the probe pulse. To elucidate this photoionization mechanism we have measured pump-probe (263 -
295 nm / 400 nm) signals on the parent photoion and also recorded photoelectron spectra; with both
one-colour (258 and 266 nm) and two colour (268 - 335 nm / 400 nm) ionization schemes.
Although the ionization mechanism is indubitably complicated, we will present evidence suggesting
that the phenomena we are observing may be quite generic in polycyclic molecules.
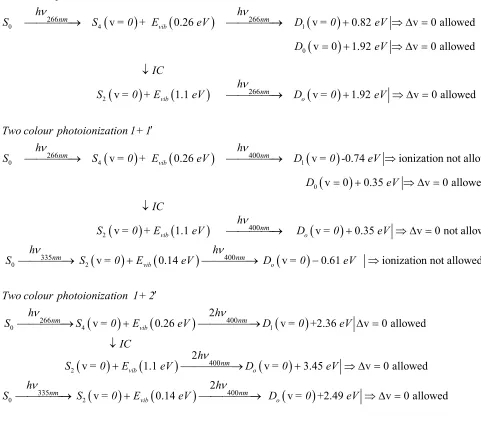
Figure 1 provides a framework for the forthcoming discussion. It depicts a number of
possible excitation and ionization paths. Fig 1.1 is a schematic of the one-colour two photon
ionization process and Fig 1.2 and 1.3 are those of the two-colour photoionization processes. Each
electronically excited state can be either directly excited/ionized (paths (a) and (c)) or each can first
decay to a lower electronic state by vibronic coupling before being ionized (paths (b) and (d-e)). In
this latter case two probe photons are necessary to ionize the molecule due to the large amount of
vibrational energy in the lower lying states. In the two-colour photoionization schemes, at least one
(resonant or non-resonant) intermediate state mediates the transition. In the resonant case, this
intermediate state can be directly ionized (path (d)) or it can relax towards another electronic state if
its lifetime is shorter than the probe pulse duration (path (e)).
In this paper we will examine successively: Koopmans’ type correlations in the S2 and S4
electronic states12 via the one-colour photoelectron spectrum, the evidence for the presence of a doubly excited electronic state involved in the photoionization via the two-colour time-resolved
photoelectron spectroscopy and its relaxation onto Rydberg states. Finally we complete this study
with a statistical approach to describe thelong decay component and the coupling between the S2
II EXPERIMENTAL DETAILS
Experiments were performed in our two laboratories using similar instruments. We describe
here the experiment in Toulouse in detail and then point out any significant differences between the
two set-ups. We employ pump-probe time-of-flight (TOF) mass-spectrometry to detect the
photoions and velocity map imaging to record the photoelectrons spectra.13
Both pump and probe pulses were generated from a master 1 kHz 2.5 mJ regenerative
amplifier centred at ~805 nm and delivering a pulse with a Fourier limited Full-Width at Half
Maximum (FWHM) of ~60 fs (Amplitude Systems). A home-made non-collinear optical parametric
amplifier (NOPA),14 pumped with a fraction of the frequency doubled output of the Ti:sapphire amplifier, with subsequent second harmonic generation provided the ultraviolet (UV) pump pulse.
The NOPA output was partly recompressed by a prism pair. The typical FWHM of the pump pulse
in energy was 30-50 meV corresponding to a Fourier limit of 35-60 fs. For most of the experiments
reported here the probe pulse, at ~403 nm, was obtained by second harmonic generation (SHG) of
the fundamental output of the regenerative amplifier. The cross-correlation between the pump and
probe pulses, recorded by off-resonant multiphoton ionization of nitric oxide, had a typical 120 fs
FWHM. Pump and probe beams were combined at a small angle (~1°) and focused onto the
molecular beam by a 750 mm focal length spherical aluminium mirror. In order to reduce
multiphoton effects, such as dissocitative ionization, the typical energies used were <1 µJ for the
pump pulse and ~15 µJ for the probe pulse. The pulse-to-pulse stability was better than 85% for
both pump and probe beams. The dimensions of the two beams were measured at their spatial
overlap, from which we deduce intensities of ~3.0 1010 W/cm2 for the pump pulse and ~2.0 1011 W/cm2 for the probe pulse. These intensities correspond to an insignificant ponderomotive potential of a few meV. We are therefore confident that multiphoton ionization takes place in an unperturbed
energy scheme.15
The set-up in Leeds is very similar except that the regenerative amplifier (Clark MXR 2010)
harmonics that are used for the probe and pump fields are slightly shifted from those used in
Toulouse: 387 and 258 nm (Leeds), 403 and 269 nm (Toulouse). In addition a Nd:YAG pumped
dye laser (Continuum Surelite/Sirah) was used in the Leeds apparatus to obtain photoelectron
images on the nanosecond time-scale. For this experiment the third harmonic of one Nd:YAG laser
was used to pump a dye (Exalite 404) to generate tunable light close to 400 nm. The line width of
the dye laser was 0.1 cm-1 with a typical pulse energy kept below 3 mJ to avoid fragmentation. In all of the experiments reported below every signal has been recorded with parallel laser
polarisation.
Azulene molecules (Aldrich, 99% without further purification) were sublimed continuously
at 340 K with 150 Torr of nitrogen and then expanded through a 200 µm diameter nozzle. The
resulting molecular beam was collimated by a 1 mm diameter skimmer before it intersected,
perpendicularly, the focused laser beams. The resulting ions and photoelectrons were subsequently
detected at the output of a 40 cm time-of-flight velocity map imaging spectrometer whose axis is
perpendicular to the plane defined by the lasers and molecular beam.13 The azulene sublimed cleanly without evidence of decomposition in the ion mass spectrum observed with either pump or
probe laser alone. We were unable to detect any trace of van der Waals clusters such as azulene-N2
or (azulene)n in the mass spectrum under these expansion conditions.16,17
For each pump-probe delay, the ion signal was averaged over ~2000 laser pulses and the
photoelectron image over ~4×10⁵ laser pulses. The images were calibrated by recording photoelectron signals from nitric oxide, acetylene and oxygen at various accelerating and focussing
voltages. Typically the detection window spanned 0.1 to 3.5 eV with a resolution of 65 meV at 1.4
eV (for a repeller voltage of -3kV and an extractor to repeller voltage ratio of 0.735.13). The 5% energy resolution achieved corresponds to the laser bandwidth.
III RESULTS AND DISCUSSION
Figure 2 shows the typical monoexponential decay of the parent C10H8+ ion recorded for two
pump wavelengths respectively falling within the S0-S4 (λpump=268 nm) and S0-S3 (λpump=293 nm)
absorption bands. A monoexponential picosecond decay has been observed for all the pump
wavelengths investigated between 258 and 293 nm. In these experiments the probe pulse is the
second harmonic of the laser chain, namely 403 nm, for all pump wavelengths except 258 nm where
the probe wavelength was 387 nm. This detection scheme corresponds to paths (c-e) in Figure 1.
The pump photon energy in these data spans the absorption range of the S3 and S4 electronic
states (see Table 1),2 but is always below the photodissociation threshold18 or the isomerization barrier to naphtalene.5,19 The decay time decreases with increasing excitation energy but is greater
than 30 ps even for the highest energy studied, ~5 eV. These would be remarkably long lifetimes
for such high lying electronic states and would not be consistent with the broad features observed in
the jet-cooled fluorescence excitation spectra of the S3 and S4 states.2 From the spectral profiles
Fujii et al.2 suggested that the S3 and S4 states were efficiently coupled to the S2 state and this was
later confirmed by Lawrance and Knight by pump-probe spectroscopy.20
In order to assign the non-radiative processes related to the decay times shown in Figure 2
and, in particular, to evaluate the relative contributions from paths (c) and (d) to the observed ion
transients we investigated photoelectron spectra, as described below.
B - One-colour photoelectron spectra
The signature of the S4 or S3 states via photoionization has never been detected. Indeed, the 1+1
photoelectron spectrum recorded at the origin of the S4 band with an 8 ps pulse results in a single
photoelectron peak from the S2 electronic state, and is correlated to the cation ground state via a
v 0
∆ ≈ propensity rule.21 This is indicative of efficient internal conversion from the initially pumped vibrationless level of the S4 state onto S2, as depicted by path (b) in Fig.1. A similar
propensity to preserve the vibrational quantum state upon photoionization from S2 was observed in
vibrational levels of S2.17 These experiments show that, on the picosecond timescale, the prevailing
contribution to the molecular eigenstates underlying the electronic absorption spectrum around the
S4 electronic origin comes from S2. The same conclusion can be drawn from similar experiments
performed close to the origin of the S3 state.21 On the picosecond timescale, no clear signature of
photoionization to D1 is observed even though this photoionization route is energetically allowed.
The observation of a ∆ ≈v 0 propensity rule suggests that the S2 and cation ground states should
have a similar geometry.
In order to detect the S4 signature via photoionization, we performed the same experiment
but with 120 fs pulses. The photoelectron spectrum was recorded for two different wavelengths
(258 nm and 266 nm) in which the total two-photon energy (9.61 and 9.32 eV respectively) was
sufficient to photoionise azulene to the cationic ground state, D0 (7.41 eV), or the first excited state
of the ion, D1 (8.50eV), but not to the second excited state D2 (10.07 eV) (see Table 1).17,22
Figure 3 shows that there are at least two thresholds on the photoelectron spectrum at both
wavelengths. The vibrational energy in S2 is 1.24 eV at 258 nm and 1.10 eV at 266 nm. Assuming
the same ∆ ≈v 0 propensity rule onto D0 observed by Weber and Thantu,21 the photoelectron
spectra would be anticipated to peak at 0.96 eV and 0.81 eV for the two excitation wavelengths
respectively. But, as can be seen in Figure 3, there are no obvious discrete peaks appearing at these
energies. Instead, the large rising features around 1.11 and 0.82 eV fit exactly the ionization
threshold onto the D1 ion state. It seems that on the timescale of a few tens of femtoseconds
ionization to D1 is favoured, in marked contrast to what is observed on the picosecond timescale.
The vibrational energy in the S4 state is respectively 0.26 eV at 266 nm and 0.4 eV for a pulse
centred at 258 nm.2 For 266 nm excitation, the photoelectron spectrum peaks at 0.55 eV, corresponding to a vibrational energy in D1 of 0.27 eV. This agrees perfectly with photoionization
onto D1 governed by a ∆ ≈v 0 propensity rule, but this time occurring out of the S4 electronic state.
The same ∆ ≈v 0 propensity rule applied at 258 nm should lead to a photoelectron spectrum
channel (lying from 1.9 to 0.9 eV on Fig. 3 for the 266 nm photoionization case) is formed with
very little vibrational selectivity; the tail spreads over more than 1 eV. This can be tentatively
assigned to a growing contribution of the S2 electronic state in the one-photon resonance over the
120 fs pulse duration. For both wavelengths, the very low energy components could correspond to
an autoionization process. On a timescale of 8 ps, the population created in S4 has completely
relaxed to S2. Consequently, photoionization to D0 with a ∆v~0 propensity rule is the only signature
observed in the photoelectron spectrum. In contrast, when the experiment is performed on the fs
scale, a significant contribution of the photoelectron signal arises from ionization of the S4 state,
since photoioization takes place on a timescale commensurate with internal conversion. These
observations set an upper limit certainly lower than 8 ps for the S3 and S4 states lifetimes. The
two-colour experiment discussed in part C will fix a new upper limit to 120 fs. In conclusion,
photoionization can be driven simply by ∆ ≈v 0 transitions to D1 from the S4 state and to D0 from
the S2 state.
C – Two Colour photoelectron spectra
Having identified the S4 contribution to the total photoionization cross-section, the non-radiative
processes related to the decay times of Figure 2 might be assigned by time-resolved photoelectron
spectroscopy. Note that in the two-colour experiments the probe pulse is centered around 400 nm,
so it is useful to compare the ∆ ≈v 0 propensity rule observed in 1+1 photoionization (at 266 nm)
(
)
(
)
(
)
(
)
(
)
(
)
(
)
0 4 1
0
2
266 266
266
v 0.26 v 0.82 v 0 allowed
v 0 1.92 v 0 allowed
v 1.1 v 1.92 v 0 allowed
vib
vib o
nm nm
nm One colour photoionization 1+1
h h
S S = 0 + E eV D = 0 eV
D eV
IC
h
S = 0 + E eV D = 0 eV
Two colour ν ν ν → → + ⇒ ∆ = = + ⇒ ∆ = ↓ → + ⇒ ∆ =
(
)
(
)
(
)
(
)
(
)
(
)
(
)
0 4 1
0 2 0 266 400 400 33
v 0.26 v -0.74 ionization not allowed
v 0 0.35 v 0 allowed
v 1.1 v 0.35 v 0 not allowed vib vib o nm nm nm photoionization 1+1 h h
S S = 0 + E eV D = 0 eV
D eV
IC
h
S = 0 + E eV D = 0 eV
h S ν ν ν ν ′ → → ⇒ = + ⇒ ∆ = ↓ → + ⇒ ∆ =
(
)
(
)
(
)
(
)
(
)
(
)
20 4 1
5 400
266 400
v 0.14 v 0.61 ionization not allowed
2
v 0.26 v +2.36 v 0 allowed
vib o vib nm nm nm nm h
S = 0 E eV D = 0 eV
Two colour photoionization 1+ 2
h h
S S = 0 E eV D = 0 eV
ν ν ν → + → − ⇒ ′ → + → ∆ =
(
)
(
)
(
)
(
)
(
)
(
)
2 0 2 400 335 400 2v 1.1 v 3.45 v 0 allowed 2
v 0.14 v +2.49 v 0 allowed
vib o vib o nm nm nm IC h
S = 0 E eV D = 0 eV
h h
S S = 0 E eV D = 0 eV
ν
ν ν
↓
+ → + ⇒ ∆ =
→ + → ⇒ ∆ =
With a 400 nm probe 1+1’ photoionization onto D0 is energetically only allowed for pump
wavelengths shorter than 287.5 nm. Photoionization onto D1 or D2 requires two probe photons for
all the pump wavelengths studied. Taking into account the pump wavelength range and the resulting
vibrational energy in the S2 state, one-photon ionization at 400 nm can never satisfy the ∆ ≈v 0
propensity rule. Consequently, two-photon ionization is expected to compete very efficiently with
[image:10.595.56.537.96.517.2]one-photon ionization.
Figure 4a shows the photoelectron spectra recorded at a 1 ps delay for various pump
wavelengths. Surprisingly, the photoelectron spectrum does not depend on the excitation
very slow photoelectron (<200 meV) contribution assigned to the 1+1’ route is significantly
reduced at 335 nm where photoionization can only take place via a 1+2’ scheme. As expected,
photoionization is strongly dominated by the 2-photon transition. This is further supported by the
laser power dependence of the parent ion signal, which was found to be linear in the pump intensity
and quadratic in the probe intensity. If the same ∆ ≈v 0 propensity rule as observed in Fig. 3 is
applied for two-photon ionization at 400 nm, the photoelectron correlated with D1 from S4 on
excitation at 266 nm should appear at a kinetic energy around 2.1 eV. There is no component at any
delay that appears around this kinetic energy. Indeed, the most striking feature is the similarity
between the photoelectron spectra for excitation to various internal energies in S4 (λpump = 268 nm,
275.5 nm and 283 nm) and the one recorded from the S2 (λpump =335 nm) state. The invariance of
the photoelectron spectra to excitation energy and pump-probe delay can only be rationalized if the
two-photon probe ionization occurs out of the same electronic state for all of the pump energies
studied. The obvious candidate is the S2 state since it is the only state to have a sufficiently long
radiative lifetime to be compatible with the long decay times shown in Fig. 2.
Our time resolution is evidently not sufficient to detect the transition between ionization
from S4 and from S2 via any variation of the photoelectron spectrum, so we can conclude that the
internal conversion between S4 and S2 is faster than 120 fs. Once in the S2 state the population can
convert further to highly vibrationally excited levels in S1 and S0. We will examine this internal
conversion, which occurs over a timescale of more than 60 ps in section D. The two-colour
photoionization takes place via path (d) and/or (e) of Figure 1.
As we have noted, apart from its relative intensity, the photoelectron energy spectrum is
invariant to the pump photon excitation energy. The photoelectron spectra in Figure 4a are also
highly structured. At first sight, it is tempting to identify this structure as a signature of the
vibrational structure of the ion but this hypothesis must be immediately rejected. Indeed this pattern
spreads over more than 1.5 eV with a splitting varying around 500 meV. Given the large variation
(smaller than 0.2 eV),23 it is difficult to assign the photoelectron pattern of Figure 4a to a vibrational progression. In fact, we will now show that this photoelectron spectrum is the signature of
two-photon transitions via vibrationally excited Rydberg states.
Consider a Rydberg state lying at an electronic energy Rn, reached after absorption of one
probe photon. Energy conservation gives
pump probe vibn
R n
R E
ω + ω = + (1)
where R vib
E is the vibrational energy in the Rydberg state. If the molecule absorbs a second probe
photon and ionizes, the ejected photoelectron will have a kinetic energy given by:24
(
)
ionkine pump probe probe vib
E = ω + ω + ω −E −IP (2)
Introducing the binding energy n
b n
E =IP R− of the Rydberg state relative to the IP to which it
converges, and assuming the propensity rule ∆ ≈v 0 in the ionization step (on Franck-Condon
arguments between the Rydberg states and the cation) so that ion vibn vib
R
E ≈E , we get:
kin probe
e n
b
E = ω −E (3)
which demonstrates that, within such an ionization scheme, the kinetic energy distribution of the
photoelectron spectrum does not depend on the pump wavelength but only on the Rydberg state
binding energy and on the probe wavelength. This invariance is mainly due to the conservation of
vibrational energy in the Rydberg states through the photoionization, as represented on Figure 1.2.
Such behaviour has been observed previously in the phototoelectron spectra of other
aromatic systems obtained with short optical pulses.25,26 The bandwidth of the observed
photoelectron bands is relatively narrow (around 200 meV) compared to the few eV of vibrational
excitation in these Rydberg states. This is another signature of photoionization taking place via a
vibrational propensity rule ∆ ≈v 0, and further supports the assignment of the intermediate levels to
Rydberg states in the resonantly induced 2-photon ionization. The binding energy with respect to D0
are used to define the top axis of Figure 4a. These Rydberg states have previously been observed by
paper, the authors suggest that the Rydberg states are optically dark states populated by ultrafast
internal conversion from an optically bright superexcited state (SES) of short lifetime.28,29 A few of the Rydberg states of azulene have been detected directly by absorption spectroscopy30,31 and by multiphoton ionization.26,27 In the MPI studies by Weber et al.,26,27 no assumption was made as to which limit the Rydberg states were converging to. Therefore, in order to compare our results to
these previous data, the Rydberg states are listed in Table 1 as a function of their binding energies;
their absolute electronic energies are obtained by assuming a common convergence limit to D0.
Weber et al. deduce the electronic symmetry of the Rydberg states on the basis of the quantum
defect value extracted from their analysis (close to 1 for a s orbitals, 0.3-0.5 for p orbitals, and <0.1
for higher angular momentum states). Using the same arguments, the calculated quantum defects
are listed on top of each contribution in Figure 4a. The binding energies extracted from Figure 4a
are in good agreement with the known spectroscopy of the Rydberg states in azulene.26,27,30,31 Based on the relative agreement with the absorption spectroscopy by Lewis et al.,31 we cautiously conclude that most of the Rydberg states observed in Fig. 4a converge onto D0, but this statement is
amenable to further confirmation.
The remaining question is: does the photoionization from S2 take place via an optical
resonance with the Rydberg states (path (d) in Fig. 1) or via some other state that relaxes to
Rydberg states (path (e)) as proposed by Weber? The general concept of a “superexcited state”
defines a neutral state higher than the ionization potential with two-electron holes or an inner-shell
electron.32 Detailed experimental and theoretical data on the ionization of azulene are scarce,21,22,33,34 but the onset of shake-up ion states has been calculated by Deleuze to lie at quite
low excitation energies, around 9.6 eV with a dominant configuration corresponding to
( ) ( ) ( ) ( ) ( ) ( ) ( )
2 2 2 2 0 0 11 1 2 1 2 1 2
... 1b 2b 1a 3b 2a 4b 3a .33 Any neutral state converging to this cation state is
likely to be a SES. The presence of a doubly excited state lying at an energy as low as 4.95 eV has
been detected by magnetic circular dichroism (MCD) on different derivatives of azulene.24 This
such a state are very similar to a SES. Now we will demonstrate why the photoelectron spectra of
Fig. 4a lead us to propose a photoionization scheme corresponding to path (e) in Fig. 1.
If a progression of the Rydberg states involved in the time-resolved photoionization scheme
(presented in Fig. 4a) converge to D0, they will share the geometry of the cationic state.
Consequently, transitions from S2 to this subset of Rydberg states should also follow the ∆ ≈v 0
propensity, since S2 is also parallel to D0.17,21 At a fixed probe energy, such a propensity rule might
be satisfied for one of the Rydberg states but it is very unlikely to be satisfied for all of them over
the implemented pump energy range. The invariance of the Rydberg features observed in the
photoelectron spectra to the pump wavelength therefore implies that D0 Rydberg states must be
populated via an intermediate state with a different geometry to S2 and D0. Furthermore this
intermediate state must couple to such a D0 Rydberg progression via internal conversion on the
timescale of the probe pulse. Once populated the Rydberg states are photoionized by a subsequent
probe photon. Since the combined energy of one pump and one probe photon for λpump>287.5 nm is
below the ionization threshold to D0, the excited state in question is most likely an unstable double
hole state with very diffuse electronic orbitals. The natural decay should then occur by an Auger
like process, namely by filling the unoccupied lower molecular orbital with the resulting excess
energy balanced by the ejection of an electron. Since this excited state lies below the ionization
threshold, the energy required to expel the electron is not available. Nevertheless, states with an
appropriate electronic configuration and an equivalent energy are present, the states being the
Rydberg series converging to D0. The instability of a doubly excited state would result in efficient
and extremely fast internal conversion with respect to the probe pulse duration. Note that this
process would be independent of the vibrational energy in this double hole state, and this would
rationalize the independence of the Rydberg fingerprint to the vibrational energy in the S2 manifold.
This two-photon ionization channel (path(e)) would also be strongly favoured because of inefficient
Franck-Condon factors from S2 onto D0 (path(d)) as a result of insufficient energy to achieve
photoelectron spectra (Fig. 4a) is the prominent contribution of the Rydberg states with larger
binding energy whatever the vibrational energy of the S2 state. This unexpected invariance over the
studied 1 eV pump energy range,28,35 might be rationalized by an intermediate excited state originating at low electronic energy but populated with a large vibrational energy. This would be
consistent with the doubly excited state revealed in MCD around 4.95 eV.24 In such a case, internal conversion would be expected to favour population transfer to Rydberg states with a large binding
energy. We can tentatively assign the electronic configuration of this doubly excited state. The S2
state is a superposition of two one electron excitations: HOMO to HOMO+2 and HOMO-1 to
LUMO36. The ion shake-up state calculated by Deleuze33 corresponds to the excitation HOMO to HOMO+2. The doubly excited state could easily involve the double excitation of the HOMO+2
orbital. This configuration would be in agreement with Deleuze’s calculation and be of A1
symmetry, as required for the observed optical anisotropy11.
Photoelectron spectra 5 and 6 of Figure 4a are one colour profiles recorded at 400 nm (5) in
the femtosecond regime or (6) nanosecond regime. Remarkably, the intensity distribution of the
photoelectron spectra at 400 nm is the same regardless of whether the MPI takes place in the
nanosecond or femtosecond regime. It is useful here to comment on the difference between one
colour photoionization at 400 nm (Figure 4a) and at 266 nm (Figure 4b). Photoelectron spectra
recorded at 400 nm show the Rydberg fingerprint whilst those recorded at 266 nm display the
electronic character of the S4 state and the S2 states. A two-photon excitation at 400 nm can reach
an excited state, as already observed in the liquid phase,3 whose population would then decay rapidly to the S2 state. In that case photoionization at 266 nm via ∆ ≈v 0 transitions are
(
)
(
)
(
)
(
)
(
)
(
)
0 4 1
2
0
266 266
266
400
v 0.26 v 0.82 v 0 allowed
v 1.1 v 1.92 v 0 allowed
2 vib vib o nm nm nm nm h h
S S = 0 E eV D = 0 eV
IC
h
S = 0 E eV D = 0 eV
h S ν ν ν ν → + → + ⇒ ∆ = ↓ + → + ⇒ ∆ =
(
)
(
)
(
)
?? 2 400 v2.64 v 1.92 v 0 not
allow de
vib nm o
S IC
h
S = 0 E eV ν D = 0 eV
→ ↓
+ → + ⇒ ∆ =
Consequently at 400 nm the transition to the intermediate double hole state competes efficiently
with direct photoionization, in contrast to the 266 nm scheme.
Doubly excited states are quite difficult to investigate spectroscopically mainly due to their
markedly different geometry to the valence states as well as their short lifetimes. It is mainly
through their relaxation process that they are detectable. Despite the difficulty, we hope our
observations might inspire theorists to take up the challenge to calculate the geometry and
electronic configuration of the doubly excited states on polyaromatic systems, such as azulene.
Indeed, these curious states are of potential importance in a variety of interesting processes since
these states might coexist with the ion states as well as dissociative neutral states. The dynamics of
such states are thus likely to play a crucial role in Rydberg fingerprint spectroscopy, used for
instance to differentiate charge distributions in isomeric aromatic molecules,35 as well as conformational dynamics.37
D - Non-radiative relaxation from vibrationally excited S2 state
The time transients recorded in Figure 2 map the relaxation from the S2 state. This is
revealed by the persistence of the intensity distribution of the time-resolved photoelectron spectrum
as a function of the pump-probe delay as well as the same sensitivity to the rotational coherence
(not presented here). We now examine the variation of the decay rate as a function of the excitation
Non-radiative relaxation in azulene is largely governed by internal conversion (IC) rather
than intersystem crossing (ISC). If we ignore ISC, the decay time τe is simply a function of the
radiative rate k r and the non-radiative relaxation rate kIC:
1 r
e IC r
e r
k
k k k
τ = =φ = + (4)
where φr is the fluorescence quantum yield. In Figure 5 we plot the decay rates measured for
different vibrational energy in S2 state, together with lifetime measurements9 obtained for low Evib
and data deduced from quantum yield measurements.7,8 The fluorescence rate is usually supposed independent of the vibrational mode,38 such that any variation in the decay time simply stems from a dependency of the IC rate with the excess energy. At the origin of S2,the weak coupling between
the S2-S1 state39 can be described by an electronic energy gap law.40 At larger excess vibrational
energies the relaxation becomes dominated by the S2-S0 internal conversion. 7
With increasing vibrational energy, the internal conversion rate is expected to increase
slightly before tailing off at yet higher energy.38,41 The overall trend of exponentially increasing kIC
versus vibrational energy in S2 has already been observed7-9,41 for an excess vibrational energy
greater than 0.24 eV.2,8 In the framework of Fermi’s Golden Rule, the internal conversion rate can be approximated as:38
( )
2 2( )
IC i i i
k E = π V ρ E (5)
where ρ
( )
Ei is the vibrational level density in S0 at the energy Ei =ES2( )
0 +Evib( )
S2 with ES2( )
0defining the vibrational zero point energy of S2 and Vi2 the mean-square value of the S2-S0
coupling at the energy Ei. The vibrational level density at high excess energy can be roughly
estimated by an exponential function of vibrational energy:38
( )
0
exp i i
S
E E
ρ
ε
∝
where
0
S
ε is the typical energy scale of increase in level density as a function of the vibrational
energy in S0. In a crude approximation, one can assume a weak variation of coupling Vi 2as a
function of Ei, such that:
( )
( )
2 0 0ln e IC 1 1
vib r IC S S
k k
E S k k
δ α
δ ε ε
= =
+ ∼ (7)
This simple calculation overestimates α by not taking into account the vibrational modes promoting
the IC that will lead to a reduced state density, however, it explains the linear dependency observed
in Figure 5.
Figure 5 compares the rate ke measured at high excess energy in the present work with
earlier gas-phase measurements at lower excess vibrational energy.7-9,41 The value of -1
1.70 0.05 eV
α = ± is the result of a linear fit taking into account our data together with two
measurements obtained by picosecond resolved fluorescence and a jet-cooled molecular beam at
excess energy ≥ 236 meV.8
In order to detect the importance of promoting modes, a calculation of the state density in S0
at the different vibrational energies of S2 has been carried out using the generating function for the
number of states of a given energy:42
( )
10 1 1 A i n i f z zε = = −
∏
(8)where
1
A
n is the total number of in-plane vibrational modes of A1 symmetry (17 for azulene) and εi
are the vibrational energies in S0.23 The number of possible combinations at the total vibrational
energy E in the S0 state is calculated by numerical integration of the Cauchy residue formula which
inverts the generating function:43
( )
1( )
1 2 E
c
dz
N E f z
i z
π +
This contour integral is done with a resolution of ∆E=10 meV, fixed by the convergence of the
calculation, leading to a density of states:
( )
E N E( )
Eρ =
∆ (10)
Here the anharmonicities of the vibrational modes are not taken into account nor are all the mode
combinations, but the good agreement with the experimental data (slope -1
1.21 0.02 eV
α = ± -
dashed plot on Figure 5) leads us to conclude that the internal conversion S2- S0 is not limited by a
promoting mode process. Note that, for instance, if the 6 out-of plane A2 vibrational modes23 are
added in the calculation, the slope increases toα =2.27 0.02 eV± -1.
At high excitation energy, the internal conversion rate might simply depend on the
difference in entropy between the initial and the final electronic state. Indeed, the entropy of the
initial state has to be taken into account to reflect the dissipative character of the intramolecular
vibrational relaxation. When the vibrational energy in S2 becomes significant, the entropy of S2
increases at the same rate ε ε= S0as the entropy in S0 and the internal conversion rate will reach its
converging limit defined by:38
( )
( )
2 0
2 0 0
2
exp S S i
IC
E E
V
k π
ε ε
−
=
(11)
Although we have not yet observed this fall-off behaviour in the IC rate between the S2 and S0
states, we can still estimate a lower limit for the vibronic coupling Vi from thekIC measured at the
maximum excess vibrational energy investigated here (1.24 eV) s-1 and ε 1 586 17 meV
α
∝ = ± .
The lower limit for Vi is 60 ± 5 µeV. Note that the S2-S4 vibronic coupling is estimated to 99.2
meV.20 A more definitive statement concerning the magnitude of the coupling must await the determination of the fall-off region of kIC via pump-probe experiments done at higher energy.
-1
1.50 0.53 eV
IV CONCLUSION
We have performed time resolved studies on the S2-S4 excited states of azulene. Our pump-probe
experiments reveal an internal conversion process onto the S2 state, followed by an internal
conversion onto S0. The S2-S0 decay rate follows an exponential energy gap law as a function of the
vibrational energy in the S2 state. The vibronic coupling strength is anticipated to be larger than 60
µeV based on a statistical description of the internal conversion. These experiments also reveal an
uncommon ionization pathway involving a common set of Rydberg states that are populated on an
ultrafast timescale from a doubly excited state, or possibly several such states. Experimental
evidence suggests that this probe transition becomes efficient when the excess energy in the ion
continuum is not high enough to reach the Franck-Condon window. Above the IP doubly excited
states can autoionize or undergo dissociative ionization in addition to relaxing by an Auger-like
process to vibrationally excited Rydberg whose origins lie below the IP. However, if the doubly
excited state itself lies below the IP only this last decay route is open. In fact, these processes may
be quite general in aromatic systems in which doubly excited states below the IP are likely to be
ubiquitous.
ACKNOWLEDGEMENTS
The authors would like to thank D.S. Dean for his help in calculating the density of states,
and A. Beswick for helpful references on statistical theories applied to relaxation dynamics. This
work was supported by CNRS, le Ministère de la Recherche, Région Midi-Pyrénées through ”Plan
état-Région Spectroscopies Optiques Ultimes”, ANR COCOMOUV and the British Council
Alliance programme. BJW thanks the CNRS and the UPS for his invited positions in the LCAR.
KR thanks the CNRS for his postdoc fellowship. GT thanks the European network COCOMO for
his postdoc fellowship. IW and BJW are also grateful to the EPSRC for partial support of this work
REFERENCES
1 M. Kasha, Discuss Faraday Soc. 9 (14) (1950).
2 M. Fujii, T. Ebata, N. Mikami and M. Ito, Chem. Phys. 77 (2), 191 (1983). 3 P. Foggi and F. V. R. Neuwahl, J. Phys. Chem. A 107 (11), 1689 (2003).
4 J. R. Cable and A. C. Albrecht, J. Chem. Phys. 84 (4), 1969 (1986); L. Ciano, P. Foggi and
P. Remigio Salvi, J. Photochem. Photobiol., A 105 (2-3), 129 (1997).
5 M. Damm, F. Deckert, H. Hippler and J. Troe, J. Phys. Chem. 95, 2005 (1991).
6 U. Hold, T. Lenzer, K. Luther and A. C. Symonds, J. Chem. Phys. 119 (21), 11192 (2003);
H. Hippler, L. Lindemann and J. Troe, J. Chem. Phys. 83 (8), 3906 (1985).
7 Y. Hirata and E. C. Lim, J. Chem. Phys. 69 (7), 3292 (1978).
8 D. R. Demmer, J. W. Hager, G. W. Leach and S. C. Wallace, Chem. Phys. Lett. 136 (3-4),
329 (1987).
9 O. K. Abou-Zied, D. R. M. Demmer, S. C. Wallace and R. P. Steer, Chem. Phys. Lett. 266
(1-2), 75 (1997).
10 E.-G. Diau, S. De Feyter and A. H. Zewail, J. Chem. Phys. 110 (20), 9785 (1999). 11 K. Raffael, V. Blanchet, B. Chatel, G. Turri, B. Girard, I. Garcia, I. Wilkinson and B. J.
Whitaker, Chem. Phys. Lett., submitted (2008).
12 A. Stolow, A. E. Bragg and D. M. Neumark, Chemical Reviews 104 (4), 1719 (2004). 13 A. T. J. B. Eppink and D. H. Parker, Rev. Sci. Instrum. 68 (9), 3477 (1997).
14 G. Cerullo and S. De Silvestri, Rev. Sci. Instrum. 74 (1), 1 (2003); A. Monmayrant, A.
Arbouet, B. Girard, B. Chatel, B. J. Whitaker, A. Barman and D. Kaplan, Appl. Phys. B 81
(2-3), 177 (2005).
15 N. Nakashima, S. Shimizu, T. Yatsuhashi, S. Sakabe and Y. Izawa, J. Photochem.
Photobiol., C 1 (2), 131 (2000).
17 D. Tanaka, S. Sato and K. Kimura, Chem. Phys. 239 (1-3), 437 (1998). 18 S. Hassoon, D. L. Snavely and I. Oref, J. Chem. Phys. 97 (12), 9081 (1992).
19 M. F. Lin, C. L. Huang, Y. T. Lee and C. K. Ni, J. Chem. Phys. 119 (4), 2032 (2003); Y. A.
Dyakov, C. K. Ni, S. H. Lin, Y. T. Lee and A. M. Mebel, J. Phys. Chem. A 109 (39), 8774
(2005).
20 W. D. Lawrance and A. E. W. Knight, J. Phys. Chem. 94 (4), 1249 (1990). 21 P. M. Weber and N. Thantu, Chem. Phys. Lett. 197 (6), 556 (1992). 22 R. Boschi, E. Clar and W. Schmidt, J. Chem. Phys. 60 (11), 4406 (1974).
23 P. M. Kozlowski, G. Rauhut and P. Pulay, J. Chem. Phys. 103 (13), 5650 (1995). 24 W. Gerhartz and J. Michl, J. Am. Chem. Soc. 100, 6877 (1978).
25 M. Tsubouchi, B. J. Whitaker, L. Wang, H. Kohguchi and T. Suzuki, Phys. Rev. Lett. 86
(20), 4500 (2001).
26 N. Kuthirummal and P. M. Weber, Chem. Phys. Lett. 378 (5-6), 647 (2003). 27 N. Kuthirummal and P. M. Weber, J. Mol. Struct. 787 (1-3), 163 (2006). 28 C. P. Schick and P. M. Weber, J. Phys. Chem. A 105 (15), 3725 (2001). 29 C. P. Schick and P. M. Weber, J. Phys. Chem. A 105 (15), 3735 (2001).
30 T. Kitagawa, Y. Harada, H. Inokuchi and K. Kodera, J. Mol. Spectrosc. 19 (1-4), 1 (1966). 31 J. W. Lewis, R. V. Nauman, D. B. Bouler and S. P. McGlynn, J. Phys. Chem. 87 (19), 3611
(1983).
32 S. T. Pratt, Annu. Rev. Phys. Chem. 56, 281 (2005). 33 M. S. Deleuze, J. Chem. Phys. 116 (16), 7012 (2002).
34 S. Hirata, M. Head-Gordon, J. Szczepanski and M. Vala, J. Phys. Chem. A 107 (24), 4940
(2003).
35 J. L. Gosselin and P. M. Weber, J. Phys. Chem. A 109 (22), 4899 (2005).
36 A. Murakami, T. Kobayashi, A. Goldberg and S. Nakamura, J. Chem. Phys. 120 (3), 1245
37 M. P. Minitti and P. M. Weber, Phys. Rev. Lett. 98 (25), 253004 (2007).
38 B. Jacobson, A. , J. Guest, A., A. F. Novak and S. Rice, A. , J. Chem. Phys. 87 (1), 269
(1987).
39 B. D. Wagner, D. Tittelbach-Helmrich and R. P. Steer, J. Phys. Chem. 96, 7904 (1992); N.
Tetreault, R. S. Muthyala, R. S. H. Liu and R. P. Steer, J. Phys. Chem. A 103 (15), 2524
(1999).
40 R. Englman and J. Jortner, Mol. Phys. 18 (2), 145 (1970).
41 T. M. Woudenberg, S. K. Kulkarni and J. E. Kenny, J. Chem. Phys. 89 (5), 2789 (1988). 42 S. H. Lin and H. Eyring, J. Chem. Phys. 39 (6), 1577 (1963).
TABLES
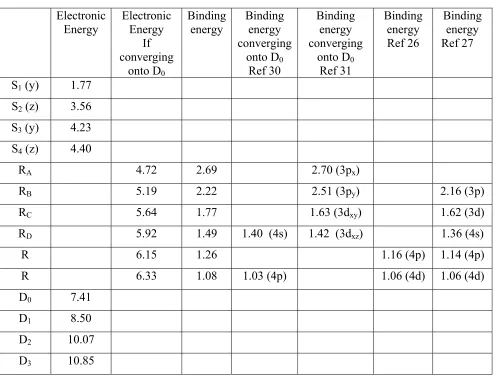
Table 1 : Band origins of the main electronic states of azulene and its cation. The orientation of the
dipolar momenta of transition from S0 are added in parenthesis. The Rydberg states are listed as a
function of their binding energies and compared to various listed in the literature. All energies are in
eV.
Electronic Energy
Electronic Energy
If converging
onto D0
Binding energy
Binding energy converging
onto D0
Ref 30
Binding energy converging
onto D0
Ref 31
Binding energy Ref 26
Binding energy Ref 27
S1 (y) 1.77
S2 (z) 3.56
S3 (y) 4.23
S4 (z) 4.40
RA 4.72 2.69 2.70 (3px)
RB 5.19 2.22 2.51 (3py) 2.16 (3p)
RC 5.64 1.77 1.63 (3dxy) 1.62 (3d)
RD 5.92 1.49 1.40 (4s) 1.42 (3dxz) 1.36 (4s)
R 6.15 1.26 1.16 (4p) 1.14 (4p)
R 6.33 1.08 1.03 (4p) 1.06 (4d) 1.06 (4d)
D0 7.41
D1 8.50
D2 10.07
FIGURE CAPTIONS
Figure 1 :
(1) One-colour photoionization onto the cation states D0 and D1 via one photon resonance with
S4 (path a). Within the pulse duration, internal conversion to the S2 state (IC1) can take place
(path b). ( ) 0a
ε ( ( )
0b
ε ) is the photoelectron kinetic energy expected from photoionization taking
place onto D0 from the path (a) (respectively from the path (b)), assuming approximate
conservation of the vibrational energy. See the Fig 3 for the recorded photoelectron spectra.
(2) And (3) Two-colour Pump-probe (1+1' or 1+2’) photoionization with (c) a direct one-photon
probe transition from the initially prepared state (S4 in this example) or (d) a two-photon
photoionization enhanced via resonances with Rydberg states R1 and R2. During the
pump-probe delay internal conversion onto the S2 (IC1) and S0 (IC2) states can take place. (e)
Two-photon photoionisation via a doubly excited state (**) that decays within the probe pulse
duration onto Rydberg states (IC3).
Figure 2 :
Time-transients recorded on the parent ion C10H8+ with ∆t=0 determined by a cross-correlation
recorded by photionization of NO. A single exponential fit (full line) gives a time constant of (a)
273.8+/-10.5 ps for an excitation taking place at the origin band of the S3 state, namely λpump=293
nm and (b) 68+/-1 ps at 223 meV above the origin band of the S4 state, namely λpump=268 nm. For
both measurement, the probe pulse is the second harmonic generation of the fundamental output
(~400 nm).
Figure 3 :
One-colour photoelectron spectra recorded with a fs-pulse centered at 266 nm (empty circle) or 258
might be released for ionization taking place to the cation ground state D0 or the first excited state
D1.
Figure 4 :
Photoelectron spectra recorded with a probe pulse centered at (a) 400 nm and pump excitation at (1)
268 nm (2) 275.5 nm, (3) 283 nm (4) 335 nm. For comparison one-colour photoionization at 400
nm obtained (5) in the femtosecond regime or (6) nanosecond regime are plotted, as well as (b) the
266 nm fs-one colour experiment presented in Fig 3. Each 1+2’ photoelectron spectra has been
recorded at ∆t~1ps after subtraction of the background spectra (one-colour experiment recorded
with the pump alone or the probe alone).
The vertical shifts introduced to compare the spectra are indicated by horizontal dot lines. The
different Rydberg states are identified as a function of their binding energy (with a probe step at
one-photon of 400 nm-top axis of (a)), their principal quantum number n and a quantum defect δ
assuming that these ones are in the 0-1 range.
Figure 5 :
Plot of log(kE) versus vibrational energy in the S2 state. Our data are compared to previous work by
Hirata et al.7, Abou-Zield et al 9 and Demmer et al 8, as well as to the calculated density of states taking into account only the vibrational modes of A1 symmetry. Linear fits are done on our data
V. Blanchet et al., Fig. 1 2 h
ν
S0 D1 D0 (1) (2) S4 S2 IC1 (b) 0 ε (a) 1 ε (a) 0 ε 1 hν
(3) S0 S4 S2 1 hν
S3**
S0 S4 S2 IC1 1 hν
S3 2 hν
R1 D0 IC2 1 hν
IC2 IC1 1 hν
2 hν
2 (d ) 0 ε R2 1 (d ) 0 ε 2 (e ) 0 ε R2 1 (e ) 0 ε D0 IC3 R1 (c)(a) (b) (e)
(d) 2 h
ν
z
2 hν
S0 D1 D0 (1) (2) S4 S2 IC1 (b) 0 ε (a) 1 ε (a) 0 ε 1 hν
(3) S0 S4 S2 1 hν
S3**
S0 S4 S2 IC1 1 hν
S3 2 hν
R1 D0 D0 IC2 1 hν
IC2 IC1 1 hν
2 hν
2 (d ) 0 ε R2 1 (d ) 0 ε 2 (e ) 0 ε R2 1 (e ) 0 ε D0 IC3 R1 (c)(a) (b) (e)
(d)
2
h
ν
V. Blanchet et al., Fig. 2
0
100
200
300
400
500
600
700
0.0 0.4 0.8
τ
= 68.0+/- 1.0ps
(b)
∆
t /ps
0.0 0.4 0.8
τ
= 273.8+/-10.5 ps
(a)
C
10H
8V. Blanchet et al., Fig. 3
0.5
1.0
1.5
2.0
0.0
0.5
D
1at 266nm
D
1at
258nm
D
0at 266nm
D
0at
258nm
Photoelec
tr
on intens
ity
/a.u.
V. Blanchet et al., Fig. 4
0.0
0.5
1.0
1.5
2.0
2.5
3.0
3.5
3.0
2.5
2.0
1.5
1.0
0.5
0.0
0.5
1.0
1.5
2.0
2.5
3.0
3.5
0.0
0.5
0,
98
0,
72
0,
46
0,7
5
0,5
3
0,2
3
(4)
(6)
Photoelectron kinetic energy /eV
Phot
oelec
tron int
ensit
y /
ar
b.
unit
s
n=4
n=3
(3)
(5)
(1)
(2)
(a)
Binding energy /eV
V. Blanchet et al., Figure 5
0.00
0.50
1.00
7.5
8.0
8.5
9.0
9.5
10.0
10.5
This work with Evib > 620 meV Hirata et al. JCP 1978
Abou-Zied et al. CPL 1997 Demmer et al. CPL 1987 Calculated density of states
log
10
k
E/s
-1