Estimation of local anisotropy of plexiform bone: Comparison between
depth sensing micro-indentation and Reference Point Indentation
E. Dall'Ara
a,b,c,n, P. Grabowski
c, P. Zioupos
d, M. Viceconti
a,b aDepartment of Mechanical Engineering, University of Sheffield, Sheffield, UK bINSIGNEO Institute for in silico medicine, University of Sheffield, Sheffield, UK c
Department Oncology and Metabolism, University of Sheffield, Sheffield, UK d
Centre for Musculoskeletal & Medicolegal Research, CFI, Cranfield University, DA of the UK, Shrivenham, UK
a r t i c l e i n f o
Article history:
Accepted 1 October 2015
Keywords:
Bone
Reference Point Indentation Micro-indentation Anisotropy Plexiform
a b s t r a c t
The recently developed Reference Point Indentation (RPI) allows the measurements of bone properties at the tissue levelin vivo. The goal of this study was to compare the local anisotropic behaviour of bovine plexiform bone measured with depth sensing micro-indentation tests and with RPI. Fifteen plexiform bone specimens were extracted from a bovine femur and polished down to 0.05mm alumina paste for indentations along the axial, radial and circumferential directions (N¼5 per group). Twenty-four micro-indentations (2.5mm in depth, 10% of them were excluded for testing problems) and four RPI-indentations (50mm in depth) were per-formed on each sample. The local indentation modulusEindwas found to be highest for the axial direction
(24.372.5 GPa) compared to the one for the circumferential indentations (19% less stiff) and for the radial direction (30% less stiff). RPI measurements were also found to be dependent on indentation direction (po0.001) with the exception of the Indentation Distance Increase (IDI) (p¼0.173). In particular, the unloading slope US1 followed similar trends compared to theEind: 0.4770.03 N/mm for axial, 11% lower for
circumfer-ential and 17% lower for radial. Significant correlations were found between US1 andEind(p¼0.001;R2¼0.58),
while no significant relationship was found between IDI and any of the micro-indentation measurements (p40.157). In conclusion some of the RPI measurements can provide information about local anisotropy but IDI cannot. Moreover, there is a linear relationship between most local mechanical properties measured with RPI and with micro-indentations, but IDI does not correlate with any micro-indentation measurements.
&2015 The Authors. Published by Elsevier Ltd. This is an open access article under the CC BY license (http://creativecommons.org/licenses/by/4.0/).
1. Introduction
Bone is a complex hierarchical material with mechanical prop-erties that depend on the investigated dimensional scale, from the cell up to the body levels. Bone structural units (BSU) are formed of packages of bone lamellae that organize in macrostructures such as trabeculae and osteons. Due to the distribution of their BSUs, both cortical and trabecular bone have exhibited anisotropic mechanical properties at the tissue level as shown by micro-indentation (Dal-l'Ara et al., 2013;Franzoso and Zysset, 2009;Reisinger et al., 2011; Roy et al., 1999;Wolfram et al., 2010) and ultrasound (Turner et al., 1995,1999); and at the macro-level as shown by mechanical testing (Li et al., 2013;Odgaard, 1997;Ohman et al., 2007;Rincon-Kohli and
Zysset, 2009). The long bones of quickly growing large animals reveal one further sub-classification into laminar and plexiform tissue, formed of parallel-fibred bone and lamellar bone around macroporosities. Previous studies have shown that the structure of plexiform bone has an orthotropic mechanical behaviour macro-scopically (Katz et al., 1984; Macione et al., 2010). However, not much is known about its mechanical anisotropy at the BSU level. The better understanding of the anisotropic properties of this structure at the micro-level is important in order to understand why it appears only in large quickly growing animals and not in more active species such as humans or small mammals.
The need to understand how bone properties relate and translate from the micro-architectural (BSU) to the macro-architectural level has become more acute with arrival of the Reference Point Inden-tation (RPI) method. This novel indenInden-tation technique allows for the study of bone qualityin vivo(Hansma et al., 2008,2009), something that until now could be done only on extracted bone biopsies. A few studies have reported that some of the RPI parameters, in particular the Indentation Distance Increase IDI (Diez-Perez et al., 2010; Guerri-Contents lists available atScienceDirect
journal homepage:www.elsevier.com/locate/jbiomech
www.JBiomech.com
Journal of Biomechanics
http://dx.doi.org/10.1016/j.jbiomech.2015.10.001
0021-9290/&2015 The Authors. Published by Elsevier Ltd. This is an open access article under the CC BY license (http://creativecommons.org/licenses/by/4.0/). nCorrespondence to: INSIGNEO Institute for in silico medicine, Room Cþ36-Cþ
Floor, The Pam Liversidge Building, Sir Frederick Mappin Building, Mappin Street, Sheffield S1 3JD, UK.
Tel.:þ44 114 2226175; fax:þ44 114 2227890.
Fernandez et al., 2013), differ between patients who did or did not suffer of a bone fracture. However, it is not clear yet how the prop-erties measured with this tool are related to the intrinsic mechanical properties of the tested bones at the tissue level and to its structural anisotropy. Very recently some methodological studies investigated the sensitivity of the RPI indentation properties to the selected testing procedurein vitro (Jenkins et al., 2015; Setters and Jasiuk, 2014). Due to the relatively large indentations (50–200mm in depth) and the potential relationship between the local resistance to frac-ture and the IDI, some other studies have compared the RPI outputs with measurements performed at the macro-level such as bone toughness and reported mixed if not controversial results. In parti-cular, IDI was not related to the whole mouse bone stress intensity fracture toughness (Carriero et al., 2014), was weakly correlated to ultimate stress (R20.25) and toughness (R20.24) of cortical bone
specimens extracted from the human femur (Granke et al., 2014; Katsamenis et al., 2015) and was correlated (R20.50) with work to
failure for pooled data obtained from rat femur, rat vertebra and dog rib (Gallant et al., 2013). Moreover, IDI measurements performed along the longitudinal or transverse directions were found to be similar for the human femoral cortical bone (Granke et al., 2014) but significantly different for porcine cortical bone (Rasoulian et al., 2013). If the relationship between RPI measurements and macro-mechanical properties is not clear, little is known about the rela-tionship between the RPI measurements method and the mechanical properties at the BSU. Surprisingly only two studies (Feng et al., 2012; Rasoulian et al., 2013) compared local lamellar elastic moduli mea-sured with depth sensing nano-indentation (lamellar level, a few microns in size) and RPI measurements on porcine cortical bone, reporting that both techniques measure higher mechanical
properties along the longitudinal direction compared to the trans-verse one, but it is not clear if indentations were performed on the same set of specimens and along which direction. On the basis of all these studies it appears that there are two crucial factors on which interpretation of the clinical RPI results will depend on in the future: the relationship of RPI measures to the underlying BSUs and the issue of directionality which will determine if and how the application of the RPI locally and in vivo will be interpreted as reflecting the properties of the bone at the higher scale.
In this study we propose to investigate the local anisotropic mechanical behaviour of plexiform bone at two dimensional levels with two indentation techniques on the same set of specimens: depth sen-sing micro-indentation (BSU level, penetration depth equal to 2.5mm) and RPI (tissue level, penetration depth approximately 50mm).
The hypotheses of this study were that:
○ plexiform bone exhibits orthotropic mechanical behaviour at the BSU scale;
○ RPI can measure differences in the mechanical properties of the plexiform bone if indented along the axial, radial and cir-cumferential directions;
○ there is a relationship between the local mechanical properties measured with RPI and with depth sensing micro-indentation.
2. Material and methods
[image:2.595.48.546.57.370.2]One bovine femur was obtained from an 18 months old animal killed for alimentary purpose. The femur was stored in freezer at20 C until it was dissected.
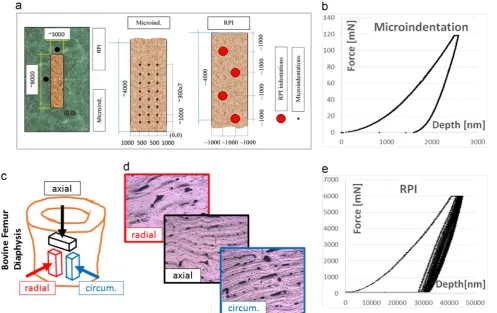
Fig. 1.Overview of the methods. Specimens were extracted from a bovine femur in order to perform indentations along axial, circumferential and radial directions (c). Only
2.1. Specimen preparation and further analysis
Fifteen prismatic specimens (348 mm3
) were prepared for indentation tests along the three anatomical directions. In particular, groups of three neighbouring specimens were isolated fromfive regions of the bone diaphysis. From each group, one sample was prepared for indentation along the axial, one along the radial and one along the circumferential directions. Therefore,five specimens were prepared for indentations along each anatomical direction (Fig. 1c). Specimens were cut with a diamond bandsaw (CP300, Exakt, Germany) under continuous water irrigation to reduce possible damage on the tissue. Afterwards, specimens were left to dehydrate in air for approximately 12 h, then embedded in PMMA (Technovit4071, Heraeus Kulzer, Germany) without infiltration. The specimens were then polished by hand by using progressivelyfiner silicon carbide papers from 400 to 2000 grade (Struers, Denmark) andfinalized with alumina paste (0.05mm, Struers, Denmark). Afterwards, the specimens were rinsed with water in order to remove the polishing particles and left to dehydrate in air for at least 48 h at room temperature. Specimens were visualized under a reflected light microscope and only specimens showing a clear plexiform structure were included in the analysis (Fig. 1d).
For both indentation protocols, measurements were performed on dry speci-mens in order to minimize the differences between the two measurement techniques.
2.2. Micro-indentation test
The specimens were mounted on a calibrated nanoindenter (NHT, CSM-Instruments, Switzerland) andfixed with the upper surface parallel to the horizontal table of the machine. A Berkovich tip was used for the measurements. Twenty-four target indenta-tions were performed for each specimen (in one case only 12 indentaindenta-tions were per-formed due to surface irregularities). Indentations were perper-formed over an area of 10002100mm2
in order to cover a large portion of the specimen. The target location of the indents was defined based on a virtual rectangular grid, starting at a distance of 1000mm in both axes from a corner and leaving a distance between each indentations of 300mm along theXaxis and of 500mm along theYaxes (Fig. 1a). Where necessary the target location of each indentation was corrected in order to avoid measurements on visible defects or macro-pore: once the target position was visualized under the micro-scope, it was moved within a diameter of 60mm to avoid surface imperfections or lacu-nae. In order to avoid edge effects and effects from adjacent indentations, the indentations were performed at least 1000mm from the edge of the sample, at least 100mm from each other and at least 100mm from the vascular pores (Zwierzak et al., 2009). When it was not possible to respect these restrictions, the indentation was skipped.
The indentation procedure consisted in a trapezoidal load-hold-unload proce-dure in load control, with maximal penetration depth of 2.5μm and constant loading and unloading rate equal to 120 mN/min (Fig. 1b). In order to minimize the influence of creep, the load at the maximal penetration depth was held for 60 s between loading and unloading linear ramps.
In each indentation the contact point recognized by the machine was corrected by the operator using the standard procedure suggested by the manufacturer. Moreover, curves with unusual shape, due to the presence of defects underneath the surface at the indentation location or due to the requirement of a new depth adjustment, were excluded.
The plane strain indentation modulus (Eind, Eqs.(1) and (2)) was calculated according to theOliver and Pharr (1992). For comparisons with the literature, the elastic modulus (Ee) was computed assuming a Poisson's ratioνs equal to 0.3 (Dall'Ara et al., 2012;Rho et al., 2002;Zioupos, 2005).
Eind¼ Ee ð1ν2
sÞ ¼ 1
1
Er
1ν2 i Ei
ð1Þ
with subscripts indicating bone sample (s) and indenter tip (i);Eiequal to 1141 GPa andνiequal to 0.07;Eris the reduced indentation modulus and can be computed from the indentation curves as:
Er¼ 1
β ffiffiffiffi π p
2 1 ffiffiffiffiffiffiffiffiffiffiffiffiffiffiApðhcÞ
p Shmax ð2Þ
whereβis a constant defined by the shape of the tip,Sis the slope of the unloading curve,hmaxis the maximal depth reached during the indentation,Apis the pro-jected area of the indentation at the depthhcand it is estimated during the machine calibration test with a fused silica sample.
The aspect ratios between elastic moduli (ARem) were computed from the anisotropy ratios between indentation moduli (ARem¼(AR)1.6
) (Franzoso and Zysset, 2009). Hardness (HV), elastic workWel(area below the unloading part of the curve), dissipated workWpl(area inscribed by the force–depth cycle) and total workWtot (sum ofWelandWpl) were computed for each indentation (Wolfram et al., 2010).
2.3. Reference Point Indentations
Indentations were performed by using the RPI method (BioDent™, Active Life Scientific Inc., USA). As previously described (Jenkins et al., 2015;Setters and Jasiuk, 2014), the instrument performs an indentation on the bone surface with a stainless
steel Bone Probe 2 (BP2; Active Life Scientific) consisting of a 375mm diameter, cono-spherical, 2.5 mm radius tip test probe with a beveled reference probe with a blunted end. The same instrument can be used to perform indentationsin vivoon (mostly curved) bone surfaces, while here it was used on our standard lab-finished bone specimens to provide comparisons to micro-indentation values. We carried out 10 cycles in load control up to a maximal force of 6 N and with a frequency of 2 Hz (Fig. 1e). The force was increased linearly from zero to maximum load (6 N) during the first one-third of a cycle, maintained for the next one-third and decreased linearly over the final one-third. To be consistent with the indentation experiments, the tests were performed on dry bone, on the micro-indentation-free half of each dry bone specimen (Fig. 1d), leaving 1.0 mm from the edge and 1.4 mm between each indentation (distances larger than the limit of 500mm suggested byJenkins et al. (2015)).
For each indentation the following standard parameters were evaluated with the software provided by the manufacturer: the slope of the unloading curve of the
first cycle (US1), the mean unloading slope for the 10 cycles (USAvg), the mean dissipated energy in the last seven cycles (EnDisAvg), the mean creep distance in the 10 cycles (CIDAvg), Total Indentation Distance (TID) and the Indentation Dis-tance Increase betweenfirst and last cycles (IDI).
In order to check the reliability of the RPI instrument,five indentations were performed on a polished PMMA specimen before and after the tests, at a distance of approximately 2 mm from each other.
2.4. Statistics
After exclusion of indentations with unusual indentation graphs, the mean, stan-dard deviations and ranges were calculated for each variable split for“direction”groups (axial, circumferential and radial). As most variables split for“direction”were not nor-mally distributed (Shafiro–Wilk test: 13 variables withpo0.05, 23 variables with
p40.05, confirmed by the visual inspection of the histograms and of theQ–Qplots), non-parametric tests (Kruskas–Wallis, KW) were performed to test differences for each measurement as a function of the factor“direction”. Linear regressions were performed between the mean values of the RPI and micro-indentation measurement for each specimen by: i) calculating the means of the results obtained for micro-indentation measurements for each specimen (Eind, HV,Wpl); ii) calculating the means of the values obtained with RPI measurements for each specimen (US1, USAvg, EnDisAvg, IDI); iii) calculating the linear regressions between the RPI and micro-indentation measure-ments. All analyses were performed using SPSS v20.0 (IBM-Corp, Armonk, NY, USA).
3. Results
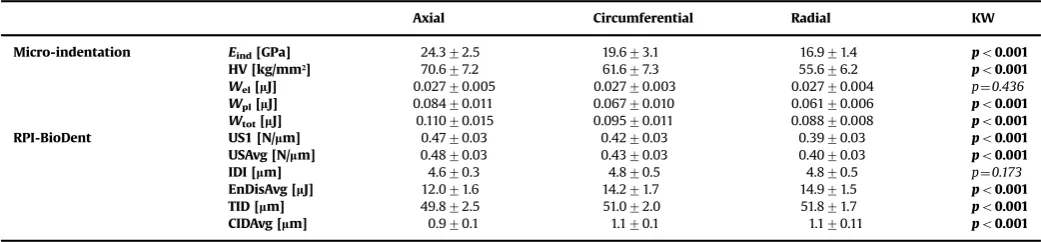
After the removal of the depth sensing micro-indentations with testing problems (32 indentations), 316 measurements remained valid (117 indentations performed along the axial direction, 107 along the circumferential direction, and 92 along the radial direction). Of the 60 indentations performed with the RPI method, only one was excluded due to contact problems (20 indentations along axial direction, 20 indentations along the radial direction, 19 indentations performed along the circumferential direction). The mean parameters split for“direction”are reported inTable 1.
3.1. Depth sensing micro-indentation results
All micro-indentation parameters were dependent on direction (po0.001) with the exception ofWel(p¼0.436) (Table 1). In
par-ticular, the local indentation modulusEindwas found to be highest
for the axial direction (24.372.5 GPa) compared to the one from circumferential indentations (19% less stiff) and from the radial direction (30% less stiff). ARem were 1.41 and 1.79 for axial/cir-cumferential (ARem-ac) and axial/radial (ARem-ar) directions, respectively. Similar trends were found for the hardness (70.677.2 kg/mm² for the axial direction, 13% less hard for cir-cumferential direction, 21% less hard for radial direction), for the dissipated work Wpl(0.08470.011mJ for axial, 20% lower for
cir-cumferential and 27% lower for radial directions) and for the total Work (Wtot¼0.11070.015mJ for axial, 14% lower for circumferential
and 20% lower for radial directions). For pooled data, weak to moderate relationships were found betweenEindand HV (po0.001,
R2¼0.64),Wpl(po0.001,R2¼0.72) andWtot(po0.001,R2¼0.56),
but no correlation was found with Wel(p¼0.820) (Fig. 2). When
other indentation properties were found for the circumferential direction (R2¼0.59 for HV,R2¼0.73 forWplandR2¼0.57 forWtot;
po0.001 for all of them), while weak, albeit significant (po0.001), correlations were found for the other directions (R2¼0.16 and
R2¼0.33 for the radial and axial directions only) (Fig. 2).
3.2. RPI results
The results from the indentations on the PMMA showed small differences between the pre- and post-tests on bone: absolute value of the difference between the means from 0.68% (USAvg) to 3.96% (EnDisAvg), differences in the coefficient of variations from 0.65% (EnDisAvg) to 4.86% (CIDAvg).
All RPI measurements on plexiform bone were found to be dependent on indentation direction (po0.001) with the exception of IDI (p¼0.173) (Table 1). In particular, US1 was found to be greater for axial oriented specimens (0.4770.03 N/mm) compared to circumfer-ential (11% lower) and radial ones (17% lower). Similar trends were found for USAvg (0.4870.03 N/mm for axial, 10% lower for circumfer-ential and 17% lower for radial specimens). Opposite trends were found for CIDAvg (0.970.1mm for axial, 11% higher for circumferential and 18% higher for radial specimens) and TID (49.872.5mm for axial, 2% higher for circumferential and 4% higher for radial specimens). It must be noted that IDI was not found to depend on direction even if results were split into axial and transverse groups (with radial and cir-cumferential directions pooled in one group;p¼0.076, IDI transverse equal to 4.870.5mm, difference of 4.5%).
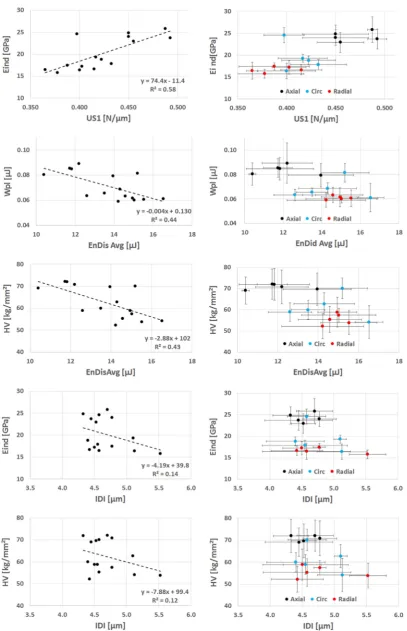
3.3. Comparison between micro-indentation and RPI
Comparison between the mean values of the micro-indentation and RPI measurements for the same specimens are reported in Fig. 3. Significant but moderate positive correlations were found between US1 andEind(p¼0.001;R2¼0.58) and between US10 and
Eind (p¼0.001; R2¼0.54). Conversely, significant but moderate
negative correlations were found between Wpl and EnDisAvg
(p¼0.007; R2¼0.44) and between EnDisAvg and HV (p¼0.007,
R2¼0.44). Furthermore, no significant relationship was found
between IDI and eitherEind(p¼0.157) or HV (p¼0.197).
4. Discussion
The aim of this study was to investigate if the RPI approach is able to discriminate the anisotropic properties of plexiform bone, in comparison with a well-established technique such as depth sensing micro-indentation.
The micro-indentation tests confirmed the hypothesis that plexiform bone is orthotropic also at the tissue level. TheEindof BSU
tested along the longitudinal direction for bovine plexiform bone
(24.372.5 GPa) was similar to the values reported for the human tibia (24.7–28.4 GPa, (Rho et al., 1997)) but higher than for the human cortical shell (14.572.5 GPa (Dall'Ara et al., 2013) and 19.972.7 GPa (Roy et al., 1999)). The anisotropy ratios measured for of plexiform bone were different than the values reported for human cortical shell (ARem-ac equal to 1.41vs1.32 (Dall'Ara et al., 2013) and 1.11 (Roy et al., 1999); ARem-ar equal to 1.79vs2.47 (Dall'Ara et al., 2013)). These differences may arise from lamellar arrangement and local heterogeneity in mineral density. More analyses are required to clarify which tissue properties contribute significantly to local ani-sotropy. Moreover, we found ARem at the BSU level in line with the those reported from ultrasound measurements performed on human and canine bone tissue (Turner et al., 1995,1999) and those mea-sured at the macro-level on bovine plexiform bone (Katz et al., 1984; Macione et al., 2010). The differences inEind, HV andWplalong the
different directions may suggest that the microstructure of the plexiform bone has intrinsic differences in both the mineral phase, which is related to the elastic deformation, and collagen composition and orientation, which is related to the plastic deformation (Bala et al., 2011). The overall correlation betweenEindand HV or Wpl for
pooled data and for circumferential direction may be related to an underlying relationship between the amount of mineral and the plastic deformation effects in this type of tissue.
[image:4.595.32.553.88.209.2]The measurements performed at the tissue level onflat polished bone surfaces with the RPI method showed dependence on the specimen orientation in all parameters, except for IDI. This result is consistent with previous reports on bovine bone (Jenkins et al., 2015) and on human femoral specimens (Granke et al., 2014), but is in contrast with data on porcine femurs (Rasoulian et al., 2013) where lower IDI values were found for longitudinal indentations compared to transverse ones. These differences might arise from species or age related factors. It remains to be investigated why IDI is not a sys-tematically related to the indentation direction for the different studies. Considering that the RPI technique is currently the solely technique used for material characterizationin vivo, the present data stresses that the IDI along the radial direction (suggested output for clinical applications) cannot be used to predict the IDI along the other directions. While this may seem to be a drawback, it is also a “benefit in disguise”. In clinical applications, where the exposed bone surface is almost invariably ill-defined in terms of direction and certainly neverflat, the independency of IDI from the indentation direction may be an advantage. In fact, it allows intergroup proper-ties to be revealed such as comparisons between healthy and osteoporotic patients, without the need to specifying directional differences. The practicality good use of IDI in clinical applications may in fact owe a lot to this simple“accidental”fact. It remains to be investigated whether similar results would be obtained in preclinical or clinical conditions where measurements are performed on the periosteum of a curved un-embedded wet bone surface.
Table 1
Results (mean7SD) from the micro-indentation and the RPI tests reported for different indentation directions. On the right column thep-value for the KW tests are reported.
Axial Circumferential Radial KW
Micro-indentation Eind[GPa] 24.372.5 19.673.1 16.971.4 po0.001
HV [kg/mm²] 70.677.2 61.677.3 55.676.2 po0.001
Wel[lJ] 0.02770.005 0.02770.003 0.02770.004 p¼0.436
Wpl[lJ] 0.08470.011 0.06770.010 0.06170.006 po0.001
Wtot[lJ] 0.11070.015 0.09570.011 0.08870.008 po0.001
RPI-BioDent US1 [N/lm] 0.4770.03 0.4270.03 0.3970.03 po0.001
USAvg [N/lm] 0.4870.03 0.4370.03 0.4070.03 po0.001
IDI [lm] 4.670.3 4.870.5 4.870.5 p¼0.173
EnDisAvg [lJ] 12.071.6 14.271.7 14.971.5 po0.001
TID [lm] 49.872.5 51.072.0 51.871.7 po0.001
This is thefirst study to report the relationship between RPI and micro-indentation measurements performed on the same set of specimens and along different anatomical directions. The results showed a moderate positive correlation between the micro-indentation Eind and US1 (R2¼0.58) or US10 (R2¼0.54). In fact,
RPI measurements, undertaken with deeper penetration, are affected by the properties of a larger bone volume under the tip, which is composed of different microarchitectures that affect the local material properties (Oyen and Ko, 2008;Paietta et al., 2011). Furthermore, the differences between the mechanical properties measured with the two methods could also be due to the different tip used (Berkovichvsconico-spherical) (Olesiak et al., 2010) and
[image:5.595.91.515.59.567.2]the indentation rate. Even though these results could be specific to plexiform bone, we have shown that RPI measurements (100mm scale) explain 44–58% of the variations in indentation modulus measured with depth sensing micro-indentation (1–10mm scale). Further work should be done to test if these results could be extended for osteonal bone. Contrasting results were reported in the literature about the relationship between the RPI outputs and measurements performed at the 1000–10,000mm scale showing no correlation (Carriero et al., 2014) or weak-moderate correla-tions (Gallant et al., 2013;Granke et al., 2014;Katsamenis et al., 2015) with bone toughness. The data suggests that the relation-ships may be dependent on the type of bone studied, ranging from
Fig. 2.Results from micro-indentation tests. Linear regression analysis among the micro-indentation measurements (indentation modulusEind, hardness HV, elastic work
mice to human bones. In the relationships between RPI and micro-indentation data, it seems that one specimen is an outlier. How-ever, because no reason for its behaviour could be found, the results in this study have been reported including all specimens. Yet, in case that specimen would be excluded, most of the corre-lations improved (Eind–US1 fromR2¼0.58 toR2¼0.79;Eind–US10
from R2¼0.54 to R2¼0.77; W
pl–EnDisAvg from R2¼0.44 to
R2¼0.59; HV–EnDisAvg fromR2¼0.44 toR2¼0.61). However, yet
again no improvement was found for the correlations with IDI, for which the relationships remained almost identical (Eind–IDI from
R2¼0.14 toR2¼0.13 and HV–IDI fromR2¼0.12 toR2¼0.12).
There are some limitations within the present study. Indentations were performed under dry conditions. Although dehydration affects the absolute values measured by micro-indentation, it has no effect as far as patterns of behaviour are concerned (i.e. directional effects, mineralization levelsetc.) other than shifting the base line of the data higher by 10–20% (Wolfram et al., 2010). However, it is possible that the dehydration could have different impact on the measurement performed at the two dimensional levels with potential influence on the results. Another limitation is the use of only one animal (bovine), one anatomical site (femur) and one bone tissue (plexiform). It remains to be investigated whether similar conclusions would be valid for other types of bone tissue (e.g. osteonal bone), species (e.g. human and porcine) and anatomical sites (e.g. vertebra). The design of these other experiments, of course, will have to be informed by the need for use of RPI in various other relevant clinical scenarios. Finally, only four RPI indentations were performed on each sample.
The main conclusions of this study can be summarized as follows:
○ depth sensing micro-indentation can discriminate the orthotro-pic mechanical properties of plexiform bone at the BSU level;
○ under the studied conditions, most of the RPI measurements can also measure differences in the mechanical properties of the tissue in different directions, with the noted exception of IDI, the most commonly quoted parameter forin vivoclinical applications;
○ there is a linear relationship between most local mechanical properties measured with RPI and those measured locally with micro-indentations. However, no relationship was found between IDI and either of the micro-indentation parametersEindor HV.
Finally, we found for thefirst time that there is a better rela-tionship between the RPI outputs (apart from IDI) and mechanical properties at the BSU compared to those measured at the macro-architectural scale (toughness of whole mice bones or of cortical bone specimens in the range of a few millimetres) reported in the literature. In addition the IDI has limitations in estimating the axial and circumferential mechanical properties of cortical bone from measurements performedin vivoalong the radial direction. This result means that the applicability of the IDI method is restricted to projects where the estimation of the local anisotropy is not important. However, this may advantageous when directionality is ill-defined or irrelevant and differences between group data are required. In these cases directionality can be ignored as a factor.
Conflict of interest statement
The authors have no conflict of interest for this study.
Acknowledgements
The project was partially funded by the FP7 European Program (MAMBO: PIEF-GA-2012-327357) and EPSRC MultiSim project (EP/
K03877X/1). PZ would like to acknowledge the support of EPSRC (EP/K020196: Point-of-Care High Accuracy Fracture Risk Predic-tion) research grant. The authors would like to thank Mr Podgorski for the help with the specimen preparation and Professor Bishop for access to the Biodent.
References
Bala, Y., Depalle, B., Douillard, T., Meille, S., Clement, P., Follet, H., Chevalier, J., Boivin, G., 2011. Respective roles of organic and mineral components of human cortical bone matrix in micromechanical behavior: an instrumented indenta-tion study. J. Mech. Behav. Biomed. Mater. 4, 1473–1482.
Carriero, A., Bruse, J.L., Oldknow, K.J., Millan, J.L., Farquharson, C., Shefelbine, S.J., 2014. Reference point indentation is not indicative of whole mouse bone measures of stress intensity fracture toughness. Bone 69, 174–179.
Dall'Ara, E., Karl, C., Mazza, G., Franzoso, G., Vena, P., Pretterklieber, M., Pahr, D., Zysset, P., 2013. Tissue properties of the human vertebral body sub-structures evaluated by means of microindentation. J. Mech. Behav. Biomed. Mater. 25, 23–32.
Dall'Ara, E., Schmidt, R., Zysset, P., 2012. Microindentation can discriminate between damaged and intact human bone tissue. Bone 50, 925–929, Epub 2012 Jan 2014.
Diez-Perez, A., Guerri, R., Nogues, X., Caceres, E., Pena, M.J., Mellibovsky, L., Randall, C., Bridges, D., Weaver, J.C., Proctor, A., Brimer, D., Koester, K.J., Ritchie, R.O., Hansma, P.K., 2010. Microindentation for in vivo measurement of bone tissue mechanical properties in humans. J. Bone Miner. Res. 25, 1877–1885.
Feng, L., Chittenden, M., Schirer, J., Dickinson, M., Jasiuk, I., 2012. Mechanical properties of porcine femoral cortical bone measured by nanoindentation. J. Biomech. 45, 1775–1782.
Franzoso, G., Zysset, P.K., 2009. Elastic anisotropy of human cortical bone secondary osteons measured by nanoindentation. J. Biomech. Eng. 131, 021001.
Gallant, M.A., Brown, D.M., Organ, J.M., Allen, M.R., Burr, D.B., 2013. Reference-point indentation correlates with bone toughness assessed using whole-bone tradi-tional mechanical testing. Bone 53, 301–305.
Granke, M., Coulmier, A., Uppuganti, S., Gaddy, J.A., Does, M.D., Nyman, J.S., 2014. Insights into reference point indentation involving human cortical bone: sen-sitivity to tissue anisotropy and mechanical behavior. J. Mech. Behav. Biomed. Mater. 37, 174–185.
Guerri-Fernandez, R.C., Nogues, X., Quesada Gomez, J.M., Torres Del Pliego, E., Puig, L., Garcia-Giralt, N., Yoskovitz, G., Mellibovsky, L., Hansma, P.K., Diez-Perez, A., 2013. Microindentation for in vivo measurement of bone tissue material properties in atypical femoral fracture patients and controls. J. Bone Miner. Res. 28, 162–168.
Hansma, P., Turner, P., Drake, B., Yurtsev, E., Proctor, A., Mathews, P., Lulejian, J., Randall, C., Adams, J., Jungmann, R., Garza-de-Leon, F., Fantner, G., Mkrtchyan, H., Pontin, M., Weaver, A., Brown, M.B., Sahar, N., Rossello, R., Kohn, D., 2008. The bone diagnostic instrument II: indentation distance increase. Rev. Sci. Instrum. 79, 064303.
Hansma, P., Yu, H., Schultz, D., Rodriguez, A., Yurtsev, E.A., Orr, J., Tang, S., Miller, J., Wallace, J., Zok, F., Li, C., Souza, R., Proctor, A., Brimer, D., Nogues-Solan, X., Mell-bovsky, L., Pena, M.J., Diez-Ferrer, O., Mathews, P., Randall, C., Kuo, A., Chen, C., Peters, M., Kohn, D., Buckley, J., Li, X., Pruitt, L., Diez-Perez, A., Alliston, T., Weaver, V., Lotz, J., 2009. The tissue diagnostic instrument. Rev. Sci. Instrum. 80, 054303.
Jenkins, T., Coutts, L.V., Dunlop, D.G., Oreffo, R.O., Cooper, C., Harvey, N.C., Thurner, P.J., 2015. Variability in reference point microindentation and recommendations for testing cortical bone: maximum load, sample orientation, mode of use, sample preparation and measurement spacing. J. Mech. Behav. Biomed. Mater. 42, 311–324.
Katsamenis, O.L., Jenkins, T., Thurner, P.J., 2015. Toughness and damage suscept-ibility in human cortical bone is proportional to mechanical inhomogeneity at the osteonal-level. Bone 76, 158–168.
Katz, J.L., Yoon, H.S., Lipson, S., Maharidge, R., Meunier, A., Christel, P., 1984. The effects of remodeling on the elastic properties of bone. Calcif. Tissue Int. 36 (Suppl 1), S31–S36.
Li, S., Demirci, E., Silberschmidt, V.V., 2013. Variability and anisotropy of mechanical behavior of cortical bone in tension and compression. J. Mech. Behav. Biomed. Materials. 21, 109–120.
Macione, J., Depaula, C.A., Guzelsu, N., Kotha, S.P., 2010. Correlation between longitudinal, circumferential, and radial moduli in cortical bone: effect of mineral content. J. Mech. Behav. Biomed. Mater. 3, 405–413.
Odgaard, A., 1997. Three-dimensional methods for quantification of cancellous bone architecture. Bone 20, 315–328.
Ohman, C., Baleani, M., Perilli, E., Dall'Ara, E., Tassani, S., Baruffaldi, F., Viceconti, M., 2007. Mechanical testing of cancellous bone from the femoral head: experi-mental errors due to off-axis measurements. J. Biomech. 40, 2426–2433.
Olesiak, S.E., Oyen, M.L., Ferguson, V.L., 2010. Viscous–elastic–plastic behavior of bone using Berkovich nanoindentation. Mech. Time-Depend. Mater. 14, 111–124.
Oliver, W.C., Pharr, G.M., 1992. An improved technique to determine hardness and elastic modulus using load and displacement sensing indentation experiments. J. Mater. Res. 7, 1564–1583.
Paietta, R.C., Campbell, S.E., Ferguson, V.L., 2011. Influences of spherical tip radius, contact depth, and contact area on nanoindentation properties of bone. J. Biomech. 44, 285–290.
Rasoulian, R., Raeisi Najafi, A., Chittenden, M., Jasiuk, I., 2013. Reference point indentation study of age-related changes in porcine femoral cortical bone. J. Biomech. 46, 1689–1696.
Reisinger, A.G., Pahr, D.H., Zysset, P.K., 2011. Elastic anisotropy of bone lamellae as a function offibril orientation pattern. Biomech. Model. Mechanobiol. 10, 67–77, Epub 2010 Apr 2027.
Rho, J.Y., Tsui, T.Y., Pharr, G.M., 1997. Elastic properties of human cortical and tra-becular lamellar bone measured by nanoindentation. Biomaterials 18, 1325–1330.
Rho, J.Y., Zioupos, P., Currey, J.D., Pharr, G.M., 2002. Microstructural elasticity and regional heterogeneity in human femoral bone of various ages examined by nano-indentation. J. Biomech. 35, 189–198.
Rincon-Kohli, L., Zysset, P.K., 2009. Multi-axial mechanical properties of human trabecular bone. Biomech. Model. Mechanobiol. 8, 195–208.
Roy, M.E., Rho, J.Y., Tsui, T.Y., Evans, N.D., Pharr, G.M., 1999. Mechanical and mor-phological variation of the human lumbar vertebral cortical and trabecular bone. J. Biomed. Mater. Res. 44, 191–197.
Setters, A., Jasiuk, I., 2014. Towards a standardized reference point indentation testing procedure. J. Mech. Behav. Biomed. Mater. 34, 57–65.
Turner, C.H., Chandran, A., Pidaparti, R.M., 1995. The anisotropy of osteonal bone and its ultrastructural implications. Bone 17, 85–89.
Turner, C.H., Rho, J., Takano, Y., Tsui, T.Y., Pharr, G.M., 1999. The elastic properties of trabecular and cortical bone tissues are similar: results from two microscopic measurement techniques. J. Biomech. 32, 437–441.
Wolfram, U., Wilke, H.J., Zysset, P.K., 2010. Rehydration of vertebral trabecular bone: influences on its anisotropy, its stiffness and the indentation work with a view to age, gender and vertebral level. Bone 46, 348–354.
Zioupos, P., 2005. In vivo fatigue microcracks in human bone: material properties of the surrounding bone matrix. Eur. J. Morphol. 42, 31–41.