distress : simulation-based evaluation of GHQ-30
.
White Rose Research Online URL for this paper:
http://eprints.whiterose.ac.uk/97420/
Version: Published Version
Article:
Stochl, Jan orcid.org/0000-0002-9693-9930, Böhnke, Jan R
orcid.org/0000-0003-0249-1870, Pickett, Kate E orcid.org/0000-0002-8066-8507 et al. (1
more author) (2015) Computerized adaptive testing of population psychological distress :
simulation-based evaluation of GHQ-30. Social psychiatry and psychiatric epidemiology.
ISSN 0933-7954
https://doi.org/10.1007/s00127-015-1157-4
[email protected] https://eprints.whiterose.ac.uk/
Reuse
This article is distributed under the terms of the Creative Commons Attribution (CC BY) licence. This licence allows you to distribute, remix, tweak, and build upon the work, even commercially, as long as you credit the authors for the original work. More information and the full terms of the licence here:
https://creativecommons.org/licenses/
Takedown
If you consider content in White Rose Research Online to be in breach of UK law, please notify us by
O R I G I N A L P A P E R
Computerized adaptive testing of population psychological
distress: simulation-based evaluation of GHQ-30
Jan Stochl1,4 •Jan R. Bo¨hnke1,2• Kate E. Pickett1•Tim J. Croudace1,2,3
Received: 8 June 2015 / Accepted: 13 November 2015
The Author(s) 2015. This article is published with open access at Springerlink.com
Abstract
Purpose Goldberg’s General Health Questionnaire (GHQ) items are frequently used to assess psychological distress but no study to date has investigated the GHQ-30’s potential for adaptive administration. In computerized adaptive testing (CAT) items are matched optimally to the targeted distress level of respondents instead of relying on fixed-length versions of instruments. We therefore calibrate GHQ-30 items and report a simulation study exploring the potential of this instrument for adaptive administration in a longitudinal setting.
Methods GHQ-30 responses of 3445 participants with 2 completed assessments (baseline, 7-year follow-up) in the UK Health and Lifestyle Survey were calibrated using item response theory. Our simulation study evaluated the effi-ciency of CAT administration of the items, cross-section-ally and longitudincross-section-ally, with different estimators, item selection methods, and measurement precision criteria.
Results To yield accurate distress measurements (mar-ginal reliability at least 0.90) nearly all GHQ-30 items need to be administered to most survey respondents in general population samples. When lower accuracy is permissible (marginal reliability of 0.80), adaptive administration saves
approximately 2/3 of the items. For longitudinal applica-tions, change scores based on the complete set of GHQ-30 items correlate highly with change scores from adaptive administrations.
Conclusions The rationale for CAT-GHQ-30 is only supported when the required marginal reliability is lower than 0.9, which is most likely to be the case in cross-sectional and longitudinal studies assessing mean changes in populations. Precise measurement of psychological distress at the individual level can be achieved, but requires the deployment of all 30 items.
Keywords Computerized adaptive testingItem response theoryBifactor modelMeasurement invarianceGeneral Health Questionnaire
Introduction
Goldberg’s General Health Questionnaire (GHQ) [1] items have been used frequently by population and health service researchers for measuring levels of clinically significant but non-specific psychological distress. Tens of thousands of survey respondents and patients from a variety of pop-ulations and health care settings have completed one of the four available versions with 12, 28, 30 or (rarely) 60 items [2, 3]. Simple scoring methods and cut-off scores for ‘‘caseness’’ are commonly applied and such practice has supported a large volume of studies.
A range of psychometric and technological develop-ments have taken place in educational, social survey and clinically oriented assessment research over recent dec-ades. Among the most important are those that allow for some aspect of personalization, especially if these can be aligned to methods that are efficient, reduce burden, and & Jan Stochl
1 Department of Health Sciences, University of York, Area 4,
ARRC Building, York YO10 5DD, UK
2 Hull York Medical School (HYMS), University of York,
Area 4, ARRC Building, York YO10 5DD, UK
3 School of Nursing and Health Sciences, University of
Dundee, 11 Airlie Place, Dundee DD1 4HJ, UK
4 Department of Psychiatry, University of Cambridge, Herchel
Smith Bldg, Robinson Way, Cambridge CB2 0SZ, UK Soc Psychiatry Psychiatr Epidemiol
appeal to respondents. Additionally, from a ‘‘psychometric epidemiology’’ [2] perspective two aspirations remain: (1) to integrate what can be known about individuals or pop-ulations from items across versions and (2) how to apply the item set in a manner that does not rely on the ‘‘legacy’’ or fixed-length versions [4]. In this paper, we address the second aspect by providing a full demonstration of the computerized adaptive testing (CAT) paradigm [5] as it might be adopted for GHQ-30 data or other item pools: to personalize assessments, make them more efficient, and tailor them in length and administration to the mode nee-ded for a specific implementation (e.g., pencil and paper, mobile device, desktop computer).
Although CAT originated in educational settings where the target for measurement would typically be an exami-nee’s ability level, our exposition here is in the wider setting of population health, social science, or epidemio-logical and lifestyle surveys. CAT is an approach involving computer-based administration of questionnaires using principles able to adapt the content to the score level of the person. Such adaptation is based on the concept of item information introduced in item response theory (IRT) modelling. Specifically, CAT algorithms will select and administer the most informative items for each respondent based on (1) known item characteristics obtained from prior calibration using IRT models and (2) on what is known about an individual’s level of the measured attribute (construct) from their responses to previous questions. In CAT, the required level of measurement accuracy for the target construct is usually fixed instead of fixing the number of items as in the traditional approach. CAT then selects optimal item sequences until this goal is met. As a result, typically fewer items are administered and each respondent encounters a unique set of items, with the potential benefit that the questions presented might seem more relevant to the respondent, since they are targeted closer to their distress level. These two features are syn-ergistic, hence they result in improved efficiency [6].
CAT principles have been successfully applied in mental health assessment [6–8] and were found to out-perform traditional static tests [9]. However, the increase in efficiency may in specific contexts not be sufficient to justify the added technical requirements for CAT admin-istration [9]. Fortunately, recent developments and avail-ability of open-source CAT algorithms [10–13] make its implementation easier and less costly.
The aim of our study was to evaluate the potential of CAT for the GHQ-30 item pool and to demonstrate the steps required for transition from the fixed-length test to an adaptive version, which are generally agreed [14,15]. For this purpose, we used data collected with traditional methods (i.e. paper and pencil self-completion). The structure of the study was as follows: We first followed an
established approach [14] to estimate the IRT parameters to evaluate model fit and to derive psychometric properties of items (i.e. calibrate the item pool). Building on these results, we aimed to contribute further detail on a more complex scenario: repeated adaptive administration in longitudinal studies. For this we examined how a CAT version of GHQ-30 could be used to measure change in psychological distress. We begin, however, with the usual case of a single GHQ-30 administration as is applicable to a cross-sectional study.
Methods
General Health Questionnaire (30 item version)
Goldberg’s General Health Questionnaire [1] items are typically deployed in one of four paper forms as self-completion questionnaires comprising 12, 28, 30 and 60 items. In the context of CAT feasibility evaluation, it makes sense to consider the items as a set (‘‘item bank’’) rather than any subset of items, per se. However, the 60 item version is rarely applied in current survey research and therefore no existing large enough dataset was avail-able for analysis. The largest set in common use is the GHQ-30 [16]. The GHQ-30 was developed as a shortened version of the GHQ-60, intentionally avoiding somatic items, but retaining the principle dimension of general psychological distress. The responses for all GHQ-30 items are captured on four verbally anchored categories typically scored consecutively from 1 to 4, where higher scores indicate more distress. An important feature of the GHQ-30 is its inclusion of an equal number of positively and neg-atively phrased items that have slightly different verbal anchors for their response categories. This feature has led to a debate about a so-called ‘‘methods’’ factor causing differential response behaviour between those two item sets and it is sometimes addressed in psychometric mod-elling, for example using a bifactor model [17–20].
Population sample for empirical item analysis: Health and Lifestyle Survey (HALS)
The Health and Lifestyle Survey was designed to examine the distribution of, and the relationship between, physical and mental health, health-related behaviour and social circumstances in adults of all ages and circumstances living in their own homes in all parts of Great Britain [21].
recruited and complete GHQ-30s were obtained from
n1=6317 individuals. The same sample was surveyed
again 7 years later (5352 adults, 43.0 % males, 57.0 % females, mean age=51.8, SD =16.0) where complete GHQ-30s were obtained from n2=3779 participants.
Only respondents who participated in both waves and provided complete GHQ-30 at both occasions were anal-ysed in this study (n=3445).
Steps of CAT development for measurement of change
Step 1: IRT calibration of the GHQ-30 item bank
If the aim is to migrate a paper and pencil questionnaire to an adaptive version, the number of latent factors under-pinning item responses must first be assessed and a clear understanding be obtained regarding how the items of the questionnaire relate to these factors. These questions can be answered through the assessment of fit of various factor analytic models. While fitting unidimensional models is straightforward, more complicated multidimensional structures are often required to fit the data. Such multidi-mensionality can be of two kinds: between-item, where each item loads on a single factor only, and within-item, where each item loads on multiple factors [23]. In case of the former, the traditional approach is to calibrate each cluster of items separately. In the case of the latter, the researcher needs to obtain estimates using specialized software such as MPlus [24] or using R packagesmirt[25] or lavaan [26] and subsequently converts estimates into IRT parameters.
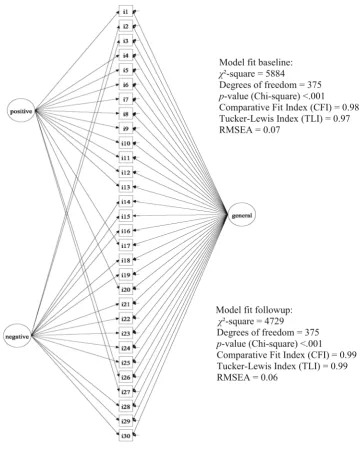
Here, we consider a more complex structure, which is consistent with a multidimensional (within-item) approach: we assume, a priori, that all GHQ-30 items contribute mainly to the measurement of a single latent dimension of ‘‘psychological distress’’. In addition to this dominant (general) factor, responses might also be influenced by methodological features such as item wording (positive and negative item wording). Several approaches have been suggested to model variance specific to methods factors [27,28] from which we chose to apply a bifactor model (see Fig.1).1
Since the dataset contained a repeat GHQ-30, we desired a common model for the baseline and follow-up data. We achieved this by specifying a structural equation model for categorical items and estimated this model in
lavaan, both for the baseline and follow-up data. Mean and
variance adjusted weighted least square (WLSMV) was used to estimate the bifactor model parameters. At this stage, the researcher’s primary interest focuses not so much on estimates (factor loadings, thresholds) but rather aims to assess model fit (though brief checking of estimates is desirable—for example to detect improper solutions such as Heywood cases [29]). The suitability of our model was confirmed via evaluation of several fit indices (see Fig.1) which showed a reasonable model fit for both occasions when estimating individual sets of parameters for each occasion [30,31].
When instruments are used across multiple sub-popu-lations or longitudinally, the issue of differential item functioning (DIF) needs to be addressed. The main aim of DIF analysis is to test whether the item characteristics are the same across sub-populations or remain unchanged over time. Absence of DIF allows comparisons of distri-butions of latent scores across populations. If DIF is present and ignored, estimation of change over time might be biased.
General methods for assessment of DIF include ordinal regression and invariance of IRT parameters. For the GHQ-30 we used iterative hybrid ordinal logistic regression approach available in R library lordif [32]. Given the rel-atively large sample size, pseudo-R2(change C0.02) was used as a criterion for DIF detection [33]. Three GHQ-30 items were flagged to show DIF (item 16: ‘‘Found life a struggle’’, pseudo-R2=0.030; item 19: ‘‘Scared or pan-icky’’, pseudo-R2=0.03; item 25: ‘‘Felt life hopeless’’, pseudo-R2=0.05).
In summary, the first step showed that the GHQ-30 can be described largely by a single dimension and apart from three items the GHQ-30 was also invariant across time (DIF). These items needed special attention in the simu-lation study as described below.
Step 2: evaluation of GHQ-30-based CAT assessment
The aim of this step was to obtain stable IRT parameters from our factor analyses (above) that could be used as input parameters for running a CAT simulation to evaluate the adaptive administration of this item bank. For a single population and cross-sectional data this can be done by obtaining the model parameters from a well-fitting model. If multiple populations or longitudinal assessments are the basis for the calibration, with the exception of the DIF items all item parameters need to be constrained over population/time points to establish measurement invari-ance. For bifactor models, general and method factor loadings need to be constrained as well as item thresholds. Items with constrained parameters serve as ‘‘anchors’’ to make latent scores comparable over time or populations. Obviously parameters of DIF items are not constrained:
1 For comparison, we also provide model fit for unidimensional
model. Baseline: v2=15133, df=405, p\0.001, CFI=0.93,
TLI=0.93, RMSEA=0.10; follow-up: v2=19806, df=405,
p\0.001, CFI=0.96, TLI=0.96, RMSEA=0.12.
this is how DIF is addressed. In our case for the three DIF items the individually estimated parameters for base-line/follow-up model were used. To summarize this step, we estimated a categorical data bifactor CFA model with WLSMV estimation using both baseline and follow-up data, and constrained loadings and thresholds to be equal over time for all but the three DIF items. Model fit for this constrained model was still acceptable (CFI=0.93, TLI=0.93, RMSEA=0.07).
When the parameters are estimated in SEM software they need to be converted into IRT parameters using the following formulae [34, 35]; for each item i =1,…,M
influenced by p=1,…,P factors, the discrimination (aip)
andkIRT thresholds (tik) on itemiare
aip¼
1:7kip ffiffiffiffiffiffiffiffiffiffiffiffiffiffiffiffiffiffiffiffiffiffiffiffiffiffi 1 PP
p¼1k 2 ip
q andtik¼
1:7sik ffiffiffiffiffiffiffiffiffiffiffiffiffiffiffiffiffiffiffiffiffiffiffiffiffiffi 1 PP
p¼1k 2 ip
q ;
wherekip is factor loading of the item on factorp,sik are the corresponding item thresholds and the scaling constant 1.7 converts estimates from the normal ogive metric of the factor model into logistic IRT metric needed for the CAT application. In the case of our bifactor model considered for the GHQ-30, each item loaded on the general (distress) factor as well as one method factor (positive or negative) and thereforeP=2. As noted previously, to eliminate the influence of item wording, we only considered and con-verted IRT estimates for the general factor. Concon-verted IRT estimates of GHQ-30 items for baseline and follow-up are
Model fit baseline: χ²-square = 5884
Degrees of freedom = 375 p-value (Chi-square) <.001
Comparative Fit Index (CFI) = 0.98 Tucker-Lewis Index (TLI) = 0.97 RMSEA = 0.07
Model fit followup: χ²-square = 4729
Degrees of freedom = 375 p-value (Chi-square) <.001
Comparative Fit Index (CFI) = 0.99 Tucker-Lewis Index (TLI) = 0.99 RMSEA = 0.06
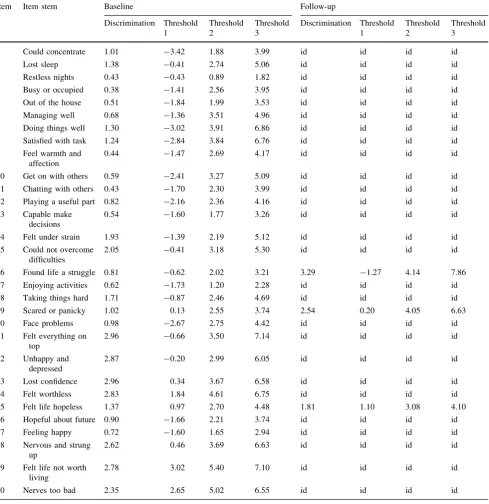
[image:5.595.184.546.55.512.2]in Table1. Note that with the exception of the DIF items (item 16, 19 and 25), item parameters are the same for baseline and follow-up.
CAT simulation
There are two ways of conducting a CAT simulation study: (a) a matrix of item parameter estimates from the IRT
[image:6.595.55.545.74.579.2]calibration is available as well as a matrix of item responses (observed or simulated) which can then be simultaneously processed during simulation. In such case, the simulation enables a researcher to evaluate the effi-ciency of the CAT approach in comparison with the tra-ditional administration of the full set of items; (b) a vector of true latent psychological distress score values of person (hs) can be provided instead of actual responses to items Table 1 IRT estimates of GHQ-30 items (in logistic metric)
Item #
Item stem Baseline Follow-up
Discrimination Threshold 1
Threshold 2
Threshold 3
Discrimination Threshold 1
Threshold 2
Threshold 3
1 Could concentrate 1.01 -3.42 1.88 3.99 id id id id
2 Lost sleep 1.38 -0.41 2.74 5.06 id id id id
3 Restless nights 0.43 -0.43 0.89 1.82 id id id id
4 Busy or occupied 0.38 -1.41 2.56 3.95 id id id id
5 Out of the house 0.51 -1.84 1.99 3.53 id id id id
6 Managing well 0.68 -1.36 3.51 4.96 id id id id
7 Doing things well 1.30 -3.02 3.91 6.86 id id id id
8 Satisfied with task 1.24 -2.84 3.84 6.76 id id id id
9 Feel warmth and affection
0.44 -1.47 2.69 4.17 id id id id
10 Get on with others 0.59 -2.41 3.27 5.09 id id id id
11 Chatting with others 0.43 -1.70 2.30 3.99 id id id id 12 Playing a useful part 0.82 -2.16 2.36 4.16 id id id id 13 Capable make
decisions
0.54 -1.60 1.77 3.26 id id id id
14 Felt under strain 1.93 -1.39 2.19 5.12 id id id id
15 Could not overcome difficulties
2.05 -0.41 3.18 5.30 id id id id
16 Found life a struggle 0.81 -0.62 2.02 3.21 3.29 -1.27 4.14 7.86 17 Enjoying activities 0.62 -1.73 1.20 2.28 id id id id
18 Taking things hard 1.71 -0.87 2.46 4.69 id id id id
19 Scared or panicky 1.02 0.13 2.55 3.74 2.54 0.20 4.05 6.63
20 Face problems 0.98 -2.67 2.75 4.42 id id id id
21 Felt everything on top
2.96 -0.66 3.50 7.14 id id id id
22 Unhappy and depressed
2.87 -0.20 2.99 6.05 id id id id
23 Lost confidence 2.96 0.34 3.67 6.58 id id id id
24 Felt worthless 2.83 1.84 4.61 6.75 id id id id
25 Felt life hopeless 1.37 0.97 2.70 4.48 1.81 1.10 3.08 4.10 26 Hopeful about future 0.90 -1.66 2.21 3.74 id id id id
27 Feeling happy 0.72 -1.60 1.65 2.94 id id id id
28 Nervous and strung up
2.62 0.46 3.69 6.63 id id id id
29 Felt life not worth living
2.78 3.02 5.40 7.10 id id id id
30 Nerves too bad 2.35 2.65 5.02 6.55 id id id id
Slightly modified item stems taken from [16]
from a completed study. Then, the simulation can be used to evaluate the efficiency of CAT administration with respect to these true latent distress score values.
We used IRT parameters from the model reported in Table1 and real item responses to GHQ-30 from the HALS study; that is we adopted method (a) from the pre-vious paragraph. Beyond evaluating the person–item match [1], our simulation setup compared different estimators (how the latent score is determined) and different item selection methods (how the next item is chosen). CAT simulations were performed usingcatIrt[10] package in R. We used three different estimators, two item selection methods and two prior distributions in our simulation study (listed in ‘‘Appendix’’). We used this design to evaluate whether combinations would have a differential effect on the administration procedure in this specific case and to shed more light on the question of whether these methods differed in practically relevant ways. Specifically, maxi-mum likelihood estimation (MLE), Bayesian modal esti-mation (BME), and expected a priori estiesti-mation (EAP) were our three choices for latent score (h) estimation. BME and EAP estimators allow for prior distributions to be specified—a useful feature when knowledge or hypotheses about the latent construct distribution in the target popu-lation are available; in this study we considered uniform and standard normal. Finally, unweighted Fisher informa-tion (UW-FI) and pointwise Kullback–Leibler divergence (FP-KL) (see [10] for details) were two item selection methods we examined. A list of settings of our simulation study is provided in ‘‘Appendix’’ (further details and sim-ulation code in R are available from the corresponding author) and options available in thecatIrtpackage from the reference manual [10]. The simulated CAT administration was set to end when (a) the preset precision for each simulee was reached (cutoff values provided in ‘‘ Ap-pendix’’) or (b) when all 30 items were administered.
We first evaluate the results by the average number of items administered to reach the desired termination criteria. In HALS, due to the two-waves of GHQ responses, we report this for both baseline and follow-up (in Table2). The results indicated that, to achieve a high level of reli-ability2[36–38] for a latent construct score ([0.9), almost all GHQ items need to be administered. This result held regardless of the method ofhestimation or item selection algorithm chosen. In a simulation scenario relevant to those who would accept a moderate level of reliability (in between levels of 0.8 and 0.9), CAT administration was shown to offer the potential to reduce the number of test
items to half (by administering only 15 of the GHQ-30 item set when the desired reliability cutoff is 0.84). If the study design can accommodate an even lower level of reliability then the results revealed that around ten items are required (in effect eliminating the need to administer two-thirds of the GHQ-30 items). This result was achieved when a reliability cutoff of 0.80 was specified in CAT.
In Table2, we also report the percentage of CAT administrations which reached the desired level of mea-surement precision. The numbers mirror the difficulty to reach high reliabilities ([0.90) with the GHQ-30 item bank, but for lower reliabilities a substantial share of the simulated assessments was above the preset cutoff. The EAP estimator with uniform prior seemed to be slightly superior but only for very high levels of measurement precision.
Some comment on the effect of the selected estimation method is also warranted: as expected, Maximum likeli-hood-based and Bayesian-basedh estimators with non-in-formative (uniform) priors appeared to be similarly effective (in fact MLE and BME with uniform prior are formally equivalent); however, the results show that choosing a normal prior distribution did contribute to greater efficiency of administration, which was evidenced by a reduction in the number of administered items. Informative (normal) priors helped to decrease the number of items even further. As a final nuance, we could also see from the scope of our current simulation evidence that information-based and Kullback–Leibler-based item selection algorithms are equally effective in this regard.
The final comment relates to the comparison of the simulation for followup versus baseline data. Interestingly, the number of administered items was slightly lower for the follow-up GHQ data. This was a direct result of larger discrimination parameters evident in the second IRT cali-bration for the three items for which longitudinal DIF was detected.
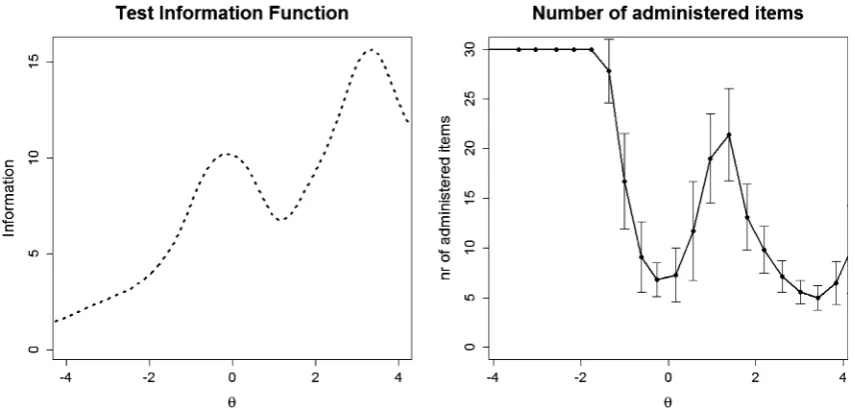
The number of items that need to be administered was not constant across the range of possibleh values but was related to information available along the measured con-tinuum. Figure 2provides a plot allowing a more detailed understanding of this patterned relationship. The left panel of Fig.2shows how the test information function depends on the latent trait level. Higher values in this graph indicate latent trait ranges (x-axis) where higher precision/smaller standard errors were achieved. Clearly, from this graph the GHQ-30 was most informative for respondents with higher levels of distress (‘‘0’’ on thex-axis representing the pop-ulation mean across both administrations). The right panel shows the mean number of administered items depending on the trait level. Especially for low levels of distress a high number of items has to be deployed, which underlines the importance of population targeting in CAT
2 For the sake of brevity, we only use term reliability in this paper
Table 2 Average number of administered items over 3445 simulated CAT administrations and (in brackets) the proportion of CAT administrations which reached the corresponding marginal reliability
hestimator Item selection Prior Marginal reliability (baseline)
0.96 0.94 0.91 0.88 0.84 0.8 0.75
MLE UW-FI – 30 (0 %) 30 (0.1 %) 28 (11.4 %) 20 (63.5 %) 13 (87.5 %) 10 (94.6 %) 8 (97.6 %)
MLE FP-KL – 30 (0 %) 30 (0.1 %) 28 (11.4 %) 20 (63.5 %) 14 (87.5 %) 10 (94.7 %) 8 (97.6 %)
BME UW-FI Uniform 30 (0 %) 30 (0.1 %) 28 (10.1 %) 21 (60.1 %) 15 (83.5 %) 11 (90.7 %) 9 (93.6 %)
BME FP-KL Uniform 30 (0 %) 30 (0.1 %) 28 (10 %) 21 (60.2 %) 15 (83.5 %) 11 (90.7 %) 9 (93.6 %)
BME UW-FI Normal 30 (0 %) 30 (0.9 %) 27 (26.6 %) 16 (82.1 %) 9 (97.2 %) 6 (99.4 %) 4 (100 %)
BME FP-KL Normal 30 (0 %) 30 (0.9 %) 27 (26.6 %) 16 (82.1 %) 9 (97.2 %) 6 (99.4 %) 4 (100 %)
EAP UW-FI Uniform 28 (7.6 %) 27 (9.8 %) 26 (15.2 %) 20 (60.5 %) 14 (87 %) 10 (95 %) 8 (98.3 %)
EAP FP-KL Uniform 28 (7.4 %) 27 (9.6 %) 26 (15.1 %) 20 (60.2 %) 14 (87 %) 10 (95 %) 8 (98.3 %)
EAP UW-FI Normal 30 (0.6 %) 30 (1.5 %) 28 (18.4 %) 17 (82 %) 10 (97 %) 7 (99.4 %) 5 (100 %)
EAP FP-KL Normal 30 (0.6 %) 30 (1.5 %) 28 (18.4 %) 17 (81.9 %) 10 (97.1 %) 6 (99.4 %) 5 (100 %)
hestimator Item selection Prior Marginal reliability (follow-up)
0.96 0.94 0.91 0.88 0.84 0.8 0.75
MLE UW-FI – 30 (0 %) 30 (3.5 %) 26 (30.5 %) 16 (78.3 %) 10 (95.2 %) 8 (97.7 %) 6 (98.5 %)
MLE FP-KL – 30 (0 %) 30 (3.5 %) 26 (30.6 %) 16 (78.4 %) 10 (95.3 %) 8 (97.7 %) 6 (98.5 %)
BME UW-FI Uniform 30 (0 %) 30 (2.2 %) 27 (26.5 %) 18 (72.2 %) 12 (89.1 %) 10 (91.5 %) 8 (92.4 %)
BME FP-KL Uniform 30 (0 %) 30 (2.2 %) 27 (26.4 %) 18 (72 %) 12 (89.1 %) 10 (91.5 %) 8 (92.4 %)
BME UW-FI Normal 30 (0 %) 29 (4.7 %) 23 (50.2 %) 12 (94.1 %) 7 (99.1 %) 5 (99.7 %) 4 (100 %)
BME FP-KL Normal 30 (0 %) 29 (4.7 %) 23 (50.2 %) 12 (94.1 %) 7 (99.1 %) 5 (99.7 %) 3 (100 %)
EAP UW-FI Uniform 27 (10.3 %) 27 (12.8 %) 25 (27.1 %) 17 (74.7 %) 11 (93.7 %) 8 (98 %) 7 (99.1 %)
EAP FP-KL Uniform 27 (10.5 %) 27 (12.8 %) 25 (27 %) 17 (74.4 %) 11 (93.6 %) 8 (97.9 %) 7 (99.1 %)
EAP UW-FI Normal 30 (1.1 %) 29 (6.1 %) 24 (46.5 %) 13 (93.1 %) 8 (98.7 %) 6 (99.7 %) 4 (99.9 %)
EAP FP-KL Normal 30 (1.1 %) 29 (6.1 %) 24 (46.4 %) 13 (93.1 %) 8 (98.7 %) 6 (99.7 %) 4 (99.9 %)
MLEmaximum likelihood,BMEBayesian modal estimation,EAPexpected A-posteriori estimation,UW-FIunweighted Fisher information,FP-KLpointwise Kullback–Leibler divergence
Soc
Psychiatry
Psychiatr
Epidemiol
administration: the larger the share of respondents with low distress levels, the larger the share of respondents for whom all items will be administered, potentially even without reaching the desired level of reliability.
Measurement of change
Change in psychological distress can be measured by
hchange¼hfollowup hbaseline
wherehbaseline and hfollowup are IRT-based h estimates on general factor for each person based on administration of whole set of GHQ-30 items. Alternatively, GHQ-30 can be
administered using CAT at both occasions. This approach introduces another way of exploiting CAT, when there are a larger number of items in the item pool. Table3 shows the correlation coefficients betweenhchangeestimates when all items of GHQ-30 are administered and the CAT alternative.
For high reliability cutoffs, all items were administered in CAT mode and thus correlations were equal or nearly equal to 1 (i.e. the utility of CAT administration was indeed negligible). As the required reliability got lower this cor-relation coefficient decreased as the difference between the number of administered items of full-length and CAT modes increased (as well as the utility of CAT). As is clear
Fig. 2 Relationship between trait levels and test information (left) and trait levels and number of administered items to reach the reliability cutoff of 0.84 (right) in CAT administration mode over 3445 simulated CAT administrations using MLE as theta estimator
[image:9.595.85.513.57.261.2]and UW-FI for item selection. Whiskers depict corresponding standard deviations. Higher values of h indicate higher levels of distress
Table 3 Correlations between change scores based on the all GHQ items and the change scores based on the number of items that need to be administered to reach a corresponding level of reliability over 3445 simulated CAT administrations
Theta estimator Item selection Prior Marginal reliability
0.96 0.94 0.91 0.88 0.84 0.80 0.75
MLE UW-FI – 1.00 1.00 0.99 0.98 0.96 0.93 0.91 MLE FP-KL – 1.00 1.00 1.00 0.98 0.96 0.93 0.91 BME UW-FI Normal 1.00 1.00 0.99 0.97 0.94 0.91 0.89 BME UW-FI Uniform 1.00 1.00 1.00 0.98 0.95 0.92 0.90 BME FP-KL Normal 1.00 1.00 0.99 0.97 0.94 0.91 0.89 BME FP-KL Uniform 1.00 1.00 1.00 0.98 0.95 0.92 0.90 EAP UW-FI Normal 1.00 1.00 0.99 0.97 0.95 0.92 0.90 EAP UW-FI Uniform 1.00 0.99 0.98 0.97 0.95 0.93 0.91 EAP FP-KL Normal 1.00 1.00 0.99 0.97 0.95 0.92 0.90 EAP FP-KL Uniform 0.99 0.99 0.98 0.97 0.95 0.93 0.91
[image:9.595.178.546.343.511.2]from Table3, even for smaller values of reliability corre-lations were generally high suggesting the close relation-ship between change scores from full-length and adaptive administration.
Discussion
Traditionally, applied health and epidemiological survey research has relied on fixed-length questionnaires to mea-sure subjective (mental) health and related constructs. Because most were developed originally as paper forms few researchers experiment with more flexible modes of administration. Fixed-length instruments are popular among researchers because of their familiarity, ease of administration, widespread use and simple scoring (tradi-tionally sum scores). In addition, any comparison of results with studies using the same set of items is straightforward. Thus, there has been little appetite for potentially more optimal administration designs, where technology is nee-ded. Traditional questionnaire surveys are often lengthy in terms of number of items, time consuming to complete, and they may therefore place a considerable burden on patients, some of which might be avoided.
This study provided GHQ-30 calibration (model fit assessment, DIF analysis, and estimation of item parame-ters) and considerations regarding adaptive administration of GHQ-30 over time in longitudinal studies. The simula-tion showed that the adaptive administrasimula-tion of the GHQ-30 becomes useful when the required reliability is approximately 0.84 or lower. In that case, a CAT admin-istration would deploy, on average, only half (or less) of the 30 items. Our simulation showed, however, that the utility of CAT depends also on the respondent’s distress level. For individuals with little distress, all, or nearly all items are deployed.
Various h estimators and item selection methods have recently become available in CAT. We selected frequently used options and in terms of efficiency, results suggested similar performance of most of them. However, an infor-mative (standard normal) prior helped to further reduce the number of items, especially for lower reliabilities. Researchers should be cautious when specifying informa-tive priors though, as priors not corresponding with the population distribution may have adverse effects on the number of administrated items [39].
The GHQ-30 was developed as a screening measure to be used by epidemiology, health science and mental health researchers. ‘‘Screening’’ describes two different strategies with different consequences for the usefulness of CAT administrations. In the first strategy, a short test is applied to a large population to identify (groups of) at-risk respondents who might be subject to further (typically
longer and/or more expensive) diagnostic tests. For this strategy, screening tests do not necessarily need to be highly precise. Instead they need to be valid, show high correlations with the disorder in question, for example gauged by sensitivity, specificity or predictive values. The reliability of 0.84 mentioned in the previous paragraph can typically be considered as sufficient for such purposes and an adaptive version of GHQ-30 may be an improvement over traditional modes of administration. The second strategy uses the test itself to identify whether an individual respondent may have an unrecognized disorder. For such applications, a highly reliable test is needed to allow for clear decisions about whether an individual is above or below a relevant severity threshold. For this, the confidence interval around the individual severity level or the relevant threshold needs to be small: this decreases the number of cases for which the severity threshold is included in the confidence interval around the individual’s severity level (or the severity level lies within the interval around the threshold, respectively) [3,38]. A reliability of 0.84 seems rather low for such decisions. These considerations high-light the important role both measurement accuracy as well as validity play in such assessments. Both strategies rest on the assumption that the test is valid in general (appropriate sensitivity, specificity, predictive values).
For both strategies, reliable data on costs associated with the different screening decisions can help to optimise the process. But only the first strategy would allow combining the CAT algorithm with further selection rules, such as choosing the most predictive items, since trading off reli-ability in favour of validity might be an option, while it would not be for the second strategy.
Our study suggests that the utility of adaptive adminis-tration of GHQ-30 items is problematic for the measure-ment of individual change in longitudinal studies as high reliability is required and all or nearly all items need to be deployed. However, for an assessment of group-level changes in distress, the (random) bias in individual distress change scores cancel out and thus CAT administration may still be a viable option. In addition, the correlations in Table3 suggest highly similar changes in distress levels (apart from possible linear drifts), captured by either the complete set of GHQ-30 items or the CAT administration, even for low reliability cutoffs (for which considerably fewer items are administered).
An additional potential benefit of CAT administration in longitudinal studies is that respondents measured over time are likely to be exposed to different items (from the same instrument/item pool) at each time they are assessed, whilst keeping the metric of person estimates comparable. This is potentially useful design science, for app-based or web-based data collections [40]. With the recent intro-duction of mobile devices that increase the frequency of
assessment, and perhaps add a new dimension of user-friendliness to questionnaire item delivery, a principled approach to the use of a large item bank could avoid item fatigue or compromise due to over-exposure and thus might help with respondents’ engagement. Obviously, such benefit is suppressed if all or nearly all items are administered. As noted above, CAT algorithms would administer nearly all GHQ-30 items at each occasion to capture individual changes in distress reliably. In sum-mary, CAT administration of GHQ-30 in longitudinal studies which aim to evaluate individual changes would do no harm but may lack utility.
One limitation of this study is thathbaseline andhfollowup estimates based on the complete set of GHQ-30 items are point estimates and thus not true values of h. Therefore
hchange is not true change and therefore is associated with standard error of measurement. This may limit the size and interpretation of correlations in Table3. However, the uncertainty accompanied with the point estimates ofhs is
symmetric and therefore it tends to cancel out in large samples as the one used here.
An additional limitation of our simulation is that we have not considered additional CAT parameters such as item exposure control (meaning whether the researcher wants to restrict or balance any administration profile for the item set or subsets) or the termination criteria (when the CAT stops administering items, e.g. the precision of latent
h). In principle, we had no a priori reason with this GHQ item set to control the frequency of any item selection. However, it is worth acknowledging that one concern in CAT is that the standard specifications tend to result in the most informative items being selected too often and the least informative most rarely and therefore item exposure control issues might need to be thought through further in practical applications of adaptive GHQ-30 administrations [4].
As a final limitation, one could argue that the technical resources needed for any CAT application in survey practice might prove to be a barrier to implementation, but while this is certainly a limitation in settings where assessments are not routinely administered on electronic devices, this is not true for surveys. Population surveys usually employ computer-assisted personal interviewing (CAPI) techniques, i.e. elec-tronic devices, to document interviewer—as well as self-rated responses [41]. Their costs were initially discussed controversially [42], but among others the reduced resour-ce use in survey post-proresour-cessing and the increased quality of the collected data led to today’s wide-spread use of these techniques. In addition, open-source CAT algorithms have become available [10–13]. Their integration into CAPI systems is possible and is still a largely untapped resource [42,43].
In conclusion, GHQ-30 can be adapted for CAT administration for screening populations. In settings that are usually not interested in individual diagnostic assess-ments the adaptive presentation can shorten the GHQ-30 considerably and still produce useful estimates of psycho-logical distress for group comparisons. These benefits can be realized in cross-sectional as well as longitudinal sur-veys. For the assessment of individual changes in distress over time, however, CAT administration may lack utility as nearly all items are administered to reach satisfactory reliability of change scores.
Acknowledgments Data from these secondary data analyses of the HALS sample were supplied by the UK Data Archive (study numbers SN2218 and SN3279). JS and KP were funded by the Medical Research Council (MRC award reference MR/K006665/1 to the Health eResearch Centre (HeRC) at the University of Manchester for work conducted at the University of York).
Compliance with ethical standards
Conflict of interest TJC reports grants from GL Assessment (2008–2011) held whilst at the University of Cambridge (with Prof J Rust) for an ability test standardization project (BAS 3) outside the present work. TJC and JS report a personal fee from GL Assessment for psychometric calibration of the BAS3 (ability tests) outside the submitted work. GL Assessment market and distribute the General Health Questionnaire.
Open Access This article is distributed under the terms of the Creative Commons Attribution 4.0 International License (http://crea tivecommons.org/licenses/by/4.0/), which permits unrestricted use, distribution, and reproduction in any medium, provided you give appropriate credit to the original author(s) and the source, provide a link to the Creative Commons license, and indicate if changes were made.
Appendix: Setup details of CAT simulation
1. h estimators: maximum likelihood estimation (MLE); Bayesian modal estimation (BME); expected a poste-riori estimation (EAP).
2. Item selection methods: unweighted Fisher informa-tion (UW-FI); pointwise Kullback–Leibler divergence between [P±delta], where P is either the current h
estimate or a classification bound (FP-KL). For details please see [10].
3. Prior distribution of h (only for BME and EAP): (standard) normal; uniform.
4. Termination criteria (whichever comes first): (a) Preci-sion thresholds (marginal reliability): 0.96; 0.94; 0.91; 0.88; 0.84; 0.80; 0.75 or (b) all items are administered. 5. Initialhstarting values: random draws fromU(-1, 1). 6. Number of items selected for starting portion of
7. Number of top items from which the function randomly selects next item at initial and middle portion of CAT: 1 (i.e. the most informative item is selected).
References
1. Goldberg DP, Hillier VF (1979) A scaled version of the General Health Questionnaire. Psychol Med 9(1):139–145
2. Bo¨hnke JR, Croudace TJ (2015) Factors of psychological dis-tress: clinical value, measurement substance, and methodological artefacts. Soc Psychiatry Psychiatr Epidemiol 50(4):515–524 3. Emons WH, Sijtsma K, Meijer RR (2007) On the consistency of
individual classification using short scales. Psychol Methods 12(1):105
4. Stocking ML, Lewis C (2000) Methods of controlling the expo-sure of items in CAT. In: Computerized adaptive testing: theory and practice. Springer, Netherlands, pp 163–182
5. Wainer H, Dorans NJ, Flaugher R, Green BF, Mislevy RJ (2000) Computerized adaptive testing: a primer. Lawrence Erlbaum Associates, Hillsdale, NJ
6. Fliege H, Becker J, Walter OB, Bjorner JB, Klapp BF, Rose M (2005) Development of a computer-adaptive test for depression (D-CAT). Qual Life Res 14(10):2277–2291. doi: 10.1007/s11136-005-6651-9
7. Gibbons RD, Weiss DJ, Pilkonis PA, Frank E, Moore T, Kim JB, Kupfer DJ (2014) Development of the CAT-ANX: a computer-ized adaptive test for anxiety. Am J Psychiatry 171(2):187–194. doi:10.1176/appi.ajp.2013.13020178
8. Gibbons RD, Weiss DJ, Pilkonis PA, Frank E, Moore T, Kim JB, Kupfer DJ (2012) Development of a computerized adaptive test for depression. Arch Gen Psychiatry 69(11):1104–1112 9. Choi S, Reise S, Pilkonis P, Hays R, Cella D (2010) Efficiency of
static and computer adaptive short forms compared to full-length measures of depressive symptoms. Qual Life Res 19(1):125–136. doi:10.1007/s11136-009-9560-5
10. Nydick SW (2014) catIrt: an R package for simulating IRT-based computerized adaptive tests. R package version 0.4-2. http:// CRAN.R-project.org/package=catIrt. Accessed 7 Oct 2015 11. Magis D, Raıˆche G (2012) Random generation of response
pat-terns under computerized adaptive testing with the R package catR. J Stat Softw 48(8):1–31
12. Chalmers RP (2015) mirtCAT: computerized adaptive testing with multidimensional item response theory. R package version 0.6.1. http://CRAN.R-project.org/package=mirtCAT. Accessed 15 Oct 2015
13. The Psychometric Centre (2015) Concerto platform for the development of on-line adaptive tests. University of Cambridge.
http://www.psychometrics.cam.ac.uk/newconcerto. Accessed 9 Nov 2015
14. Walter OB, Holling H (2008) Transitioning from fixed-length questionnaires to computer-adaptive versions. Zeitschrift fu¨r Psychologie/J Psychol 216(1):22–28
15. Walker J, Bo¨hnke JR, Cerny T, Strasser F (2010) Development of symptom assessments utilising item response theory and com-puter-adaptive testing–a practical method based on a systematic review. Crit Rev Oncol Hematol 73(1):47–67. doi:10.1016/j.cri trevonc.2009.03.007
16. Huppert FA, Walters DE, Day NE, Elliott BJ (1989) The factor structure of the General Health Questionnaire (GHQ-30). A reliability study on 6317 community residents. Br J Psychiatry 155:178–185
17. Wang W-C, Chen H-F, Jin K-Y (2014) Item response theory models for wording effects in mixed-format scales. Educ Psychol Meas. doi:10.1177/0013164414528209
18. Hankins M (2008) The factor structure of the twelve item General Health Questionnaire (GHQ-12): the result of negative phrasing? Clin Pract Epidemiol Ment Health 4(1):10
19. Romppel M, Braehler E, Roth M, Glaesmer H (2013) What is the General Health Questionnaire-12 assessing?: Dimensionality and psychometric properties of the General Health Question-naire-12 in a large scale German population sample. Compr Psychiatry 54(4):406–413. doi:10.1016/j.comppsych.2012.10. 010
20. Ye S (2009) Factor structure of the General Health Questionnaire (GHQ-12): the role of wording effects. Pers Indiv Differ 46(2):197–201. doi:10.1016/j.paid.2008.09.027
21. Cox BD (1984–1985) Health and lifestyle survey. UK Data Archive, Colchester, Essex
22. Cox BD (1991–1992) Health and lifestyle survey: seven-year follow-up. UK Data Archive, Colchester, Essex
23. Hartig J, Ho¨hler J (2008) Representation of competencies in multidimensional IRT models with within-item and between-item multidimensionality. Zeitschrift fu¨r Psychologie/J Psychol 216(2):89–101. doi:10.1027/0044-3409.216.2.89
24. Muthe´n LK, Muthe´n BO (1998–2010) Mplus user’s guide, 6th edn. Muthe´n & Muthe´n, Los Angeles, CA
25. Chalmers RP (2012) mirt: a multidimensional item response theory package for the R Environment. J Stat Softw 48(6):1–29 26. Rosseel Y (2012) lavaan: an R package for structural equation
modeling. J Stat Softw 48(2):1–36
27. Pohl S, Steyer R (2010) Modeling common traits and method effects in multitrait-multimethod analysis. Multivar Behav Res 45(1):45–72
28. Geiser C, Lockhart G (2012) A comparison of four approaches to account for method effects in latent state–trait analyses. Psychol Methods 17(2):255–283
29. Dillon WR, Kumar A, Mulani N (1987) Offending estimates in covariance structure analysis: comments on the causes of and solutions to Heywood cases. Psychol Bull 101(1):126–135. doi:10.1037/0033-2909.101.1.126
30. Hu L, Bentler MP (1999) Cutoff criteria for fit indexes in covariance structure analysis: conventional criteria versus new alternatives. Struct Equ Model 6(1):1–55
31. Hooper D, Coughlan J, Mullen M (2008) Structural equation modelling: guidelines for determining model fit. El J Bus Res Method 6(1):53–60
32. Choi SW, Gibbons LE, Crane PK (2011) lordif: an R package for detecting differential item functioning using iterative hybrid ordinal logistic regression/item response theory and monte carlo simulations. J Stat Softw 39(8):1–30
33. Zumbo BD (1999) A handbook on the theory and methods of differential item functioning (DIF): logistic regression modeling as a unitary framework for binary and likert-type (ordinal) item scores. Directorate of Human Resources Research and Evalua-tion, Department of National Defense, Ottawa
34. Reise SP (2012) The rediscovery of bifactor measurement mod-els. Multivar Behav Res 47(5):667–696. doi:10.1080/00273171. 2012.715555
35. McDonald RP (1999) Test theory: a unified treatment. Lawrence Erlbaum Associates Inc, Mahwah
36. Dimitrov DM (2003) Marginal true-score measures and reliability for binary items as a function of their IRT parameters. Appl Psychol Meas 27(6):440–458. doi:10.1177/0146621603258786
37. Green BF, Bock RD, Humphreys LG, Linn RL, Reckase MD (1984) Technical guidelines for assessing computerized adaptive tests. J Educ Meas 21(4):347–360. doi:10.2307/1434586
38. Bo¨hnke JR, Lutz W (2014) Using item and test information to optimize targeted assessments of psychological distress. Assess-ment 21(6):679–693. doi:10.1177/1073191114529152
39. van der Linden WJ, Glas CAW (eds) (2010) Elements of adaptive testing. Springer, New York
40. Cooper C, Cooper S, del Junco D, Shipp E, Whitworth R, Cooper S (2006) Web-based data collection: detailed methods of a ques-tionnaire and data gathering tool. Epidemiol Perspect Innov 3(1):1 41. Blair J, Czaja RF, Blair EA (2014) Designing surveys: a guide to
decisions and procedures, 3rd edn. Sage, Los Angeles
42. Leeuw Ed, Hox J, Snijkers G (1995) The effect of computer-assisted interviewing on data quality. J Mark Res Soc 37(4):325–344