Review and synthesis
Dynamics of global forest area: Results from the FAO Global Forest
Resources Assessment 2015
q
Rodney J. Keenan
a,⇑, Gregory A. Reams
b, Frédéric Achard
c, Joberto V. de Freitas
d, Alan Grainger
e,
Erik Lindquist
fa
School of Ecosystem and Forest Sciences, University of Melbourne, 221 Bouverie St, Carlton, Vic 3053, Australia
b
USDA Forest Service, National Office, 1601 North Kent Street, Suite 400, Arlington, VA 22209, USA
c
European Commission Joint Research Centre, Via Enrico Fermi 2749, I-21027 Ispra, VA, Italy
dBrazilian Forest Service, Ministry of Environment, SCEN, AV. L4, Trecho 2, Bloco H, Brasília-DF 70818-900, Brazil e
School of Geography, University of Leeds, Leeds LS2 9JT, UK
f
UN Food and Agriculture Organization, Viale delle Terme di Caracalla, 00153 Rome, Italy
a r t i c l e
i n f o
Article history:
Received 7 January 2015
Received in revised form 9 June 2015 Accepted 9 June 2015
Available online 7 September 2015
Keywords:
Forest Deforestation Forest transition Land use Land cover Remote sensing
a b s t r a c t
The area of land covered by forest and trees is an important indicator of environmental condition. This study presents and analyses results from the Global Forest Resources Assessment 2015 (FRA 2015) of the Food and Agriculture Organization of the United Nations. FRA 2015 was based on responses to sur-veys by individual countries using a common reporting framework, agreed definitions and reporting standards. Results indicated that total forest area declined by 3%, from 4128 M ha in 1990 to 3999 M ha in 2015. The annual rate of net forest loss halved from 7.3 M ha y 1 in the 1990s to
3.3 M ha y 1between 2010 and 2015. Natural forest area declined from 3961 M ha to 3721 M ha between
1990 and 2015, while planted forest (including rubber plantations) increased from 168 M ha to 278 M ha. From 2010 to 2015, tropical forest area declined at a rate of 5.5 M ha y 1– only 58% of the rate in the
1990s – while temperate forest area expanded at a rate of 2.2 M ha y 1. Boreal and sub-tropical forest
areas showed little net change. Forest area expanded in Europe, North America, the Caribbean, East Asia, and Western-Central Asia, but declined in Central America, South America, South and Southeast Asia and all three regions in Africa. Analysis indicates that, between 1990 and 2015, 13 tropical countries may have either passed through their forest transitions from net forest loss to net forest expansion, or continued along the path of forest expansion that follows these transitions. Comparing FRA 2015 statis-tics with the findings of global and pan-tropical remote-sensing forest area surveys was challenging, due to differences in assessment periods, the definitions of forest and remote sensing methods. More invest-ment in national and global forest monitoring is needed to provide better support for international ini-tiatives to increase sustainable forest management and reduce forest loss, particularly in tropical countries.
Ó2015 Published by Elsevier B.V. This is an open access article under the CC BY-NC-ND license (http:// creativecommons.org/licenses/by-nc-nd/4.0/).
Contents
1. Introduction . . . 10
2. Methods . . . 10
3. Results. . . 11
3.1. The distribution of forest area . . . 11
3.2. Global and regional trends in forest area . . . 11
3.3. Trends by climatic domain . . . 12
3.4. Trends by income category. . . 12
http://dx.doi.org/10.1016/j.foreco.2015.06.014 0378-1127/Ó2015 Published by Elsevier B.V.
This is an open access article under the CC BY-NC-ND license (http://creativecommons.org/licenses/by-nc-nd/4.0/).
q
This article is part of a special issue entitled ‘‘Changes in Global Forest Resources from 1990 to 2015’’.
⇑ Corresponding author.
E-mail addresses:[email protected](R.J. Keenan),[email protected](G.A. Reams),[email protected](F. Achard),joberto.freitas@florestal.gov.br (J.V. de Freitas),[email protected](A. Grainger),[email protected](E. Lindquist).
Contents lists available atScienceDirect
Forest Ecology and Management
3.5. National trends . . . 12
3.6. Data quality . . . 12
4. Analysis. . . 13
4.1. The implications of FRA 2015 statistics for trends in deforestation. . . 13
4.2. Implications for modeling human impacts on forests. . . 13
4.3. Uncertainties about trends in forest area . . . 15
4.4. Comparison of the findings of FRA 2015 and remote sensing studies . . . 16
5. Conclusions. . . 19
Acknowledgements . . . 19
Appendix A. Supplementary material . . . 19
References . . . 19
1. Introduction
Reliable information on global trends in forest area is of great help to international agencies, governments, non-governmental organizations and the commercial sector when they make deci-sions on policies and investment, and to scientists whose research also informs these decisions. The first global forest assessment was undertaken by the US Government early in the 20th Century (Zon, 1910; Zon and Sparhawk, 1923). However, regular global assess-ments had to wait until the Food and Agriculture Organization of the United Nations (FAO) was established in 1945. FAO published statistics on global forest resources every five years from 1948 to 1963 in its World Forest Inventory series. It launched a new series of Forest Resources Assessments (FRAs) in 1980 that were initially limited to the tropics (Lanly, 1981; FAO, 1982, 1993). Subsequent assessments for 1990, 2000, 2005 and 2010 have had global cover-age (FAO, 1995, 2001, 2006, 2010).
Statistics contained in FRAs have supported decision making by various international bodies. These include FAO itself, the UN Framework Convention on Climate Change (UNFCCC), the Convention on Biological Diversity, the UN Convention to Combat Desertification, and the UN Forum on Forests. Concerns in the UNFCCC about the role of forests in global climate change have led to negotiations on a mechanism for Reducing Emissions from Deforestation and Degradation and the role of conservation, sus-tainable management of forests and enhancement of forest carbon stocks in developing countries (REDD+) (UNFCCC, 2014), and to the recent New York Declaration on Forests (UN, 2014). FRA statistics have also been of value in many scientific studies, most recently on forest and agricultural land dynamics (Ausubel et al., 2012), dri-vers of deforestation (Hosonuma et al., 2012), environmental sus-tainability (Arrow et al., 2012) and the carbon cycle (Le Quere et al., 2009; Smith et al., 2014).
Deforestation, particularly in the tropics, was a major concern of FRAs 1980 and 1990 (Holmgren and Persson, 2002). As the ben-efits expected from forests have increased over time, the focus of FRAs has diversified to assess the status and supply of a wider range of forest ecosystem services. However, debate continues about the breadth of variables that should be assessed in FRAs, given the limited resources made available to undertake the assessments (Matthews and Grainger, 2002). FRAs rely heavily on information supplied by governments in response to FAO question-naires, and the lack of up to date and comprehensive national for-est inventories in developing countries on which these responses are based has raised concerns about the accuracy of the resulting statistics on forest area change (Grainger, 2008). It has also led to proposals for improving global forest monitoring for REDD+ by making better use of satellite images (Baker et al., 2010; Grainger and Obersteiner, 2011).
This paper presents and analyses the findings on global trends in forest area between 1990 and 2015 reported in the Global Forest Resources Assessment 2015 (FRA 2015) (FAO, 2015; MacDicken, 2015). The remainder of the paper is in three main
sections: Section2summarizes the methods used to estimate val-ues of FRA statistics; Section3provides an overview of FRA 2015 results; and Section4analyses these findings to assess their signif-icance for our understanding of recent trends in global forest area and what has caused them.
2. Methods
FAO’s Global Forest Resources Assessments (FRAs) continue to rely on the submission of national data by governments, but the methods used for this have changed over time. Sending question-naires to countries, the same method used for the World Forest Inventories, was found to have limitations. Since FRA 2005, FAO has devolved most statistical estimation to the National Correspondents (NCs) who supply information on behalf of govern-ments, giving them instructions in detailed guidance documents on how to submit information using a common reporting frame-work (e.g.FAO, 2013a,b).
The two main categories of tree cover for which statistics are reported in this paper are ‘forest’ and ‘other wooded land’. Since FRA 2000, all countries in the world have been asked to use a com-mon definition of ‘forest’, as land of at least 0.5 ha covered by trees higher than 5 m and with a canopy cover of more than 10%, or by trees able to reach these thresholds, and predominantly under for-est land use. This excludes land that is mainly under agricultural or urban land uses. The FAO definition of ’forest’ is essentially a land-use based definition, and it differs from other definitions of forest which rely solely on the presence or absence of tree cover, and from legal definitions based on topographic or other factors (Lund, 1999, 2002). It includes areas of land that may be temporar-ily unstocked with trees but are still intended for forestry or con-servation use. It also combines natural forest and planted forest, the latter including intensively managed forest plantations. ’Other wooded land’ describes land of at least 0.5 ha that is covered by trees higher than 5 m, and either the tree canopy cover is 5–10%, or the total cover of trees, shrubs and bushes exceeds 10% (FAO, 2010).
Three key questions asked in FRA 2015 that are relevant to for-est area concern:
1. The areas of forest and other wooded land. Forest area was also reported in the categories of primary forest, other naturally regenerated forest, and planted forest.
2. The rate of forest expansion, which was subdivided, where pos-sible, into the natural expansion of forest, and human-induced afforestation.
3. The rate of forest loss.
were provided byFAO (2013b). To facilitate the reporting process, FAO pre-filled the tables with data for 1990–2010 from FRA 2010 (FAO, 2013a), a practice introduced in FRA 2010. If better estimates had since become available, NCs were instructed to update infor-mation from previous years, using the interpolation and extrapola-tion methods employed in previous FRAs. All values for 2015 were estimated by NCs using extrapolation, generally based on a linear projection from previous data. Further details on the methods used for FRA 2015 may be found inMacDicken (2015).
FRA 2015 received responses from 155 countries, and 79 desk studies were conducted for the remaining countries and territories, giving information for a total of 234 individual countries and terri-tories. Data sources used by countries to report forest area included official government statistics, ground-based forest and vegetation inventories, remote sensing-based studies, published and refereed studies, ’gray literature’ reports and expert opinion. Countries were asked to report on the quality of their data for each variable using a three tier system: Tier 1 data were considered the least reliable and Tier 3 data the most reliable (MacDicken, 2015). Countries were classified into four climatic domains: Boreal, Temperate, Subtropical and Tropical (FAO, 2013a). If a country’s national boundaries encompassed more than one climatic domain, the country was assigned to the domain occupying the largest for-est area of the country (Table S1). Countries were also divided into 12 ‘sub-regions’, based on breakdowns of FAO regional groupings; and into income categories according to the World Bank country lending group designation (MacDicken, 2015).
The methods used for the analysis of FRA findings in Section4
are outlined inSupplementary Material.
3. Results
This section provides an overview of the most important find-ings of FRA 2015 on trends in forest area between 1990 and 2015.
3.1. The distribution of forest area
In 2015 forest covers 3999 M ha globally. This is equivalent to 31% of global land area, or 0.6 ha for every person on the planet. A further 1204 M ha are covered by other wooded land (Table 1).
Forty-four per cent of global forest area is found in countries classified as tropical and another 8% is in sub-tropical countries. Temperate countries account for 26% of global forest area and bor-eal countries for 22% (Table 1). Europe (including the Russian Federation) has more forest than any other geographical sub-region (25%), followed by South America (21%) and North America (16%) (Table 2). Three quarters of all forest is in high income and upper middle income countries, with just 25% of the total in countries classified as having lower middle or low income (Table 3). The proportion of other wooded land in the tropics (43%) is similar to that for forest in the tropics, but there are proportion-ally greater areas of other wooded land in the sub-tropical and temperate domains (Table 1).
Ten countries – the Russian Federation, Brazil, Canada, the USA, China, Democratic Republic of Congo, Australia, Indonesia, Peru and India – account for 67% of total forest area. Six countries or ter-ritories – Aruba, the Faroe Islands, Greenland, Guernsey, Malta and Norfolk Island – reported zero forest cover, and there are no entries for ten other countries or territories which also have little forest (Table S2) (FAO, 2015).
3.2. Global and regional trends in forest area
Overall, there was a net decrease in global forest area of 3% between 1990 and 2015, from 4128 M ha to 3999 M ha, with nat-ural and human-induced deforestation being offset by increases in forest area that had both natural and human causes (Table 1). The annual rate of net forest losshalvedover the 25 year period, falling from 7.3 M ha y 1 in the 1990s to 4.6 M ha y 1 between
2000 and 2005, and to 3.4 M ha y 1and 3.3 M ha y 1for 2005–10
and 2010–15, respectively (Table 4). While this reduced rate of net forest loss is encouraging, it shouldnotbe regarded as equiva-lent to reduced rates of human-induced deforestation (see Section4).
Primary forest accounts for a third of total forest area (see
Morales et al., 2015), and increased slightly from 1200 M ha in 1990 to 1282 M ha in 2015, mainly because more countries sub-mitted data for this statistic. Primary forest, which is regarded as undisturbed by human beings, is often reclassified as ’Other natu-rally regenerated forest’ after disturbance, though entries for this statistic are also incomplete, and it has changed little, from
Table 1
Forest and other wooded land from 1990 to 2015 in different global climatic domains (K ha) (FAO, 2015). Note that domains are determined by country classification into a domain and all forests in the country are included in that domain. All totals involve rounding.
Forest area (K ha) Other wooded land area (K ha)
Domain 1990 2000 2005 2010 2015 1990 2000 2005 2010 2015
Boreal (inc. polar) 1,219,309 1,219,820 1,218,856 1,224,873 1,224,452 121,212 117,735 119,590 121,999 121,187
Temperate 617,997 640,892 659,176 673,429 684,468 157,582 154,534 159,568 163,737 167,255
Sub tropical 325,421 324,777 323,912 319,613 320,057 150,132 149,090 151,391 150,602 399,094
Tropical 1,965,542 1,870,112 1,830,799 1,797,757 1,770,156 549,529 533,090 523,143 537,825 516,935 Grand total 4,128,269 4,055,602 4,032,743 4,015,673 3,999,134 978,454 954,448 953,692 974,163 1,204,471
Table 2
The trend in forest area from 1990 to 2015 by sub-region (K ha) (FAO, 2015). All totals involve rounding.
Sub-region 1990 2000 2005 2010 2015
Central America
26,995 23,448 22,193 21,010 20,250
Caribbean 5,017 5,913 6,341 6,745 7,195
East Asia 209,198 226,815 241,841 250,504 257,047 East-Southern
Africa
319,785 300,273 291,712 282,519 274,886
Europe 994,271 1,002,302 1,004,147 1,013,572 1,015,482 North Africa 39,374 37,692 37,221 37,055 36,217 North
America
720,487 719,197 719,419 722,523 723,207
Oceania 176,825 177,641 176,485 172,002 173,524 South
America
930,814 890,817 868,611 852,133 842,011
South-Southeast Asia
319,615 298,645 296,600 295,958 292,804
West-Central Africa
346,581 332,407 325,746 318,708 313,000
West-Central Asia
39,309 40,452 42,427 42,944 43,511
2312 M ha to 2329 M ha between 1990 and 2015. Other wooded land area changed little between 1990 (979 M ha) and 2010 (974 M ha), but then rose sharply to 1204 M ha in 2015. A number of countries exhibited relatively sharp rises or declines in their areas of other wooded land between 2010 and 2015, probably aris-ing from difficulties faced in applyaris-ing uniformly the percentage tree cover thresholds in FAO’s definitions of forest and other wooded land (Gabler et al., 2012). However, the main reason appears to be a 165% rise in the area of sub-tropical other wooded land from 151 M ha to 399 M ha (Table 1), following the report by Australia of an area of other wooded land in 2015 that is twice its forest area and virtually identical to this increment (Table S2).
Half of global forest area is in sub-regions where forest cover is expanding: Europe, North America, the Caribbean, East Asia, and West and Central Asia. The remainder is in sub-regions where for-est area continues to decline: Central America, South America, South and Southeast Asia and all three sub-regions in Africa. Oceania (dominated in area by Australian forests) showed periods of gains and losses in forest area between 1990 and 2015 (Table 2).
3.3. Trends by climatic domain
Trends also vary by climatic domain (Table 1). Between 1990 and 2015 tropical forest area declined by 195 M ha from 1966 M ha to 1770 M ha, though the net rate of loss decreased over time, from 9.5 M ha y 1in the 1990s to 7.2 M ha y 1in the 2000s
and to 5.5 M ha y 1 from 2010 to 2015. Over the 25 year period, forest in temperate countries increased by 67 M ha, at an average of 2.7 M ha y 1, but forest in the sub-tropical and boreal domains
showed little change (Table 4).
3.4. Trends by income category
In high income countries, forest area showed a small increase of about 0.05% y 1 over the 25 year period. Forest area in upper
middle income countries declined at 0.14% y 1in the 1990s, but
this halved to 0.07% y 1 in the 2000s, and between 2010 and
2015 it was relatively stable. In lower middle and low income countries forest area continues to decline: both groups of countries exhibited high loss rates of about 0.6% y 1in the 1990s, but while
this rate has been maintained in low income countries it halved to about 0.3% y 1 between 2000 and 2015 in lower middle income
countries (Table 3).
3.5. National trends
At the national scale, net loss of forest area between 2010 and 2015 for countries in South America was dominated by Brazil (984 K ha y 1), but there were also significant net losses in
Paraguay (325 K ha y 1), Argentina (297 K ha y 1), Bolivia
(289 K ha y 1) and Peru (187 K ha y 1) (Table S2). In South and Southeast Asia, the rate of net forest loss was greatest in Indonesia (684 K ha y 1), followed by Myanmar, where the loss
rate of 546 K ha y 1between 2010 and 2015 was 25% higher than in the 1990s. In Africa, the greatest net losses in forest area between 2010 and 2015 were in Nigeria (410 K ha y 1), Tanzania
(372 K ha y 1), Zimbabwe (312 K ha y 1) and Democratic Republic of Congo (311 K ha y 1).
The net rate of forest loss has significantly declined in some countries. For example, in Brazil, the net loss rate between 2010 and 2015 was only 40% of the rate in the 1990s. Indonesia’s net loss rate has also dropped by two thirds, from 1.9 M ha y 1in the 1990s
to 684 K ha y 1from 2010 to 2015, while the rate in Mexico has
halved from 190 K ha y 1 in the 1990s to 92 K ha y 1 between
2010 and 2015.
Other countries have reported a net rise in forest area between 2010 and 2015. China has the highest rate of expansion (1.5 M ha y 1), though this is only 63% of the corresponding rate
in the 2000s. Forest area increased rapidly in the last five years in Chile (301 K ha y 1), the USA (275 K ha y 1), the Philippines (240 K ha y 1), Lao People’s Democratic Republic (189 K ha y 1),
India (178 K ha y 1), Vietnam (129 K ha y 1) and France
(113 K ha y1). There was a net increase in forest area of
308 K ha y 1 in Australia between 2010 and 2015 but, reflecting
the variability of climate in this country, this followed a net loss of 563 K ha y 1in the 2000s, caused by a mixture of drought, fire
and human clearance.
3.6. Data quality
Estimates of about 60% of global forest area in 2015 are reported to be based on data of the highest (Tier 3) quality (Table 5). This is supported by an analysis of data sources listed in FRA 2015 Country Reports for 99 tropical countries (Romijn et al., 2015), which implies that 54 countries now have good or very good capacities to monitor changes in forest area using remote sensing data. Comparison with the corresponding FRA 2005 Country Reports led to the conclusion that the proportion of total tropical forest area estimated using good or very good monitoring capacity rose from 69% in 2005 to 83% in 2015. This reflected increased
Table 5
The trend in global forest area classified by the quality of source data (Tier 1 is the lowest quality and Tier 3 the highest) (K ha) (FAO, 2015). Note that a small area was not classified.
Quality tier 1990 2000 2005 2010 2015
1 473,191 452,602 442,972 431,748 422,231
2 1,315,257 1,264,676 1,238,387 1,218,309 1,206,644 3 2,339,804 2,338,308 2,351,367 2,365,599 2,370,242 Total 4,128,252 4,055,586 4,032,726 4,015,656 3,999,117
Table 3
The trend in forest area from 1990 to 2015 by country income category (K ha) (FAO, 2015). Income categories are defined by Gross National Income per capita per year: low ($1045 or less), lower-middle (US$1046 to $4125), upper-middle (US$4126 to $12,745) and high (US$12,746 or more) (World Bank, 2013). All totals involve rounding.
Income level 1990 2000 2005 2010 2015
High 1,808,959 1,817,229 1,817,957 1,825,524 1,830,347 Upper middle 1,254,645 1,237,046 1,231,708 1,228,041 1,228,186 Lower middle 591,378 557,059 550,997 542,767 533,344
Low 464,070 435,090 422,921 410,211 398,135
Unclassified 9,218 9,179 9,161 9,131 9,121
Total 4,128,269 4,055,602 4,032,743 4,015,673 3,999,134
Table 4
Net rates of change in the areas of forest and other wooded land from 1990 to 2015 in different global climatic domains (M ha y 1
) (FAO, 2015).
1990–00 2000–05 2005–10 2010–15
Forest
Boreal (inc. polar) 0.051 0.193 1.204 0.084
Temperate 2.290 3.657 2.851 2.208
Sub tropical 0.064 0.173 0.860 0.089
Tropical 9.543 7.863 6.608 5.520
Grand total 7.267 4.572 3.414 3.308
Other wooded land
Boreal (inc. polar) 0.348 0.371 0.482 0.162
Temperate 0.305 1.007 0.834 0.704
Sub tropical 0.104 0.460 0.158 49.698
Tropical 1.644 1.989 2.936 4.178
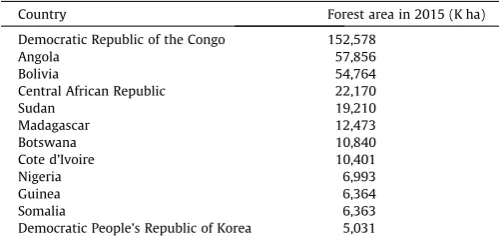
investment in forest inventory capacity in tropical and sub-tropical countries, mainly to support more robust estimates of greenhouse gas emissions from deforestation and forest degradation in antici-pation of payments becoming available under the UNFCCC REDD+ mechanism (Romijn et al., 2015). On the other hand, estimates for 11% of global forest area in 2015 were based on data of the lowest (Tier 1) quality. For example, 79 countries or territories, compris-ing 1.2% of global forest area, submitted no country reports and so their statistics had to be estimated by less accurate desk studies (MacDicken, 2015). Furthermore, while the 12 countries which have a forest area of more than 5 M ha and data of Tier 1 quality only account for 9% of global forest area in 2015, they accounted for 20% of the net decline in global forest area from 1990 to 2015. Ten of these countries are in Africa (Table 6).
4. Analysis
A key finding of FRA 2015 is that the net rate of loss of global forest area halved over the last 25 years. This and other findings are examined in this section to determine their robustness, and what they reveal about relationships between human beings and forests.
4.1. The implications of FRA 2015 statistics for trends in deforestation
To grasp the full meaning of FRA 2015 statistics on forest area trends it is necessary to disaggregate them in two ways: by sepa-rating natural forest from forest plantations, and by sepasepa-rating deforestation from afforestation.
Early FRAs listed areas of natural forest and forest plantations separately, but since FRA 2000 FAO has combined them in a single statistic, called ’forest’ (Grainger, 2007). Natural forest generally describes vegetation that evolved naturally in an area. Planted for-est includes both intensively managed forfor-est plantations purposely established to give priority to wood production that are usually composed of a single tree species and forests established for land conservation, coastal stabilization, biodiversity conservation or other purposes. Fortunately, the inclusion of separate figures for total forest area and planted forest area in FRA 2015 enabled us to calculate natural forest area as the difference between the val-ues of these statistics (Table S3). FRA 2015, like FRA 2010, includes statistics on the areas of ’primary forest’ and ’other naturally regenerated forest’, but their coverage for early time periods was not comprehensive. The ’planted forest’ statistic, introduced in FRA 2010, includes both forest plantations and rubber plantations, but not oil palm plantations and other agricultural plantations. So replacing an area of rubber plantation by an oil palm plantation will suggest that there has been a reduction in forest plantation area and hence in forest area too.
Our calculations show that natural forest area worldwide declined by 6% from 3961 M ha to 3721 M ha between 1990 and 2015 (Table 7). This wastwicethe percentage drop in forest area, and the net result of a 3% expansion of temperate natural forest, from 529 M ha to 546 M ha, and declines in natural forest in the other three climatic domains. In 142 tropical countries, the area of natural forest declined by 11%, from 1935 M ha to 1713 M ha. The decline in natural forest area worldwide was offset by a 66% rise in planted forest, from 168 M ha to 278 M ha (Table 7).
The change in natural forest area between any two time periods will be the net effect of forest clearance and conversion to another land use (or deforestation) in some areas, natural forest losses through processes such as fire or drought and natural forest expan-sion elsewhere. The trend in forest area combines these processes withafforestation, in which forest is planted or regenerates natu-rally on previously cleared land, e.g. as intensively managed plan-tations or restoration forests, andreforestation, in which trees are planted or regenerate naturally on land already classified as forest (FAO, 2013a). So a report of no net loss in forest area does not mean that the composition and structure of forest, its habitat value, or its supply of ecosystem services, have stayed the same. Converting an area of natural forest into an intensively managed plantation of exotic tree species in the tropics, for example, will increase its tim-ber production potential but will generally reduce its biodiversity. FRA 2015 includes statistics on the rate of ’deforestation’ but coverage is not comprehensive, as the table only includes reports from 48 countries. Our calculations on the dynamics of natural for-est show that thenet rate of loss of natural foresthalved, from 11.5 M ha y 1 to 5.8 M ha y 1, between the 1990s and 2010–15 (Table 8). This replicated the sharp fall in the net rate of loss of for-est (from 7.3 M ha y 1 to 3.3 M ha y 1) over the same period
(Table 4). The vast majority of natural forest loss was in the tropics, where the rate of loss fell by 39%, from 10.4 M ha y 1in the 1990s
to 6.4 M ha y 1from 2010 to 2015. In between these periods, it fell
to 9.1 M ha y 1in 2000–05 and to 8.1 M ha y 1in 2005–10. The
overall gross rate of loss of natural forest worldwide fell from 11.8 M ha y 1to 7.2 M ha y 1, but continuing loss in the tropics
was offset by an almost fivefold rise in the rate of expansion of temperate natural forest, from 0.3 M ha y 1
to 1.4 M ha y 1. Planted forest area has increased in absolute terms and as a pro-portion of total forest area, though the rate of expansion halved from 5.3 M ha y 1in 2005–10 to 2.5 M ha y 1in 2010–15 (Table 8).
4.2. Implications for modeling human impacts on forests
[image:5.595.313.562.629.752.2]Changes in land cover and land use from forest to non-forest have both natural causes, e.g. drought, fire, storms and disease,
Table 7
Trends in natural forest area (calculated as total forest area minus planted forest area) and planted forest area from 1990 to 2015 by climatic domain (K ha) (calculated from FAO, 2015). All totals involve rounding.
Year 1990 2000 2005 2010 2015
Natural forest
Boreal/polar 1,189,195 1,178,980 1,171,757 1,170,451 1,166,747 Temperate 529,131 531,922 534,774 538,836 545,759 Sub-tropical 307,123 303,746 301,332 295,502 295,331 Tropical 1,935,226 1,831,358 1,785,725 1,745,219 1,713,324 Total 3,960,676 3,846,005 3,793,590 3,750,008 3,721,160
Planted forest
Boreal/polar 30,114 40,841 47,099 54,423 57,705 Temperate 88,866 108,971 124,402 134,593 138,709 Sub-tropical 18,298 21,030 22,579 24,111 24,726
Tropical 30,316 38,755 45,074 52,539 56,833
Total 167,593 209,597 239,153 265,665 277,973
Table 6
Countries with forest areas greater than 5 M ha in 2015 and data of Tier 1 (lowest) quality (FAO, 2015).
Country Forest area in 2015 (K ha)
Democratic Republic of the Congo 152,578
Angola 57,856
Bolivia 54,764
Central African Republic 22,170
Sudan 19,210
Madagascar 12,473
Botswana 10,840
Cote d’Ivoire 10,401
Nigeria 6,993
Guinea 6,364
Somalia 6,363
[image:5.595.42.292.631.752.2]and human causes, e.g. clearance for agriculture, over-exploitative timber harvesting, the expansion of settlements, and infrastructure development. Changes to other land uses are linked to a complex and multi-faceted set of underlying driving forces, which include population growth, poverty, and government policies; and control-ling forces, such as technological development, rural to urban migration, changes in cultural attitudes toward forests, and stron-ger incentives for conservation.
It was possible to use statistics from early FRAs in regression analysis across countries for the same time period to show positive correlations between the rate of tropical deforestation and key dri-vers(Lambin, 1997; Lambin et al., 2001). Indeed, modeling was the focus of 30% of all scientific studies that made substantive use of statistics in FRAs 1980–2005 (Grainger, 2008). Yet FAO actually used population growth rates to estimate deforestation rates in FRA 1980 for countries for which reliable forest area change data were lacking (Lanly, 1981) and, as demonstrated by Rudel and Roper (1997), some scientists who were unaware of this drew mis-leading conclusions about the significance of population growth as a driver. Subsequently, scientific analysis of drivers of forest change has placed greater stress on national and sub-national studies that rely on national data on changes in population and land use and land cover (e.g. Mena et al., 2006), and on cross-sectional regression studies in which rates of deforestation are estimated using pan-tropical satellite surveys, of the kind dis-cussed in Section4.4(e.g.DeFries et al., 2010). Nevertheless, FRA 2015 statistics may still be used in new scientific studies to check for any cross-sectional evidence for the driving and controlling forces of forest change.
To anticipate such research, our analysis suggests that the find-ings of such studies are unlikely to be as categorical as those in the past. For example, a test of the 62 tropical countries that had a mean rate of loss of natural forest above zero in 2000–10, and employing logarithmic transformations, resulted in a correlation coefficient of r= 0.615 between Log10 (deforestation rate2000–10)
and Log10 (population growth rate2000–10) (Fig. S1, Table S4).
However, the relationship between the rate of change of natural forest area and the rate of population growth is now far more com-plex than it was in the 1980s and 1990s, owing to the increasing dominance of controlling forces and drivers of forest expansion over drivers of deforestation, the differential influences of urban and rural populations (DeFries et al., 2010), and the effect of time lags. For example, for the five tropical countries with mean popu-lation growth rates of 2–4 million persons y 1 in 2000–10 (UN,
2013), the rate of deforestation varied from 71 K ha y 1 (Pakistan) to 3030 K ha y 1(Brazil), and natural forest area actually
roseat a rate of 43 K ha y 1in India, which had the highest
popu-lation growth rate in the tropics (16.4 million persons y 1)
(Table 9).
Research to model short-term relationships between deforesta-tion rates and driving and controlling forces is complemented by studies of long-term trends in forest area. The most prominent generic relationship involves a curve showing the switch from net forest loss to net forest expansion as a country develops. The actual turning point marks a country’s nationalforest transition
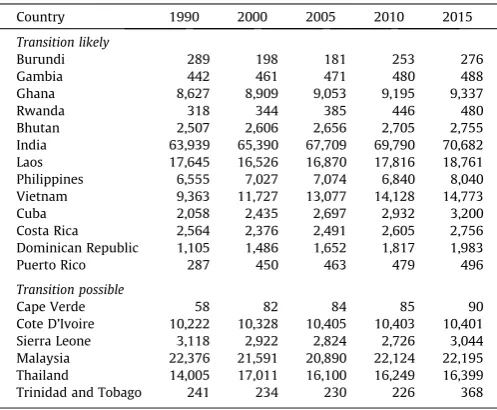
[image:6.595.33.284.103.229.2](Mather, 1992; Rudel et al., 2005). Because the expansion of planted forest makes an important contribution to this switch, the aggregated FRA statistic of forest area can be used to monitor such transitions. The forest transition model is consistent with the low or negative rates of forest loss in higher income countries that are reported in FRA 2015 (Table 3). An inspection of national trends in forest area in FRA 2015 also provides evidence that 13 tropical countries were likely to have either passed through their national forest transitions between 1990 and 2015, or continued along the path of forest expansion that follows such transitions (Table 10). These include such countries as India and Vietnam, for which forest transitions have already been documented (Mather, 2007). Forest transitions might also have occurred in six other countries, such as Thailand, but these are more uncertain because of potential errors in statistics; uncertainty around the turning point itself (Grainger, 2010); and other factors, e.g. the apparent trend in Thailand’s forest area may have been influenced
Table 9
Mean rates of change in natural forest area in 2000–10 (K ha y1
) in countries with the highest mean rates of population growth in 2000–10 (K persons y1
) above 1000 K persons y1
.
Rate of population growth
Rate of forest area change
India 16,336 3
Nigeria 3,683 625
Indonesia 3,174 1,002
Pakistan 2,932 71
Ethiopia 2,107 169
Brazil 2,071 3,030
Bangladesh 1,874 4
Philippines 1,579 9
Democratic Republic of the Congo
1,524 467
Mexico 1,401 187
Tanzania 1,095 595
Table 10
Trends in forest area in countries where a national forest transition (switch from net forest loss to net forest expansion) between 1990 and 2015 is likely or possible (K ha).
Country 1990 2000 2005 2010 2015
Transition likely
Burundi 289 198 181 253 276
Gambia 442 461 471 480 488
Ghana 8,627 8,909 9,053 9,195 9,337
Rwanda 318 344 385 446 480
Bhutan 2,507 2,606 2,656 2,705 2,755
India 63,939 65,390 67,709 69,790 70,682
Laos 17,645 16,526 16,870 17,816 18,761
Philippines 6,555 7,027 7,074 6,840 8,040
Vietnam 9,363 11,727 13,077 14,128 14,773
Cuba 2,058 2,435 2,697 2,932 3,200
Costa Rica 2,564 2,376 2,491 2,605 2,756
Dominican Republic 1,105 1,486 1,652 1,817 1,983
Puerto Rico 287 450 463 479 496
Transition possible
Cape Verde 58 82 84 85 90
Cote D’Ivoire 10,222 10,328 10,405 10,403 10,401
Sierra Leone 3,118 2,922 2,824 2,726 3,044
Malaysia 22,376 21,591 20,890 22,124 22,195
Thailand 14,005 17,011 16,100 16,249 16,399
[image:6.595.301.554.104.233.2]Trinidad and Tobago 241 234 230 226 368
Table 8
Rates of change in natural forest area (calculated as total forest area minus planted forest area) and planted forest area from 1990 to 2015 by climatic domain (K ha y 1
) (calculated fromFAO, 2015). All totals involve rounding.
Period 1990–00 2000–05 2005–10 2010–15
Natural forest
Boreal/polar 1.022 1.445 0.261 0.741
Temperate 0.279 0.571 0.812 1.385
Sub-tropical 0.338 0.483 1.166 0.034
Tropical 10.387 9.127 8.101 6.379
Total 11.467 10.483 8.716 5.770
Planted forest
Boreal/polar 1.073 1.252 1.465 0.657
Temperate 2.011 3.086 2.038 0.823
Sub-tropical 0.273 0.310 0.306 0.123
Tropical 0.844 1.264 1.493 0.859
[image:6.595.302.551.550.755.2]by a change in the method used by its Royal Forest Department to analyse satellite images.
4.3. Uncertainties about trends in forest area
One way to determine the robustness of forest area statistics reported in FRAs is to examine the quality of the latestindividual
estimates of national forest area. In FRA 2005 and earlier reports specific information was listed in tables in the FRA Main Report on the dates and types of the original estimates used to calculate the values of statistics, e.g. whether these estimates were recent or, say, 20 years old, and whether they were based on satellite or airborne remote sensing measurements or on ’expert estimates’. The type of measurement (or lack of it) indicated the accuracy of each data point. The likely error involved in projecting it forward to the latest common FRA reporting year (2015 in the case of FRA 2015), using the interpolation and extrapolation methods described in Section2, could be inferred from the date of the esti-mate and hence the length of the projection (Grainger, 2008).
In FRA 2015, the quality of the latest survey estimate is reported by countries in terms of Tier quality rankings (from 1, poorer qual-ity to 3, higher qualqual-ity) (Table 5). In the template provided for national forest area reports by FAO, Tier 3 was defined as ‘‘Data sources: either recent (610 years ago) National Forest Inventory
or remote sensing, with ground truthing, or programme for repeated compatible NFIs’’; Tier 2 as ‘‘Data sources: full cover map-ping/remote sensing or old NFI (>10 years ago)’’; and Tier 1 as ‘‘Other’’ (FAO, 2013b). The evidence on which these rankings were based will be published in the individual FRA 2015 Country Reports, but these reports could not be used for analysis in this study.
We therefore focused instead on examining the uncertainties associated with theaggregate trends in forest area from 1990 to 2015 that were reported in FRA 2015, by analyzing them in the context of trends for the same period reported in earlier FRAs. Since each FRA is undertaken independently, FAO prefers not to estimate change by comparing, say, the estimate of global forest area in 2015 published in FRA 2015, with the estimate of global forest area in 2005 published in FRA 2005. Instead, each FRA has presented new historical trends, e.g. from 1990 to 2015 in FRA 2015, that are consistent with the estimate for the latest reporting year, i.e. 2015 in the case of FRA 2015. Analyzing the relationships
between trends in different FRAs can establish mutual corrobora-tion, or shed light on associated uncertainties (Houghton, 2010). We examined global trends in natural forest, and trends for a sam-ple of 90 tropical countries in 1990, and how the shape of each trend varied. By 2015, creation of new states had increased the size of this sample to 93 countries, through the emergence of Eritrea, South Sudan and Timor-Leste (Table S5). The set of countries used for long-term comparison corresponds to the set used in FRA 1990 (FAO, 1993), and includes Mexico, Nepal and Pakistan, which in FRA 2015 are allocated to the sub-tropical climatic domain.
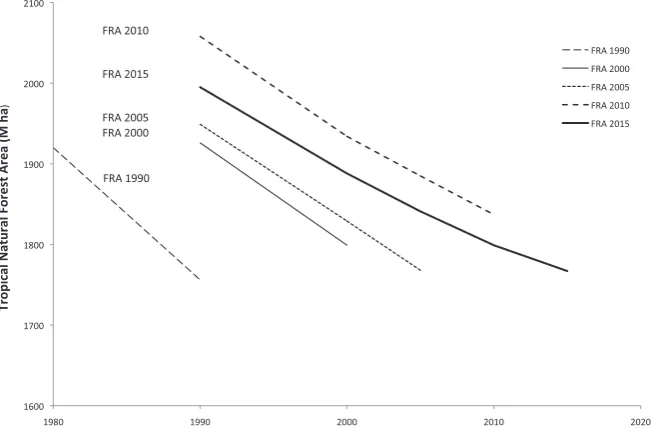
[image:7.595.311.561.288.501.2]Sometimes, differences between trends in successive FRAs can be traced to national factors, but on other occasions they reflect changes in overall FRA methods. For example, the FRA 1990 value ofnatural forestarea in the tropics in 1990 was 170 M ha lower than the value for the same year in FRA 2000, reflecting a switch from non-linear projection and interpolation methods in FRA 1990 to linear methods in FRA 2000 (Fig. 1,Table 11). After this
[image:7.595.140.467.526.743.2]Fig. 1.Trends in tropical natural forest area 1980–2015 in Forest Resources Assessments (FRAs) 1990–2015.
Table 11
Trends in tropical forest area and natural forest area (90 countries) and global forest area in Forest Resources Assessments (FRAs) 1990–2015 (M ha).
Date FRA 1990 FRA 2000 FRA 2005 FRA 2010 FRA 2015
Tropical
Forest area
1980 1,928
1990 1,800 1,989 1,978 2,085 2,022
2000 1,866 1,861 1,972 1,923
2005 1,803 1,929 1,872
2010 1,887 1,847
2015 1,819
Natural forest area
1980 1,920
1990 1,756 1,926 1,949 2,058 1,995
2000 1,799 1,829 1,934 1,888
2005 1,768 1,885 1,841
2010 1,837 1,799
2015 1,767
Global forest area
1990 3,963 4,077 4,168 4,128
2000 3,870 3,989 4,085 4,056
2005 3,952 4,061 4,033
2010 4,033 4,015
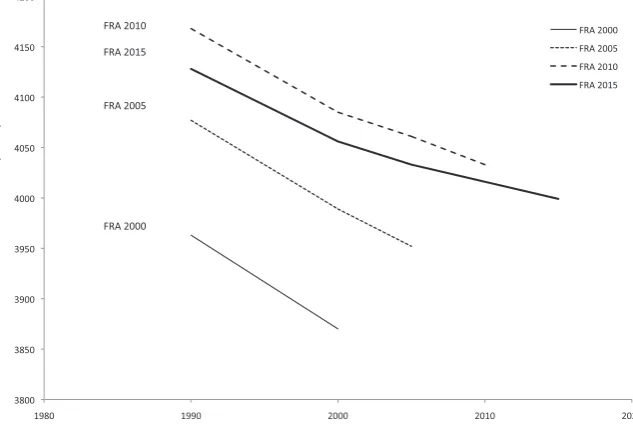
disjunction, in FRA 2005 the value of natural forest area in 1990 only rose by 23 M ha over the value in FRA 2000 (Grainger, 2008), and this relatively small increment is interesting because from FRA 2005 onwards NCs had more autonomy to make their reports than in earlier FRAs. The increasing trend continued in FRA 2010, in which natural forest area for 1990 rose by 109 M ha to 2058 M ha. In FRA 2015, however, this trend was reversed, with natural forest area in the tropics for 1990 actually falling by 63 M ha to 1995 M ha – though this value is still higher than the corresponding estimate in FRA 2005. A similar deflation is seen in consecutive trends in globalforestarea (Fig. 2). Whether this ’de-flationary’ phenomenon is the result of a greater accuracy of indi-vidual FRA 2015 estimates, or of other factors, requires further study. To show how national circumstances can play a role, e.g. deflation was also visible between tropical forest area trends in FRA 2005 and FRA 2000 (Table 11). A major reason for this was the reclassification of 90% of forest plantations in India as natural forests, which inflated natural forest area but not overall forest area (Grainger, 2010).
If FRA 1990 statistics are excluded, as an outlier, the decline of 228 M ha in tropical natural forest area between 1990 and 2015, calculated from FRA 2015 statistics (Fig. 1), is 73% greater than the 132 M ha range of area estimates of tropical natural forest in the year 1990 in FRAs 2000–2015 (Table 11). However, the 129 M ha decline in global forest area over the same period is only 63% of the 205 M ha range of estimates for global forest area in 1990 in FRAs 2000–2015 (Fig. 2), and so could be within the limits of error for the trend as a whole, tending to support Mather’s (2005)conclusions about historic uncertainties in the trend in glo-bal forest area.
A second feature of successive trends that is apparent inFig. 1is that while trends in FRAs 1980–2005 were generally parallel to one another, in FRA 2010, and more markedly in FRA 2015, forest area declines less rapidly after 2005. On the one hand, this reflects the recent reduction in the rate of deforestation, noted above. However, it might also have been influenced by FAO staff ‘‘prefill-ing’’ the 1990, 2000, 2005, 2010 values of the forest area statistics in FRA 2015 with those from FRA 2010. As was the case in FRA 2010, countries were not obliged to fill inallthe years in the data-base using the same set of data and the same forward and back-ward projection methods. Instead, values for the most recent years could be estimated separately and figures for previous years
left as pre-filled. We found that, out of a sample of 93 tropical countries, in FRA 2010 41 countries had used the same statistics for 1990–2005 as in FRA 2005, while in FRA 2015 47 countries had repeated the estimates for 1990–2010 used in FRA 2010. In contrast, in FRA 2005, the last report before prefilling was intro-duced, only 10 tropical countries had used the same statistics for 1990–2000 as in FRA 2000 (Table S6). The 47 countries that did not change the prefilled figures in 2015 accounted for 32% of total natural forest area in the sample of 93 countries in 2015 (569 M ha), an area 33% larger than that of the 41 prefilling coun-tries in FRA 2010 (428 M ha). When all FRA 2015 Country Reports become available, further scientific studies could explore this effect in more detail, and undertake a deeper statistical analysis of the uncertainties associated with FRA 2015 trends than was possible in this paper.
4.4. Comparison of the findings of FRA 2015 and remote sensing studies
Another way to evaluate the findings of FRAs is to compare them with the findings of global remote sensing surveys. A funda-mental issue for FRAs is that individual countries undertake their forest inventories at different times and frequencies, according to their own measurement cycles and the availability of funding. Errors can therefore arise when relatively rudimentary methods are used in FRAs to adjust estimates of forest area based on the results of these national surveys to a common reporting year, e.g. 2015 in FRA 2015, and to estimate rates of forest area change (see Section3). Since remote sensing satellites collect data every year for every part of the Earth’s surface, it is possible, in principle, to use these data to measure global and pan-tropical forest areas in specific years and the rate at which they changed between these years. In practice, for areas with high cloud cover, or subject to other technical issues associated with image processing, it may mean that remotely sensed images are a compilation of images from around a target year. In this section we compare FRA 2015 findings with the results of global remote sensing surveys. We look in turn at estimates of forest area and forest area change, and at their limitations.
[image:8.595.135.452.71.285.2]While there are general similarities between FRA and global remote sensing estimates, differences between them can be explained by a combination of five main factors. First, the
limitations of FRA statistics, in terms of data quality and consis-tency between countries, which are well documented (Grainger, 2008; Hansen et al., 2013). Second, variation in the methods used to estimate forest area, e.g. FRA main reports involve the aggrega-tion of naaggrega-tional statistics reported by countries, while global remote sensing surveys may employ sampling methods or compre-hensive (‘‘wall to wall’’) mapping. Each method has its own strengths and limitations. Third, difficulties in using remote sens-ing techniques to correctly determine percent tree cover for low tree cover densities, i.e. below 30%. Fourth, differences in the set of countries covered by estimates.
The fifth factor, which will have a major impact on the analysis in this section, is the use of different definitions of ’forest’.Lund (2014)lists over 1500 different operational definitions of the term ‘forest’ and over 200 different definitions of the term ‘tree’. Some of these are land cover based (e.g. biophysical) definitions while others areland usebased definitions. The FRAs employ a land use definition, which means that they can include areas designated for forestry or conservation that are temporarily unstocked with trees (see Section2). Most remote sensing studies, on the other hand, use a land cover definition (Magdon et al., 2014), because land use cannot be determined by remote sensing alone. Definitions of forest also vary in the minimum threshold of per-centage tree cover which they require before an area of land can be defined as forest. Consequently, the use of different definitions can lead to very different estimates of forest area in remote sensing estimates. This is illustrated byHansen et al. (2013), who divided world land area into four ‘‘tree cover’’ classes – 0–25%, 26–50%, 51–75% and 76–100% – when they undertook wall to wall mapping using Landsat images. They found that in the tropics, the 76–100% tree cover class, which broadly corresponds with tropical moist forest, covered 1324 M ha in the year 2000, while the area above 25% tree cover, 2094 M ha, was of the same order of magnitude
as the FRA 2015 figure for all tropical forest, which was based on a threshold tree cover of 10%.
Global or pan-tropical remote sensing studies of forests include surveys undertaken outside the FRA process, and those undertaken within the FRA process itself. To provide an alternative common picture of forest cover FAO has, since 1990, commissioned large-scale uniform Remote Sensing Surveys (RSS) to complement the national statistics listed in the FRA main reports. The results of these RSS have generally been presented in parallel with data sup-plied by countries. Thus, the findings of RSS 2000 were included as a chapter in the FRA 2000 Main Report (FAO, 2001). FAO commis-sioned two recent RSS in partnership with the Joint Research Centre of the European Commission. These surveys, which were based on a global sample of satellite imagery, were designed to provide consistent and comparable estimates of tree cover and for-est land-use from 1990 to 2010 at global and regional scales, to complement the increasing number of national statistics in FRA main reports that are based on national remote sensing surveys. The first, ‘RSS 2010’ (FAO and JRC, 2012), was undertaken as part of the FRA 2010 process, but completed and published after the Main Report. The second, here called ‘RSS 2015’ (FAO and JRC, 2014), was part of the FRA 2015 process and extended the time-series for the same sample sites to 2010.
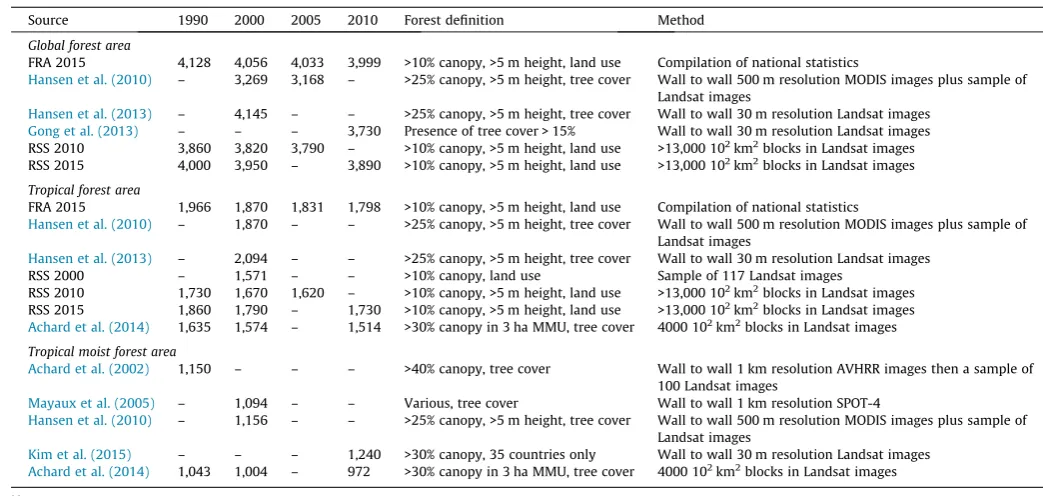
[image:9.595.37.559.458.706.2]According to FRA 2015, global forest area declined from 4128 M ha in 1990 to 3999 M ha in 2015 (Table 1). In the earliest remote sensing survey at this scale,Hansen et al. (2010)found that global forest area declined from 3269 M ha to 3168 M ha between 2000 and 2005 (Table 12). The absolute values of area in 2000 and 2005 were much lower than those in FRA 2015. One possible rea-son for this was thatHansen et al. (2010)only mapped areas with tree cover above 25%, whereas FRA 2015 used a 10% threshold; another reason was that they used coarse (0.5 km) resolution MODIS images, which may not detect small areas of forest. The
Table 12
Estimates of global and pan-tropical forest area 1990–2015 based on satellite data, compared with FRA 2015 findings (M ha).
Source 1990 2000 2005 2010 Forest definition Method
Global forest area
FRA 2015 4,128 4,056 4,033 3,999 >10% canopy, >5 m height, land use Compilation of national statistics
Hansen et al. (2010) – 3,269 3,168 – >25% canopy, >5 m height, tree cover Wall to wall 500 m resolution MODIS images plus sample of Landsat images
Hansen et al. (2013) – 4,145 – – >25% canopy, >5 m height, tree cover Wall to wall 30 m resolution Landsat images
Gong et al. (2013) – – – 3,730 Presence of tree cover > 15% Wall to wall 30 m resolution Landsat images
RSS 2010 3,860 3,820 3,790 – >10% canopy, >5 m height, land use >13,000 102
km2
blocks in Landsat images RSS 2015 4,000 3,950 – 3,890 >10% canopy, >5 m height, land use >13,000 102
km2
blocks in Landsat images
Tropical forest area
FRA 2015 1,966 1,870 1,831 1,798 >10% canopy, >5 m height, land use Compilation of national statistics
Hansen et al. (2010) – 1,870 – – >25% canopy, >5 m height, tree cover Wall to wall 500 m resolution MODIS images plus sample of Landsat images
Hansen et al. (2013) – 2,094 – – >25% canopy, >5 m height, tree cover Wall to wall 30 m resolution Landsat images
RSS 2000 – 1,571 – – >10% canopy, land use Sample of 117 Landsat images
RSS 2010 1,730 1,670 1,620 – >10% canopy, >5 m height, land use >13,000 102km2blocks in Landsat images
RSS 2015 1,860 1,790 – 1,730 >10% canopy, >5 m height, land use >13,000 102km2blocks in Landsat images
Achard et al. (2014) 1,635 1,574 – 1,514 >30% canopy in 3 ha MMU, tree cover 4000 102
km2
blocks in Landsat images
Tropical moist forest area
Achard et al. (2002) 1,150 – – – >40% canopy, tree cover Wall to wall 1 km resolution AVHRR images then a sample of
100 Landsat images
Mayaux et al. (2005) – 1,094 – – Various, tree cover Wall to wall 1 km resolution SPOT-4
Hansen et al. (2010) – 1,156 – – >25% canopy, >5 m height, tree cover Wall to wall 500 m resolution MODIS images plus sample of Landsat images
Kim et al. (2015) – – – 1,240 >30% canopy, 35 countries only Wall to wall 30 m resolution Landsat images
Achard et al. (2014) 1,043 1,004 – 972 >30% canopy in 3 ha MMU, tree cover 4000 102
km2
blocks in Landsat images
Notes.
Hansen et al. (2010)study estimated gross loss from 2000 to 2005. RSS 2010 study estimated loss from 2000 to 2005.
Achard et al. (2014)study does not include Mexico. – = not assessed.
second factor seems to have been influential, because when
Hansen et al. (2013) used medium (30 m) resolution Landsat images (again assuming at least 25% tree cover) they found that global forest area in the year 2000 was 4145 M ha, which was only 89 M ha above the FRA 2015 estimate for 2000 of 4056 M ha.
Hansen et al. (2013)did not attach any error bars to their esti-mates, but the errors involved in measuring global forest area in this way are clear from the range represented by the two Hansen et al. estimates, and another estimate of 3730 M ha for global forest area in 2009 that was also based on Landsat imagery, but with a 15% tree cover threshold (Gong et al., 2013).
RSS 2010 reported a drop in global forest area from 3820 M ha to 3790 M ha between 2000 and 2005 (FAO and JRC, 2012), but RSS 2015 reported higher area values and but the same rate of loss, from 3950 M ha to 3890 M ha between 2000 and 2010 (FAO and JRC, 2014). The relative proximity of these five global surveys to the FRA 2015 trend is interesting, given that the two RSS used over 13,000 10 km10 km sampling blocks within Landsat images, while the other three surveys used wall to wall sets of Landsat images (Hansen et al., 2013; Gong et al., 2013) or MODIS images (Hansen et al., 2010).
Another set of remote sensing surveys can be used to evaluate the report in FRA 2015 that between 1990 and 2015tropical forest
area in 142 countries declined by 10% from 1966 M ha to 1770 M ha (Table 1). One estimate of 1870 M ha for all tropical for-est area in the year 2000 (Hansen et al., 2010) is identical to the FRA 2015 figure for that year, and the RSS 2015 trend may also not be significantly different from the FRA 2015 trend: 1860 M ha, 1790 M ha and 1730 M ha for 1990, 2000 and 2010 respectively (FAO and JRC, 2014). On the other hand, the RSS 2010 estimate of 1620 M ha for 2005 (FAO and JRC, 2012) and esti-mates byAchard et al. (2014)of 1635 M ha, 1574 M ha and 1514 M for 1990, 2000 and 2010, respectively, are much lower (Table 12). These latter figures resulted from using the same sampling method as RSS 2010 (4000 sample blocks in the tropics), but with a land cover definition instead of a land use definition. Interestingly, the
Achard et al. (2014)figure for 2000 is almost identical to the esti-mate of 1571 M ha for all tropical forest in 2000 by RSS 2000 (FAO, 2001), which employed a different (two-stage stratified random) design for sampling Landsat images.
The accuracy of estimates of all tropical forest area is con-strained by uncertainty about the distribution of open ’savanna’ woodlands in dry areas, which are extensive in Africa, Australia and Latin America (Bodart et al., 2013; Beuchle et al., 2015). Open woodlands were thought to contribute 734 M ha, or 38%, to the estimate of 1935 M ha for tropical natural forest area in 1980 (FAO, 1982). Yet owing to their low commercial importance they are often not assessed by field surveys, or surveyed regularly by governments. Measuring their area using remote sensing is also difficult, even with Landsat images (Lambin, 1999). Estimates of the area of the even lower tree cover category of ’other wooded land’ also vary, e.g. the estimate by Achard et al. (2014) of 975 M ha for other wooded land in 2010 is 81% higherthan the 538 M ha reported in FRA 2015. This discrepancy is partly explained by the fact that the remotely-sensed class of other wooded land may include areas of low density tree cover that would be classified as ’forest’ in FRA Main Report statistics. Indeed, RSS 2010 showed that differences between regional forest area estimates in FRA 2015 and RSS 2010 estimates rose as the extent of drylands in a region increased (FAO and JRC, 2012).
Tropical moist forests– which comprise all closed forests in the humid tropics – are easier to map using satellite data, though they are often hidden from satellite sensors by clouds. They were the initial focus of global remote sensing forest surveys, yet it is diffi-cult to conclude that tropical moist forest area has declined signif-icantly by looking at the time series of available estimates, i.e.
1150 M ha in 1990 and 1116 M ha in 1997 (Achard et al., 2002); 1094 M ha (Mayaux et al., 2005) and 1156 M ha (Hansen et al., 2010) in 2000; and 1257 M ha in 2010 (Kim et al., 2015). The high value of the last of these studies was remarkable, as it was based on wall to wall mapping using Landsat images, and referred to only 34 countries and to all forest with more than 30% tree cover. Another set of measurements, based this time on samples of Landsat images,did show a decline, from 1043 M ha in 1990, to 1004 M ha in 2000 and 972 M ha in 2010 (Achard et al., 2014).
A more challenging task is to substantiate key findings of FRA 2015 that between the 1990s and 2010–15 the net rates of loss of all forest and tropical forest halved, falling from 7.3 M ha y 1
to 3.3 M ha y 1, and from 9.5 M ha y 1to 5.5 M ha y 1, respectively (Table 4). One reason for this difficulty is that estimates of forest area loss are affected by differences between land use and land cover definitions. For example, most forest clearance in the tropics involves a change in land use, e.g. to agriculture, and the customary forest management practice is selective logging, which does not involve forest clearance. In temperate and boreal forests, on the other hand, clear-felling is a common forest management practice. This results in a temporary loss of tree cover but does not lead to a change in land use.Hansen et al.’s (2010)measurement of ’gross global forest loss’, which equated forest with tree cover above 25%, concluded that 20.2 M ha y 1 was lost between 2000 and
2005. This was much higher than the corresponding rate in FRA 2015. However, only 47% of this loss (9.5 M ha y 1) occurred in the tropics, while the remaining 53% (10.7 M ha y 1) occurred in
temperate and boreal forests, as a result of logging, fire and insect outbreaks.Hansen et al.’s (2010)method involved taking samples of Landsat images to estimate the rate of forest loss. WhenHansen et al. (2013)used the more elaborate approach of classifying wall to wall Landsat images they found that temperate and boreal for-ests now accounted for just 38% of global gross forest cover loss of 19.2 M ha y 1between 2000 and 2012, and this was offset by
forest gain of 6.7 M ha y 1. RSS 2010 used the same 10% tree cover
threshold used for the FRA main report statistics, but its estimate of 14.7 M ha y 1 for the rate of global net forest loss between
[image:10.595.301.554.103.238.2]2000 and 2010 was also higher than the corresponding estimate in FRA 2010 (FAO and JRC, 2012).Coulston et al. (2013)shed fur-ther light on this issue by showing that estimates of forest land use extent and forest land cover extent in the southeastern USA were not correlated; that estimates of net change based on forest land cover and forest land use were only modestly correlated; and that net forest land use change estimates were independent of gross forest cover loss. They suggested that changes in forest cover are more indicative of a change in forest land use in the trop-ics than in areas, such as the southeastern USA, where forest regen-eration commonly follows harvesting and disturbance.
Table 13
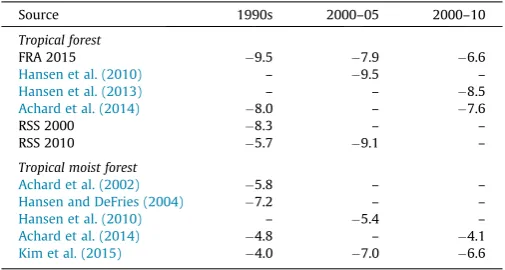
Trends in pan-tropical forest area change rates 1990–2015 based on satellite data, compared with FRA 2015 findings (M ha y 1
). For notes on forest definitions and methods seeTable 12.
Source 1990s 2000–05 2000–10
Tropical forest
FRA 2015 9.5 7.9 6.6
Hansen et al. (2010) – 9.5 –
Hansen et al. (2013) – – 8.5
Achard et al. (2014) 8.0 – 7.6
RSS 2000 8.3 – –
RSS 2010 5.7 9.1 –
Tropical moist forest
Achard et al. (2002) 5.8 – –
Hansen and DeFries (2004) 7.2 – –
Hansen et al. (2010) – 5.4 –
Achard et al. (2014) 4.8 – 4.1
A sufficient number of estimates of deforestation rates for trop-ical moist forest are available for comparison with estimates of tropical forest area loss in FRA 2015. These estimates tend to be
lower, not higher, than corresponding estimates of tropical forest loss in FRA 2015, not least because they refer to a subset of tropical forests. Thus, estimates of forest loss for the 1990s include 5.8 M ha y 1, based on samples of Landsat images (Achard et al.
(2002); and 7.2 M ha y 1, offset by forest gain of 1.2 M ha y 1,
using 8 km resolution images (Hansen and DeFries, 2004) (Table 13). The declining trend in FRA 2015 was supported by
Hansen et al.’s (2010)estimate for 2000–05 of 5.4 M ha y 1, and
estimates byAchard et al. (2014)of 4.8 M ha y 1 between 1990
and 2000 and 4.1 M ha y 1between 2000 and 2010. On the other hand, another set of integrated estimates found that the net rate of forest loss in 34 humid tropical countries, based on wall to wall mapping using Landsat images,rosefrom 4.0 M ha y 1in the 1990s to 7.0 M ha y 1 in 2000–05, and then declined to 6.1 ha y 1 in
2005–10 (Kim et al., 2015).
Fewer estimates of forest loss are available forall tropical forest. These include 8.3 M ha y 1in the 1990s in RSS 2000 (FAO, 2001),
9.5 M ha y 1 between 2000 and 2005 (Hansen et al., 2010), and
8.5 M ha y 1 between 2000 and 2012 (Hansen et al., 2013). The
combined time series is understandably closer in value to the cor-responding FRA estimates than the time series for tropical moist forest, and supportsKim et al.’s (2015)claim that tropical defor-estation peaked after 2000. Further support is provided by RSS 2010, which estimated that net tropical forest loss rose from 5.7 M ha y 1 in the 1990s to 9.1 M ha y 1 in 2000–05 (FAO and
JRC, 2012). However,Achard et al. (2014)found only a slight drop from 8.0 M ha y 1in the 1990s to 7.6 M ha y 1from 2000 to 2010,
which supports the FRA 2015 trend.
Overall, the findings of remote sensing studies provide some support for FRA 2015 findings, especially on trends in global forest area and tropical forest area. However, it is difficult to generalize, because there are considerable differences between the findings of remote sensing studies, owing to differences in assessment peri-ods, the definitions of forest, remote sensing methperi-ods, and country coverage.
5. Conclusions
The results of the latest Global Forest Resources Assessment of the Food and Agriculture Organization of the United Nations (FAO) indicate that between 1990 and 2015 total forest area declined by 3%, from 4128 M ha to 3999 M ha, and the annual rate of net forest loss halved from 7.3 M ha y 1in the 1990s to 3.3 M ha y 1between
2010 and 2015. Loss of forest area was largely in the tropics, from 1966 M ha in 1990 to 1770 M ha in 2015, while temperate forest expanded from 618 M ha to 684 M ha over the same period. Net tropical forest loss over the last five years was dominated in South America by Brazil (984 K ha y 1), in Asia by Indonesia (684 K ha y 1), and in Africa by Nigeria (410 K ha y 1). However,
the Brazilian and Indonesian loss rates were only about 40% of the corresponding rates in the 1990s. Forest area expanded between 2010 and 2015 by 1.5 M ha y 1in China, and at rates of
301 K ha y 1, 275 K ha y 1and 240 K ha y 1in Chile, the USA and
the Philippines, respectively. Between 1990 and 2015, thirteen tropical countries may have either experienced national forest transitions from net forest loss to net forest gain, or continued along the path of forest expansion that follows such transitions. Forest transitions may be in progress in another six countries.
While the results of FRA 2015 are likely to be used extensively for research and policy formulation, as with previous FRAs, careful interpretation will be needed to ensure that the statistics are used in ways that are consistent with scientific terminology and desired
policy outcomes. For example, FRA 2015 estimates of forest area include natural forest and planted forest, and a reduction in net forest loss (which could result from a combination of a loss of nat-ural forest and a gain in planted forest) is not the same as a reduc-tion in deforestareduc-tion.
The quality of data on which FRA 2015 statistics are based is considered to be higher than those in earlier FRAs, with National Correspondents reporting that about 60% of global forest area in 2015 has been estimated using the highest quality data. However, the amount of forest reported using the poorest data quality (Tier 1) is still 11%, indicating that a number of countries used out-of-date or incomplete national assessments.
Independent pan-tropical and global remote-sensing surveys exhibited differences in estimates of global and tropical forest area and dynamics, both with FRA 2015 and with each other, because of differences in definitions and in measurement methods. This vari-ation between studies suggests the need for policy makers to understand differences between estimates of forest area derived using different methods and based on different definitions when establishing policies and targets to reduce deforestation rates and increase forest area.
Increased investment over the last 10 years has improved national forest monitoring capacity in developing countries, in considerable part to prepare to implement arrangements for the REDD+ mechanism of the UN Framework Convention on Climate Change. This investment needs to be sustained, and expanded to include key African and Latin American countries with currently deficient inventory systems. A comprehensive monitoring approach that integrates remotely-sensed data of sufficiently high resolution with field measurements and observations could pro-vide a sound basis for assessing forest-related greenhouse gas dynamics and for supporting sustainable forest management at a range of scales.
Acknowledgements
We would like to acknowledge the efforts of the National Correspondents from each country and territory in collecting and presenting data for the 2015 Global Forest Resource Assessment and the UN FAO staff involved in reviewing and collating data. This analysis was completed while RJK was undertaking a Special Study Program from the University of Melbourne at CATIE in Costa Rica and the London School of Economics and Political Science. He would like to acknowledge the support and hospitality provide by those institutions. Other authors would like to acknowl-edge the support of their respective host institutions. We also thank two anonymous referees for helpful comments and suggestions.
Appendix A. Supplementary material
Supplementary data associated with this article can be found, in the online version, at http://dx.doi.org/10.1016/j.foreco.2015.06. 014.
References
Achard, F., Eva, H.D., Stibig, H.-J., Mayaux, P., Gallego, J., Richards, T., Malingreau, J.-P., 2002. Determination of deforestation rates of the world’s humid tropical forests. Science 297, 999–1002.
Achard, F., Beuchle, R., Mayaux, P., Stibig, H.-J., Bodart, C., Brink, A., Donnay, F., Lupi, A., Carboni, S., Desclee, B., Donnay, F., Eva, H.D., Lupi, A., Rasi, R., Seliher, R., Simonetti, D., 2014. Determination of tropical deforestation rates and related carbon losses from 1990 to 2010. Glob. Change Biol. 20, 2540–2554. Arrow, K.J., Dasgupta, P., Goulder, L.H., Mumford, K.J., Oleson, K., 2012.
Sustainability and the measurement of wealth. Environ. Dev. Econ. 17, 317–353. Ausubel, J.H., Wernick, I.K., Waggoner, P.E., 2012. Peak farmland and the prospect