This is a repository copy of Repeatability of buried charge testing.
White Rose Research Online URL for this paper: http://eprints.whiterose.ac.uk/80754/
Version: Submitted Version
Proceedings Paper:
Clarke, S.D., Fay, S.D., Tyas, A. et al. (4 more authors) (2014) Repeatability of buried charge testing. In: Proceedings of the 23rd International Symposium on Military Aspects of Blast and Shock. International Symposium on Military Aspects of Blast and Shock, 7-12 September 2014, Oxford, UK. .
[email protected] https://eprints.whiterose.ac.uk/ Reuse
Unless indicated otherwise, fulltext items are protected by copyright with all rights reserved. The copyright exception in section 29 of the Copyright, Designs and Patents Act 1988 allows the making of a single copy solely for the purpose of non-commercial research or private study within the limits of fair dealing. The publisher or other rights-holder may allow further reproduction and re-use of this version - refer to the White Rose Research Online record for this item. Where records identify the publisher as the copyright holder, users can verify any specific terms of use on the publisher’s website.
Takedown
If you consider content in White Rose Research Online to be in breach of UK law, please notify us by
REPEATABILITY OF BURIED CHARGE TESTING
S. D. Clarke1, S. D. Fay1,2, A. Tyas1, J. Warren1,2, S. Rigby1, I. Elgy3, R. Livesey3
1University of Sheffield, Department of Civil & Structural Engineering, Sir Frederick
Map-pin Building, MapMap-pin Street, Sheffield, S1 3JD, UK.
2Blastech Ltd., The Bioincubator, 40 Leavygreave Road, Sheffield, S3 7RD, UK.
3Defence Science and Technology Laboratory, Porton Down, Salisbury, Wiltshire, SP4 0JQ, UK.
Abstract
The relationship between the geotechnical parameters and the impulse delivered by a charge buried shallowly (<100 mm) within a soil mass has received much attention in recent times. It has previously been demonstrated that for uniform soils a high degree of repeatability in the delivered impulse can be achieved when carefully controlling the geotechnical conditions. In this paper the authors explore the recommendations given in AEP55 regarding the testing of surrogate mine blasts using both minepots and the STANAG standard sandy gravel.
With moisture content and bulk density being intrinsically coupled, using bulk density as a measure of geotech-nical control and hence repeatability is questionable. A methodology for the careful preparation of the Stanag sandy gravel soil is presented along with comparative results from minepots demonstrating the comparative repeatability of both methodologies. These results are then compared with a number of other soils to allow gen-eral conclusions about the repeatability of specific soil characteristics to be drawn.
Keywords: Buried charges; Impulse measurement; IEDs; Stanag; Minepots.
Background
With the increasing use of buried improvised explosive devices in current conflict zones, a need for a deeper understanding of the role of soil in these explosive events has emerged. Be-ing able to design protective structures to withstand such events and save lives, depends on the accurate assessment of the blast loading produced by the detonation of such shallow-buried explosives. This is a highly complex detonation event, involving the interaction of ex-tremely high-energy shock waves with multiple materials in different phases. Experimental research into characterising blast loading from buried explosives has typically involved a rel-atively poor control of the soil conditions prior to the blast. This has resulted in highly incon-sistent results becoming the accepted norm (it is not uncommon to see scatter of ±15% from nominally identical tests [1], the author has shown previously that this can be reduced to ±3% [2]). As an alternative, some research groups remove the blast-related aspects altogether by using well controlled small scale laboratory samples loaded by compressed gas [3]. This ap-proach has the drawback of over-simplifying the problem by ignoring the air-shock, geomet-rical and thermal aspects of the loading, and perhaps even more critically concentrating only on the sand throw as the mechanism for impulse transfer.
principal variables, these have generally been hampered by lack of control over the soil con-ditions.
With careful control during the preparation of the soil mass, samples with density errors of ±0.2%, and moisture content errors of ±0.05-0.1% can be created. Using the newly devel-oped methodology it has been shown previously that for a single uniform soil at low moisture contents and a fixed bulk density, a small increase in moisture content leads to an minor in-crease in generated impulse with all other variables remaining constant [2]. The variation of impulses for nominally identical tests was ±3%. Many further test series have now been con-ducted with varying soil types incorporating the test modifications made in [4].
The aim of the conducted research is to investigate whether certain soil types and conditions produce more repeatable tests when gauged by the variation in total impulse delivered to a target. These impulse data were also compared to the output from tests conducted using the minepot described in [5].
1. Methodology
1.1. Experimental setup
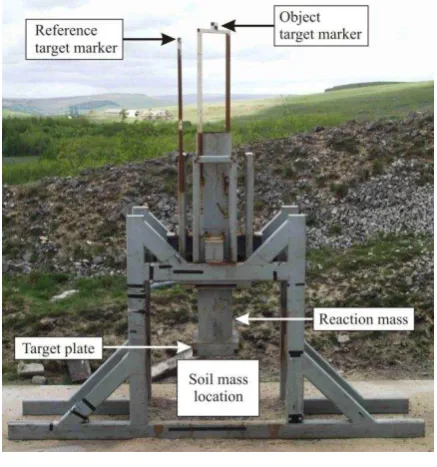
A rigid reaction frame, fabricated on behalf of DSTL was utilized for this work (Figure 1). The target plate and interface/end plate was ballasted to a large mass and welded to a vertical length of steel circular hollow section. This hollow section has lateral steel flanges either side of an arrestor plate at the top of the rig. Rubber bushings are placed on the arres-tor plate. In this way, the total target mass is given a free upward flight of up to 800mm. The upward flight is then arrest-ed either by gravity (if the peak velocity <~4m/s) or by the impact of the lower flange onto the lower face of the arrestor plate. As the mass subsequently descends, the upper flange settles onto the upper face of arrestor plate, where again the im-pact is softened by bushes. Peak dynamic deformation of the target plate (relative to the interface plate) was accurately meas-ured using deformable aluminium honey-comb crush block, mounted on a rigid support spanning the 500mm diameter hole in the interface plate. Post-test final deformations of the target plates were recorded.
1.2. Geotechnical conditions
Soil is a naturally variable material. As such the degree of control possible of the geotech-nical conditions should be a product of this natural variation. Six soils have been tested in the current research at a range of moisture contents (w = mass of water / dry mass of solids) and
[image:3.595.86.305.398.632.2]bulk and dry densities ( , d).
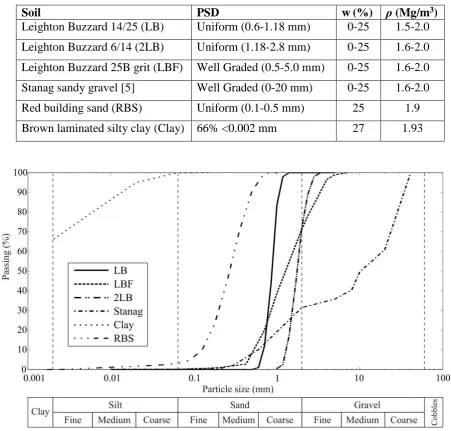
The soil types tested are given in Table 1 with information on the particle size distribution for each soil type being shown in Figure 2. For each soil reported the dry density of the material (spacing of the particles) was constant in each test, meaning an increase in moisture content leads to an increase in bulk density. The three Leighton Buzzard sands used in the research provide an opportunity to investigate directly the effects of particle scaling and particle size distribution for nominally identical materials. Leighton Buzzard sand can be described as a rounded to well-rounded quartz silica sand shown in Figure 3. For all the soils tested with the exception of the clay, quartz silica is the predominant mineral, giving the soils an identical
[image:4.595.70.522.225.656.2]specific gravity, Gs, of 2.65 (Clay Gs≈ 2.75).
Table 1: Soil types used in the current research
Soil PSD w (%) (Mg/m3)
Leighton Buzzard 14/25 (LB) Uniform (0.6-1.18 mm) 0-25 1.5-2.0
Leighton Buzzard 6/14 (2LB) Uniform (1.18-2.8 mm) 0-25 1.6-2.0
Leighton Buzzard 25B grit (LBF) Well Graded (0.5-5.0 mm) 0-25 1.6-2.0
Stanag sandy gravel [5] Well Graded (0-20 mm) 0-25 1.6-2.0
Red building sand (RBS) Uniform (0.1-0.5 mm) 25 1.9
Brown laminated silty clay (Clay) 66% <0.002 mm 27 1.93
Figure 2: Soil particle size distribution curves
1.3. Soil preparation
mm tall cylinder. A 25 mm thick mild steel base plate was welded to the base of each cylinder and four lifting eyes attached to each base plate. Prior to sample preparation, the moisture content of each soil bag was checked allowing the calculation of the water required to achieve the prescribed water con-tent ±0.1%. The containers were filled in 3 stages each of equal mass (the exact mass depends on geotechnical conditions of the test). The moisture content of the dried soil dictated the amount of water added for each stage. The soil was weighed as it entered the forced action pan mixer and the correct mass of water added. Mixing continued until the water was evenly distributed; with moisture content then checked. If the moisture content was confirmed to be within tolerance, the contents of the pan mixer were purged into the soil container taking care to avoid sample loss. Plywood shuttering (cut to the internal diameter of the container) was placed on the surface of the sand and a stiffened steel plate (100 mm clear of the internal diameter) was seated on the timber boards. A vibrating compaction plate (VCP) was placed upon the stiffened steel plate; the soil then being vibrated until it reached its target density. Measurements of the final soil depth were then recorded. The VCP, stiff-ened steel plate and timber boards are removed from the container with care such that the soil surface remains undisturbed. This was repeated until the container was filled. A cavity was then excavated to accommodate the charge, at the correct burial depth. Excavated material was stored in sealed bags, in order to back fill to the correct density and moisture content.
[image:5.595.72.291.71.264.2]For the full saturation tests the soil bins are filled using the above procedure to a designated dry density and then saturated from the base. Any collapse settlement during the saturation process is accounted for in the initial target dry density to achieve the same bulk density in each test. The base saturation is achieved by burying a length of perforated hose, using a tim-ber spacer to achieve an even hose distribution (Fig. 4a). This spacer is then removed once enough soil has been added to secure the hose location (Fig. 4b). The bin is then filled in the usual manner with the hose being led up the inner wall to allow for saturation prior to firing. This method of flooding has been found to give a more uniform distribution of moisture con-tent through the soil mass, so long as the flow rate used for saturation is insufficient to cause piping.
Figure 4: Bottom-up saturation technique a) spacer present
[image:5.595.113.482.599.733.2]b) part-filled with spacer removed
Figure 3: Scanning electron micrograph of
Once filled a cavity is excavated to accommodate the charge at the correct burial depth. Ex-cavated material is segregated in sealed bags in order to back fill to the correct density and moisture content. Special care is taken with the saturated tests to minimise the disturbance to the rest of the sample as the soil has a tendency to collapse.
1.4. Data capture
The event is filmed with a high speed camera, allowing the relative movement of the refer-ence and object target markers to be tracked. From these data the initial impulse (assuming it is applied instantaneously) can be calculated. Full details of this technique can be found in [2, 4].
2. Results and discussion
The focus of this paper is not directly compare the magnitude of the impulses generated, but to compare the variance in the impulses from the mean for a given test series. All the tests conducted here were subject to the same threat configuration, charge size (625g PE4) and burial depth (50 mm).
The results have been generated as a variation from the mean for each test (3 tests), thus in the results presented each data point represents three individual tests. This variation has then been divided by the mean impulse for the three tests and is expressed in the figures as a per-centage. The impulse data can be plotted against other geotechnical parameters such as bulk
density and moisture content, and a third ‘burial conditions’ measure. The burial conditions
[image:6.595.118.475.497.717.2]measure is expressed as the sum of the standard deviations of the bulk densities and the mois-ture contents for the same 3 tests in each series. This gives an indication of the variation in the impulse produced versus the repeatability of the compaction technique for each of the soils.
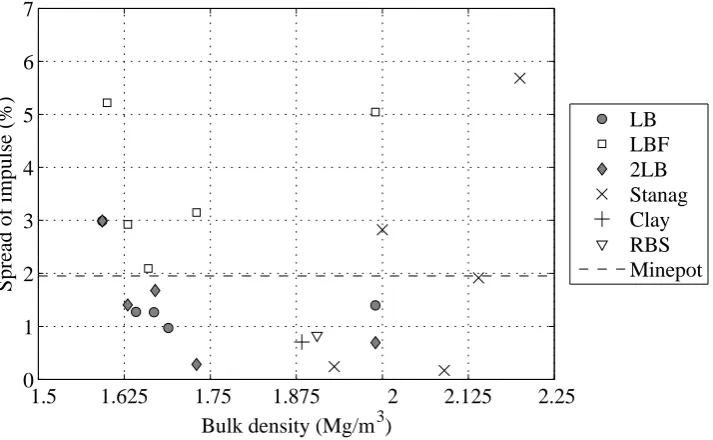
Figure 5: Spread of impulse versus bulk density
1.50 1.625 1.75 1.875 2 2.125 2.25
1 2 3 4 5 6 7
Bulk density (Mg/m3)
S
p
re
ad
o
f
im
p
u
ls
e
(%
)
The spread of impulse in percent is plotted against bulk density in Figure 5. For comparison the impulse data are plotted for the minepot tests (the minepot spread is a line as there is no soil present, hence the bulk density is irrelevant). This clearly shows that for certain soil types at specific bulk densities it is possible to achieve a lower spread on the results than seen in the minepot tests, which are designed to be one of the most repeatable tests. In fact mine-pot tests are commonly favoured due their highly repeatable nature. These data presented here show that whilst the minepot standard is repeatable, there are specific soil conditions which will give more repeatable data. Figure 5 also shows that the largest variations in
im-pulse are seen in the well graded soils – Stanag and LBF. The LBF spread was consistently
greater than that seen in the minepot. Unlike LBF though the Stanag proved more repeatable than the minepot in 60% of cases. The most repeatable impulse data came from the LB data series which showed consistently less spread than the minepot. Figure 5 also shows that there is no correlation between the bulk density of the soil being used and the spread of impulse.
Figure 6 shows the same impulse data plotted against moisture content, where the same trends as shown in Figure 5 are apparent due to the intrinsic linking of moisture content and bulk density. The fully saturated tests here are easier to identify, sitting at ~25%, the notable exception being the Stanag soil which sits at a moisture content of 14% when fully saturated
with a bulk density of 2.2 Mg/m3. The maximum spread of 5.7% for the fully saturated
Sta-nag may at first glance seem large, but this is mainly due to the fact that other soil types / conditions are incredibly repeatable. When paralleled with the literature with researchers [7] reporting variations in free air testing of 50-130% for nominally similar tests when compared to the Kingery-Bulmash predictions [8], the quality of the current testing is emphasized.
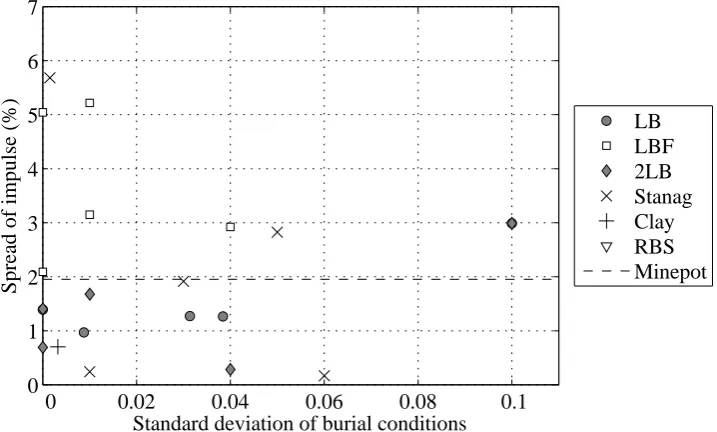
Figure 7 plots the previously mentioned ‘burial condition’ measure versus the spread of im-pulse dataset. On the horizontal axis, a low value means that both the moisture content and bulk density are repeatable using the preparation methodology outlined earlier. This shows that the 2LB soil was actually the most difficult to consistently prepare, from correlating the impulse spread with Figures 5 and 6 it can be seen that this was the dry soil with a bulk
den-sity of 1.6 Mg/m3. The 2LB soil in this state is very susceptible to vibrations as this will
cause the soil to densify and give a variation in impulse. For the saturated Stanag, the prepa-ration was very repeatable with the bins showing very little variation in the geotechnical
con-Figure 6: Spread of impulse versus moisture content
0 5 10 15 20 25 30
0 1 2 3 4 5 6 7
Moisture content (%)
[image:7.595.107.464.265.482.2]ditions, yet a relatively high degree of impulse variation. It has been hypothesised that due to the well graded nature of the Stanag this leads to a non-uniform breakout which can give rise
to the minimal variations seen. For uniform materials such as LB the breakout is more uniform giving a more repeatable spread on impulse.
3. Conclusions
It has been shown that through careful soil preparation many soils can deliver a lower spread of impulse than seen when using the standard minepot tests described in AEP-55 [5]. The maximum spread seen in any test was 5.7%.
The particle size distribution for cohesionless soils has been shown to be an indicator of the possible variation in impulse to be expected. This was shown previously in [4] but has herein been shown to apply to a much greater range of soils. Currently the dataset for cohesive soils (clay) is very small, but also showing a high degree of repeatability.
[image:8.595.107.466.126.342.2]Well graded soils show a greater variation in the spread of measured impulse for any given moisture content, which could be due to local variations in density caused by the non-uniform nature of the soil. This illustrates the fact that despite very high control over the ge-otechnical conditions if repeatability in the output of tests is required a uniform soil should be utilized in the testing. This if of course postulated on the transfer of global impulse and takes no account of the localised loading effects which could be generated by changing be-tween uniform and well graded materials. This area of work is current being investigated in a separate project, details of which are available here [9].
Figure 7: Spread of impulse versus standard deviation of burial conditions
0 0.02 0.04 0.06 0.08 0.1
0 1 2 3 4 5 6 7
Standard deviation of burial conditions
S
p
re
ad
o
f
im
p
u
ls
e
(%
)
ACKNOWLEDGEMENTS
The research reported herein was conducted on behalf of the Defence Science and Technolo-gy Laboratory, Programme Delivery Directorate, Porton Down, UK.
REFERENCES
[1] Hlady, S. L., 2004, Effect of soil parameters on landmine blast, 18th Int. Sym. on the Military Aspects of Blast and Shock, Bad Reichenhall, Germany.
[2] Clarke, S D, Warren, J A & Tyas, A., 2011, The influence of soil density and moisture content on the im-pulse from shallow buried explosive charges. Proceedings of the International Symposium on Interaction of the Effects of Munitions with Structures, September 19-23, Seattle, US.
[3] McShane, G., Deshpande, V. & Fleck, N., 2013, A laboratory-scale buried charge simulator, International Journal of Impact Engineering 62, 210-218.
[4] Clarke, S D, Warren, J A, Fay, S D, Rigby, S E & Tyas, A., 2012, The role of geotechnical parameters on the impulse generated by buried charges. 22nd International symposium on the Military Aspects of Blast and Shock, November 5-9, Bourges, France.
[5] NATO, 2006, Procedures for evaluating the protection level of logistic and light armoured vehicles, Allied Engineering Publication (AEP) 55 Vol.2 (for Mine Threat).
[6] Cai, Y., Yu, H., Wanatowski, D. & Li, X., 2013, Non-coaxial behavior of sand under various stress paths, Journal of Geotechnical and Geoenvironmental Engineering, 139(8), 1381-1395.
[7] Netherton, M. D. & Stewart, M. G., 2013, The Variability of Blast-loads from Military Munitions and Ex-ceedance Probability of Design Load Effects. In 15th International Symposium on the Interaction of the Effects of Munitions with Structures (ISIEMS), Potsdam, Germany.
[8] Kingery, C. N. & Bulmash, G., 1984, Airblast parameters from TNT spherical air burst and hemispherical surface burst. Technical Report ARBRL-TR-02555, U.S Army BRL, Aberdeen Proving Ground, MD, USA.
![Figure 3: Scanning electron micrograph of Leighton Buzzard sand [6]](https://thumb-us.123doks.com/thumbv2/123dok_us/7928694.193290/5.595.113.482.599.733/figure-scanning-electron-micrograph-leighton-buzzard-sand.webp)