A Computational Fluid Dynamic Analysis Of The Effect Of Weld
Nozzle Geometry Changes On Shielding Gas Coverage During Gas
Metal Arc Welding
Campbell, S.W.
1*, Galloway, A.M.
1, Ramsey, G.M.
1, McPherson, N.A.
21 Department of Mechanical & Aerospace Engineering, University of Strathclyde, Glasgow, Scotland, United Kingdom
2 BAE Systems Naval Ships, Glasgow, Scotland, United Kingdom
Abstract
Three geometry changes to the inner bore of a welding nozzle and their effects on weld quality during gas metal arc welding (GMAW) were investigated through the use of computational fluid dynamic (CFD) models and experimental trials. It was shown that an increased shielding gas exit velocity increased the gas column’s stability and therefore its resistance to side draughts. Double helix geometry within the nozzle reduced the gas column’s stability by generating a fast moving wall of gas around a slow moving centre. A pierced internal plate initially increased the gas velocity, however, the nozzle was unable to maintain the velocity and the change produced gas columns of similar stability to a standard nozzle. A pierced end plate produced the best results, increasing the shielding gases exit velocity sufficiently to marginally outperform the standard 16 mm welding nozzle.
Keywords: CFD; GMAW; Shielding gas coverage; Nozzle geometry; Side draughts
Introduction
The majority of welding processes require the protection provided through the use of shielding gases during the arc transfer and solidification processes, ensuring
atmospheric contaminants do not reach the weld surface and surrounding area. The correct shielding gas flow rate is essential to ensure a high quality weld, insufficient flow can compromise weld quality by introducing defects, including the formation of porosity in the solidified weld as shown by Tani et al. [1]. It has been shown that the appearance and quality of the final weld is influenced by the shielding gas composition [2] and flow rate used [3,4]. Shielding gases are commonly supplied to the welding region in a variety of premixed configurations in order to take advantage of the
(GMAW) process, whilst carbon dioxide is often added to argon-based mixtures due its ability to improve the arc stability when compared to welding with pure argon, thus producing a more consistent weld appearance as shown by Vaidya [5]. An argon/carbon dioxide (80/20) mixture is commonly used in Western Europe for GMAW shielding gas, especially in the carbon steel fabrication industry.
The correct shielding gas flow rate is dependent upon the welding process, operating parameters, welding orientation and shielding gas composition. Campbell et al. [4] showed that a shielding gas flow rate of 6 l/min can produce good quality welds in a draught free environment; however, it is often the case that shielding gas flow rates of 15-18 l/min are used in GMAW. It is a common misconception that more gas
produces better quality welds, and as a result shielding gas flow rates can be set as high as 25 l/min. However, it has been shown that at flow rates above approximately 23 l/min, turbulence is induced in the shielding gas column [6], drawing atmospheric gases into the weld region potentially creating defects in the solid weld. This turbulent effect has also been found to occur at weld initiation [7,8] where, depending on the set up, an initial surge of shielding gas, due to a build up in line pressure, is delivered to the weld region compromising the stability of the shielding gas column.
rates are detrimental to the shielding gas columns stability, therefore potentially introducing defects to the solidified weld.
A finite element model of a GMAW welding nozzle was developed by Dreher et al. [9,10] using ANSYS CFX to analyse the affect of turbulence on shielding gas
distribution, and found that turbulence significantly affects conditions at the work piece. A similar model, also using ANSYS CFX, developed by Schnick et al. [11], simulated the arc plasma and shielding gas flows with some success, incorporating the effects of electromagnetism in the fluids and solid.
Ramsey et al. [3] used a simplified arc plasma assumption to investigate the effect of side draughts on weld quality and potential remedies to the problem using CFD simulation. A 12 mm diameter hemisphere of constant temperature was used to
represent the arc plasma, which produced results that correlated closely with the
experimental data presented. The effect that the addition of a circumferential restriction to the nozzle exit had on the shielding gas efficiency was investigated, thus replicating the effect of spatter build-up. A critical ratio of shielding gas flow rate to side draught velocity of 2-2.5 was determined for a conventional 16 mm nozzle, which reduced to 1.5 and 0.8 for a restricted 14 and 11 mm nozzle respectively. Therefore indicating that a decrease in welding nozzle exit diameter considerably improved the shielding gas’s resistance to side draughts due to an increase in the shielding gas exit velocity, which was explained due to a conservation of mass.
The present study aims to build upon previous research which showed that a circumferential restriction around the nozzle exit has the ability to considerably improve the shielding gas columns resistance to the detrimental effects of cross draughts. As a result, this study aims to further refine the nozzle geometry in order to further reduce the shielding gas consumption by investigating the effects that the internal nozzle geometry has on the shielding gas flow characteristics i.e. through the addition of a double helix insert, a restricted end plate and an internal plate. A CFD model, validated through extensive experimental trials was used to determine the susceptibility of each different nozzle design to side draughts when using various shielding gas flow rates.
Modelling
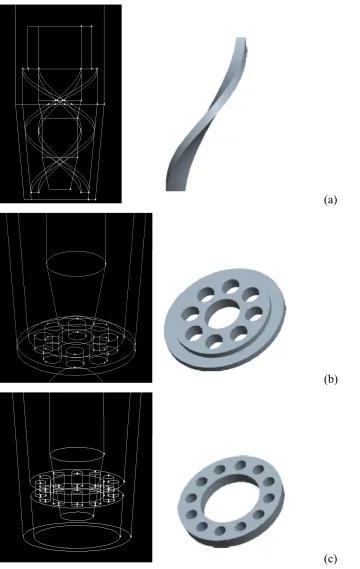
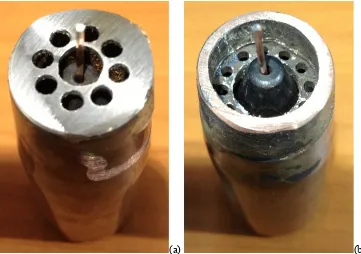
A multi-physics, 3D transient state model was developed for several geometry changes using the CFD software Fluent, as detailed in a previous study [3], which takes into account buoyancy forces, turbulence, convection and radiation. The nozzle geometries evaluated were a conventional 16 mm nozzle, and three modifications to this nozzle: a double helix on the internal surface of the nozzle, a restricted end plate and an internal plate located 3 mm above the end of the contact tip within the nozzle containing several openings for gas flow. Figures 1a, b and c show these geometry changes as they were modelled in Gambit and Pro-Engineer. In order to validate the CFD model, extensive experimental trials were conducted which replicated the geometry and welding conditions simulated.
Fig. 1.
principle flow development to be captured during analysis. The overall model consisted of approximately 190,000 tetrahedral elements, the density of which was greatly
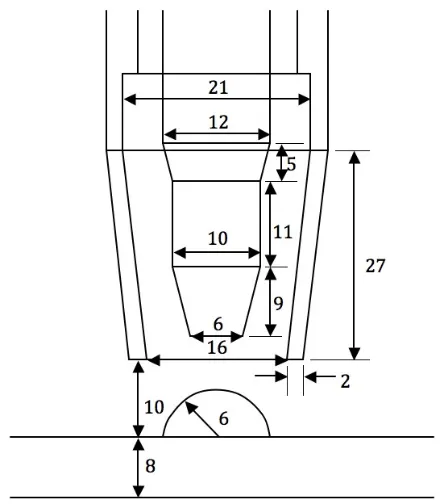
increased in the volume surrounding the nozzle outlet. A 12 mm diameter hemisphere positioned directly below the nozzle represented the welding arc region, as shown in Figure 2, which was detached from the surrounding fluid enabling it to be assigned independent properties. The welding arc, i.e. the hemisphere, was assigned a constant temperature, which was found to produce the correct level of heat transfer validated through thermocouples in the experimental setup.
Fig. 2.
The simplification of the arc plasma can be justified based on studies conducted on the gas tungsten arc welding process which showed that the shielding gas
composition, welding current, arc length and electrode geometry were the dominant factors influencing the arc pressure distribution [12-14]; all of which are constants in the present study. Furthermore, a study [15] showed that the shielding gas pressure has negligible effect on the arc pressure distribution. This led to the assumption that the arc pressure distribution in this study can be assumed constant from which various forces (e.g. arc force, arc shear stresses and Lorentz magnetic forces) can be numerically derived [16-17].
However, the arc plasma is proven to be an intricate and complex problem requiring energy and heat flows, and magnetic reactions to be modelled accurately. It has been shown in recent research [3] that modelling the arc plasma as a hemispherical volume at constant temperature, whilst this assumption would not provide sufficient data for aspects of arc modelling, allowed for the accurate simulation of the shielding gas flow when compared to an experimental validation. Therefore the same
The side draught of air was modelled as a 25 x 40 mm (height x width) velocity inlet on the surface of the 3D domain, perpendicular to the direction of travel. This generated a uniform, laminar airflow as this best correlated with the conditions
produced during experimental validations, the velocity of which could be measured in the region between the nozzle and plate surface.
Each change in nozzle geometry was subjected to a side draught of 0-3.6 m/s (0-8 mph) in 0.45 m/s (1 mph) increments, whilst supplying the shielding gas at flow rates of 5, 10, 15 and 18 l/min. The shielding gas was defined as a mass flow inlet boundary condition, located on the upper internal surface of the computational nozzle which, as well as allowing flow rates to be set, enabled species concentrations to be defined. Fluent uses a user defined flow inlet to compute the mass flow rate, momentum fluxes and fluxes of energy and chemical species. The shielding gas used during this
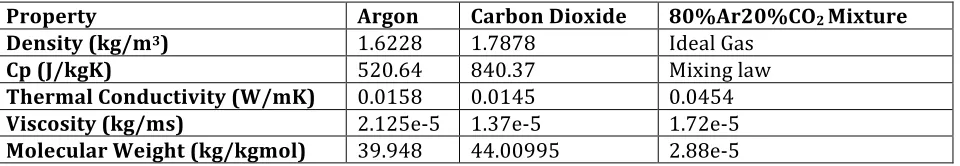
investigation was 80%Ar/20%CO2, and was defined in Fluent by selecting the individual gas (argon and carbon dioxide) and applying the rule of mixtures for their respective ratios. These properties are shown in Table 1 and are temperature dependant.
Table 1.
Experimental Validation
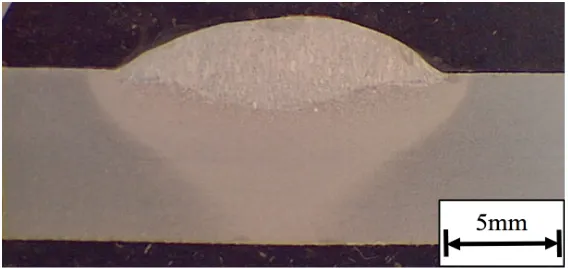
Experimental validation was performed through means of bead on plate welds on 8 mm think DH36 steel. These welds were deposited using an automatic welding rig, which moved a 250 x 500 x 8 mm plate at a set velocity of 3.2 mm/s corresponding with the plate velocity set in simulations. The plate is moved below a, centrally located,
A Miller XMT 304 series DC arc welding unit supplying a constant voltage (however, since the parameters, i.e. wire feed speed, arc length etc., were maintained constant, the current was also constant) was used throughout experimentation. 1.2 mm diameter SF-1A flux cored filler wire with a feed speed of 120 mm/s was maintained constant throughout. As with the computational trials, the shielding gas used during the experimental validation was 80%Ar/20%CO2, the gas flow rate of which was monitored using a dedicated welding monitor and set to flow rates of 5, 10, 15 and 18 l/min as required. The arc current and voltage was also measured throughout the trials using a pre-calibrated portable arc monitoring system. This returned average welding
parameters of 24.6 V and 225 A for arc voltage and current respectively.
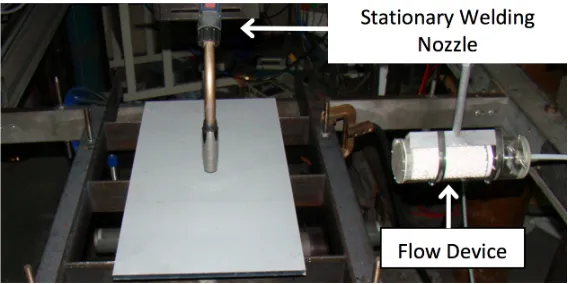
A side draught was produced by means of an air supply passing through an adjustable laminar flow device, with a 20 x 25 mm outlet. This was positioned 300 mm from the centre of the welding nozzle and directed towards the shielding gas column at an angle 90 degrees to the weld direction as shown in Figure 4. Using a pre-calibrated hot-wire anemometer, the draught velocity in the region between the welding nozzle and plate surface was measured, enabling it to be set to the appropriate velocity for each trial. Throughout the experimental validation, side draught velocities of 0-3.6 m/s (0-8 mph) in 0.45 m/s (1 mph) increments were used.
Fig. 4.
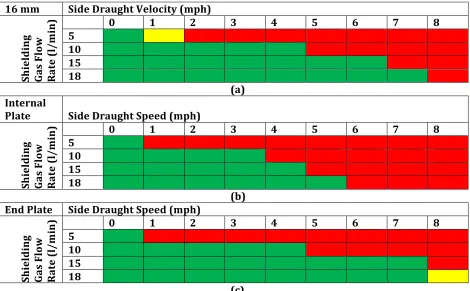
The weld quality was evaluated using X-Ray inspection, and graded according to the amount of porosity present. Green indicates a clean weld free from porosity and a pass, yellow indicates a borderline result free from harmful porosity and red indicates a fail due to a highly porous weld. Tables 2a, b and c show the X-ray inspections results.
Computational Results
Each model was solved as a transient simulation consisting of 5, 10, 15 and 18 l/min shielding gas flow rates subjected to side draught velocities of 0-3.6 m/s (0-8 mph). A transient simulation was performed for each condition was based on information from an experimental study obtained using laser backlighting which showed that the “heated plate” had the effect of raising the cross draught from the surface of the plate,
effectively providing the welding region with a level of protection from the cross draft. Images were analysed midway along the plate to ensure that the plate had been exposed to the same heat input, therefore requiring the draught to pass over the same with of “heated plate”. These results were evaluated using contour plots of mass concentration of argon enabling the diameter of the 100% shielding gas column (80% argon) to be measured through scaling of the plots to actual size. Figures 5a, b and c demonstrate a drifting of the shielding gas column as it is subjected to increasing side draught velocities.
Fig. 5.
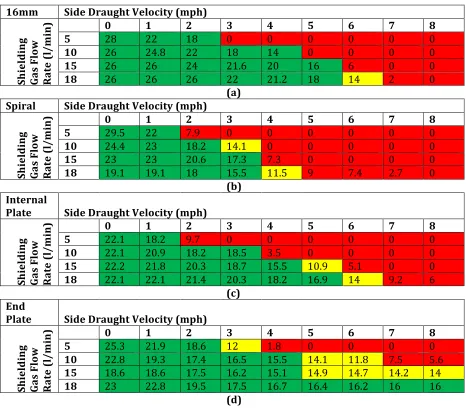
Tables 3a, b, c and d show the diameter of shielding gas coverage, an example of the measurement taken is shown in Figure 5a, for each geometry change to the welding nozzle with respect to the shielding gas flow rate and side draught velocity.
Table 3.
were of reduced quality (yellow) and 15 mm and above diameter columns were classified as good quality (green).
Fig. 6.
From Table 3a, the 16 mm results show an increasing resistance to side draughts as the flow rate of the shielding gas exiting the nozzle increased, resulting in the 15 and 18 l/min shielding gas flow rates achieving good quality coverage when subjected a side draught of up to 5 mph. All nozzle geometry changes demonstrate a similar pattern as shielding gas flow rate increases. From Table 3b, the addition of an internal double helix to the nozzle can be seen to have a detrimental effect on the gas columns ability to resist side draughts, while the internal plate achieved results similar to that of the
conventional 16 mm nozzle. From Table 3d, it is evident that the end plate was the only geometry change that marginally increased the shielding gas columns resistance to side draughts, achieving good quality coverage under an 8 mph side draught with a shielding gas flow rate of 18 l/min.
Each change has produced gas columns of at least 19 mm diameter in draught free conditions. However, it is evident that good quality welds can be produced using shielding gas columns as small as 15 mm. The 16 mm conventional nozzle can yield a 26 mm gas column from an 18 l/min shielding gas flow rate. However, under a side draught of 7 mph this is reduced to a 2 mm column and a bad quality weld. The nozzle containing the end plate produced a column of 23 mm diameter and maintained a good quality level while subjected up to and including an 8 mph side draught. It is evident that the gas column from the end plate is superior in stability when compared to the conventional nozzle. This is due to the shielding gas’s exit velocity.
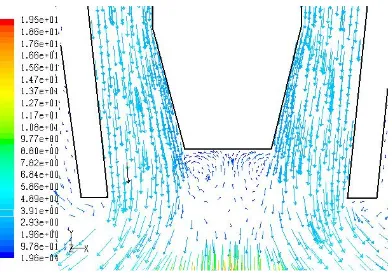
exit. Ramsey et al. [3] found that the higher the shielding gas exit velocity, the greater the shielding gas column’s resistance to side draughts. Figure 7 is the velocity vector plot for a shielding gas flow rate of 15 l/min of a conventional 16 mm welding nozzle, which shows that the shielding gas exits the nozzle with a velocity of approximately 1.35 m/s (3 mph). When compared with Figure 8, a velocity vector plot of the same conditions for the double helix nozzle, the velocities generated through the nozzle exit are approximately 0.9 m/s (2 mph) higher than that generated through the conventional 16 mm nozzle.
Fig. 7. Fig. 8.
However, from Table 3b, it can be observed that the double helix nozzle does not perform well. This has been attributed to a combination of effects: reversed flow in the central section and a cyclone effect being generated within the nozzle as a result of the shielding gas being forced to revolve around the central welding tip. As can be seen in Figure 8, the shielding gas has reversed flow in the central column (beneath the contact tip), with the shielding gas flowing back towards the nozzle. The shielding gas continues to rotate as it leaves the nozzle creating a high velocity wall of rotating gas around a much lower velocity centre. This is demonstrated in Figure 9, which shows the velocity vectors of the shielding gas from above just before reaching the plate.
Fig. 9.
velocity will increase. However, upon reaching the nozzle exit, the shielding gas has lost the momentum gained due to being forced through small cross-sectional areas reducing the exit velocity to approximately 1.35 m/s (3 mph). The 6 mm from the inserted plate to the nozzle exit is substantial enough to allow the shielding gas to expand out into the larger cross sectional area of the nozzle exit increasing the pressure and reducing its velocity, thus explaining why its results are very similar to those of a conventional nozzle.
Fig. 10. Fig. 11.
The end plate forces the shielding gas through a reduced cross-sectional area increasing its velocity to 4.05 m/s (9 mph) at the nozzle exit. As a result, this geometry produced the best performance of those investigated. However, a previous study by Ramsey et al. [3] found that reducing the nozzle exit diameter to 11 mm produced shielding gas exit velocities above 4.5 m/s (10 mph) and consequently out performs those changes that have been investigated in this study. Additionally, spatter build-up on the welding nozzle is unavoidable in practice, and can be minimised by good control of the welding parameters, the 2 mm diameter holes in the end plate may be more susceptible to blockage than a circumferential restriction.
A comparison of the experimental trials in Tables 2 a, b and c with the
performed the assumption can be made that the results from the double helix nozzle model are accurate.
Conclusions
A CFD model has been developed to determine the effects of geometry changes in the welding nozzle on the shielding gas flow coverage during GMAW. The conclusions may be summarised as follows:
1. The experimental validation supports the conclusions drawn from the CFD modelling and confirms that shielding gas column diameter and shielding gas exit velocity can be related to weld quality.
2. Both the CFD model and experimental trials have highlighted the significant effect side draughts have on shielding gas columns, and consequently weld quality. As anticipated, there is a progressive decrease in the shielding gas coverage and quality as side draught velocity increases.
3. From the computational modelling it is evident that, as the exit velocity of the shielding gas increases, the stability of the gas column increases, therefore increasing the columns resistance to side draughts.
4. In side draught free conditions a conventional nozzle can generate a shielding gas column of 26 – 28 mm diameter which is an excessive amount considering both the CFD model and experimental trials have demonstrated that a good quality weld can be produced from a 15 mm diameter shielding gas column. 5. This investigation has found that the end plate insert performed best due to the
6. The double helix insert causes a cyclone phenomenon within the shielding gas column where by a high velocity wall of gas rotates around a much slower moving centre. This column is less stable than a conventional column and is more susceptible to side draughts.
7. A comparison of this study’s findings with a previous study [3] which found that reducing the nozzle diameter to 11 mm using a circumferential restriction
produced results superior to all geometry changes investigated in the present study. In addition, the 2 mm diameter holes in the end plate may be more susceptible to blockage in practice than a circumferential restriction.
Acknowledgments
The authors would like to acknowledge the funding provided by BAE Systems Surface Ships Limited, which has made this research possible.
References
1. Tani, G., Campana, G., Fortunato, A., Ascari, A. 2007. The influence of shielding gas in hybrid laser-MIG welding. Applied Surface Science, 253, pp. 8050-8053.
2. Campbell, S.W., Galloway, A.M., McPherson, N.A. 2011. Techno-economic evaluation on the effects of alternating shielding gases for advanced joining processes. Proceedings of IMechE Part B: Journal of Engineering Manufacture, 25, pp. 1683-1872. DOI: 10.1177/0954405411408353
Journal of Materials Processing Technology, 212(8), pp. 1694-1699. DOI: 10.1016/j.jmatprotec.2012.03.017
4. Campbell, S.W., Galloway, A.M., McPherson, N.A. 2012. Techno-economic evaluation of reducing shielding gas consumption in GMAW whilst maintaining weld quality. International Journal for Advanced Manufacturing Technology. 63, pp. 975-985. DOI: 10.1007/s00170-012-3961-2.
5. Vaidya, V. 2002. Theory and practice of shielding gas mixtures for semi-automatic welds. Welding Journal, pp. 43-48.
6. Lyttle, K., Stapon, G. 2005. Simplifying Shielding Gas Selection. Practical Welding Today, 9, No. 1.
7. Uttrachi, G.D. 2007. GMAW shielding gas flow control systems. Welding Journal, 86(4), pp. 22-23.
8. Loxton Industries. 2010. New Welding Gas Innovation. Australasian Welding Journal, 55(1), pp. 10-11.
9. Dreher, M., Füssel, U., Schnick, M. 2010. Numerical optimization of gas metal arc welding torches using ANSYS CFX. In: Proc. 63rd Annual Assembly and Int. Conf. of the Int. Institute of Welding, Istanbul, Turkey, 11-17 July 2010.
10. Dreher, M., Füssel, U., Schnick, M., Hertel, M. 2009. Numerical simulation of the shielding gas flow with GMA welding and options of validation by
diagnostics. Materials Science and Technology, 2, pp. 39-49.
Scientific Colloquium, Modeling for Material Processing, Riga, June 8-9, 2006 12. Lin, M.L., Eager, T.W. 1986. Pressures produced by gas tungsten arcs.
Metallurgical Transactions B. 17B, pp. 601-607.
13.Campbell, S.W., Galloway, A.M., McPherson, NA. Arc pressure and weld
metal fluid flow whilst using alternating shielding gases – part 1: arc pressure measurement. Science and Technology of Welding and Joining. Under review.
14.Fan, H.G., Shi, Y.W. 1996. Numerical simulation of the arc pressure in gas tungsten arc welding. Journal of Materials Processing Technology. 61(1996), pp. 302-308.
15.Ham, H.-S., Oh, D.S., Cho, S.-M. 2012. Measurement of arc pressure and shield gas pressure effect on surface of molten pool in TIG welding. Science and Technology of Welding and Joining. 17(7), pp. 594-600.
16.Oh, D.-S., Kim, Y.-S., Cho, S.-M. 2005. Derivation of current density distribution by arc pressure measurement in GTA welding. Science and Technology of Welding and Joining. 10(4), pp. 442-446.
17.Campbell, S.W., Galloway, A.M., McPherson, NA. Arc pressure and weld
A Computational Fluid Dynamic Analysis Of The Effect Of Weld
Nozzle Geometry Changes On Shielding Gas Coverage During Gas
Metal Arc Welding
Table 1: The required properties of Argon, Carbon Dioxide and the resulting mixture
Table 2: Radiographic assessment results for (a) conventional 16 mm nozzle, (b) internal plate and (c) end plate
A Computational Fluid Dynamic Analysis Of The Effect Of Weld
Nozzle Geometry Changes On Shielding Gas Coverage During Gas
Metal Arc Welding
Figure 1: Conventional welding nozzle showing (a) Double helix insert, (b) End plate and (c) Internal plate, geometry changes for CFD simulation
Figure 2: Nozzle and arc geometry generated in Gambit (units in mm)
Figure 3: Conventional welding nozzle showing (a) End plate and (b) Internal plate, geometry changes for experimental validation
Figure 4: Experimental setup
Figure 5: 10 l/min shielding gas column (mass concentration of argon) when subjected to cross draughts of (a) 0 m/s (0 mph) (showing 26 mm diameter, 80% argon i.e. 100% shielding gas coverage), (b) 1.8 m/s (4 mph) and (c) 3.6 m/s (8 mph)
Figure 6: Macro of experimental validation weld
Figure 7: A velocity (m/s) vector plot of a 15 l/min shielding gas for a 16 mm nozzle Figure 8: A velocity (m/s) vector plot of a 15 l/min shielding gas for a spiralled nozzle Figure 9: A velocity (m/s) vector plot of a 15 l/min shielding gas for a spiralled nozzle from above (showing 16 mm nozzle exit)
Figure 10: A velocity (m/s) vector plot of a 15 l/min shielding gas for a nozzle with in inserted plate
Property Argon Carbon Dioxide 80%Ar20%CO2 Mixture
Density (kg/m3) 1.6228 1.7878 Ideal Gas
Cp (J/kgK) 520.64 840.37 Mixing law
Thermal Conductivity (W/mK) 0.0158 0.0145 0.0454
Viscosity (kg/ms) 2.125e-‐5 1.37e-‐5 1.72e-‐5
[image:19.595.82.562.70.153.2]Molecular Weight (kg/kgmol) 39.948 44.00995 2.88e-‐5
16 mm Side Draught Velocity (mph)
Sh
iel
d
in
g
Ga
s
Fl ow Ra te ( l/ m in
) 0 1 2 3 4 5 6 7 8
5
10
15
18
(a)
Internal
Plate Side Draught Speed (mph)
Sh
iel
d
in
g
Ga
s
Fl ow Ra te ( l/ m in
) 0 1 2 3 4 5 6 7 8
5
10
15
18
(b)
End Plate Side Draught Speed (mph)
Sh
iel
d
in
g
Ga
s
Fl ow Ra te ( l/ m in
) 0 1 2 3 4 5 6 7 8
5
10
15
18
[image:20.595.85.555.69.360.2](c)
16mm Side Draught Velocity (mph)
Sh
iel
d
in
g
Ga
s
Fl ow Ra te ( l/ m in
) 0 1 2 3 4 5 6 7 8
5 28 22 18 0 0 0 0 0 0
10 26 24.8 22 18 14 0 0 0 0
15 26 26 24 21.6 20 16 6 0 0
18 26 26 26 22 21.2 18 14 2 0
(a)
Spiral Side Draught Velocity (mph)
Sh
iel
d
in
g
Ga
s
Fl ow Ra te ( l/ m in
) 0 1 2 3 4 5 6 7 8
5 29.5 22 7.9 0 0 0 0 0 0
10 24.4 23 18.2 14.1 0 0 0 0 0
15 23 23 20.6 17.3 7.3 0 0 0 0
18 19.1 19.1 18 15.5 11.5 9 7.4 2.7 0
(b)
Internal
Plate Side Draught Velocity (mph)
Sh
iel
d
in
g
Ga
s
Fl ow Ra te ( l/ m in
) 0 1 2 3 4 5 6 7 8
5 22.1 18.2 9.7 0 0 0 0 0 0
10 22.1 20.9 18.2 18.5 3.5 0 0 0 0
15 22.2 21.8 20.3 18.7 15.5 10.9 5.1 0 0
18 22.1 22.1 21.4 20.3 18.2 16.9 14 9.2 6
(c)
End
Plate Side Draught Velocity (mph)
Sh
iel
d
in
g
Ga
s
Fl ow Ra te ( l/ m in
) 0 1 2 3 4 5 6 7 8
5 25.3 21.9 18.6 12 1.8 0 0 0 0
10 22.8 19.3 17.4 16.5 15.5 14.1 11.8 7.5 5.6
15 18.6 18.6 17.5 16.2 15.1 14.9 14.7 14.2 14
18 23 22.8 19.5 17.5 16.7 16.4 16.2 16 16
[image:21.595.84.550.66.474.2](d)
(a)
(b)
[image:22.595.85.445.66.635.2](c)
(a) (b)