Impulse-driven Surface Breakdown Data:
A Weibull Statistical Analysis
Mark P. Wilson,
Member, IEEE
, Martin J. Given,
Senior Member, IEEE
, Igor V. Timoshkin,
Member, IEEE
,
Scott J. MacGregor,
Member, IEEE
, Tao Wang, Mark A. Sinclair,
Member, IEEE
,
Kenneth J. Thomas,
Senior Member, IEEE
, and Jane M. Lehr,
Fellow, IEEE
Abstract—Surface breakdown of oil-immersed solids chosen to insulate high-voltage, pulsed-power systems is a problem that can lead to catastrophic failure. Statistical analysis of the breakdown voltages, or times, associated with such liquid-solid interfaces can reveal useful information to aid system designers in the selection of solid materials. Described in this paper are the results of a Weibull statistical analysis, applied to both breakdown-voltage data and time-to-breakdown data generated in gaps consisting of five different solid polymers immersed in mineral oil. Values of the location parameterγ provide an estimate of the applied voltage below which breakdown will not occur, and under unifor-m-field conditions,γ varied from 192 kV for polypropylene (PP) to zero for ultrahigh-molecular-weight polyethylene (UHMWPE). Longer times to breakdown were measured for UHMWPE when compared with the other materials. However, high values of the shape parameterβreported in the present paper suggest greater sensitivity to an increase in applied voltage—that is, the probabil-ity of breakdown increases more sharply with increasing applied voltage for UHMWPE compared to the other materials. Analyzing peak-applied-voltage data, only PP consistently reflected a low value ofβacross the different sets of test conditions. In general, longer mean times to breakdown were found for solid materials with permittivity more closely matched to that of the surrounding mineral oil.
Index Terms—Breakdown voltage, dielectric breakdown, flashover, pulse power systems, Weibull distribution.
I. INTRODUCTION
T
HE INTRODUCTION of solid dielectrics into liquid insulation located between two electrical conductors is often necessary to provide mechanical support in subsystems of high-voltage, pulsed-power machines, and it is necessary to understand the insulation behavior of such liquid-solid gaps. Information on the variation in breakdown voltage/time data with an increasing number of breakdown events for liquid-solid gaps subjected to overvoltages, and for break-down initiation measurements, are reported in [1]. Five dif-ferent solid materials were tested, namely polypropylene (PP);Manuscript received October 14, 2011; revised ; accepted December 16, 2011. This work was supported by AWE Aldermaston.
M. P. Wilson, M. J. Given, I. V. Timoshkin, S. J. MacGregor, and T. Wang are with the Department Electronic & Electrical Engineering, University of Strathclyde, G1 1XW Glasgow, U.K. (e-mail: [email protected]; [email protected]; [email protected]; s.macgregor@ eee.strath.ac.uk; [email protected]).
M. A. Sinclair, and K. J. Thomas are with the Pulsed-Power Group, AWE Aldermaston, RG7 4PR Reading, U.K. (e-mail: [email protected]; [email protected]).
J. M. Lehr is with the Sandia National Laboratories, Albuquerque, NM 87185 USA (e-mail: [email protected]).
Digital Object Identifier 10.1109/TPS.2011.2181172
low-density polyethylene (LDPE); ultrahigh-molecular-weight polyethylene (UHMWPE); Rexolite (cross-linked polystyrene); and Torlon (polyamide-imide). The applied voltage wave had a front time of 100 ns and a time to half-value of 600 ns, measured in accordance with IEC 60060-1 [2]. The impulses were of negative polarity and magnitude up to 450 kV. In this paper, the peak applied field necessary to initiate surface breakdown events was found to decrease with increasing rel-ative permittivity of the solid and corresponding increasing permittivity mismatch between the solid and the surround-ing mineral oil. This findsurround-ing is in agreement with those of Taylor [3] and Krins et al. [4], both of which studies found that higher flashover voltages were yielded by matching the permittivity of the parallel solid surface to that of the oil in which it was immersed.
In the case of self-restoring insulation, for example, mineral oil without a solid spacer, lightning-impulse withstand voltage test methods presently used in the power industry include the multiple-level methodand theup-and-down method[2]. These test procedures involve evaluation of the voltage where the probability of the occurrence of a disruptive discharge is 10% (U10), and the withstand test is considered to be passed ifU10
is “not less than the specified impulse withstand voltage.” The present paper is focused on the statistical analysis of the breakdown initiation results reported for both uniform-and nonuniform-field measurements in [1]. The breakdown initiation test procedure used in [1] was similar tothe step-up methodsdescribed by Hirose [5] as being suitable for the esti-mation of the breakdown voltage of non-self-restoring electrical insulation. The initial voltage level applied to the insulation system is sufficiently low in order that no breakdown event will occur. The applied voltage is then increased incrementally. If electrical breakdown of the insulation system occurs, resulting in the generation of experimental breakdown voltage/time data, then the test method can be termed the new step-up method, rather thanthe (conventional) step-up method, where the insula-tion system is not broken [6]. The applied voltage was increased in increments of∼20 kV in [1], resulting in eventual breakdown of the liquid-solid interface in all cases.
A Weibull distribution was utilized for the following analy-sis, where breakdown is assumed to be caused by a weak point in the system [7]. The Weibull distribution has been reported as appropriate for modeling voltages associated with breakdown of insulation systems [8] and can be utilized to estimate the voltage, and hence the electric field, associated with low prob-ability of breakdown for a particular engineering design.
The average streamer propagation velocities implied from time-to-breakdown data are also presented and discussed. Ac-cording to the classification presented in [9], streamers were found to propagate in the third (10–20 km/s) and fourth (100 km/s) modes in nonuniform fields, and in the second (1–5 km/s) and third modes in uniform fields. The upper streamer velocity in the present study was over 100 km/s.
II. EXPERIMENTALARRANGEMENT
The experimental system utilized to generate the breakdown voltage/time data comprised a high-voltage impulse generator, an adaptable test cell, and voltage monitoring diagnostics. The impulse generator is a ten-stage, air-insulated, inverting Marx generator, capable of producing output voltages in the region of 500 kV. The erected capacitance of the generator is 8 nF. The storage capacitors are charged by a positive-polarity, Glassman high-voltage dc supply. A 200 Ω aqueous copper sulphate(CuSO4)wave-tail resistor and a 600ΩCuSO4 wave-front resistor were utilized as wave-shaping components. The impulsefront time was∼100 ns, with atime to half-value of ∼600 ns.
The test cell consists of a pair of aluminium electrodes, between which the solid polymer samples are inserted for testing. The interelectrode gap is readily adjustable by varying the position of the earth electrode, which consists of a 50-mm-diameter plane. A further three interchangeable electrodes, also 50 mm in diameter, are used as high-voltage electrodes. Two of these electrodes (types A and B) provide different nonuniform-field distributions, with features designed to initiate discharges in close proximity to the sample surface: for the type A elec-trode, a 3-mm-long, 1-mm-diameter, tungsten pin protrudes perpendicular to the surface, at a radial distance of 12.5 mm from the electrode center; while for the type B electrode, a 25-mm-diameter, aluminium collar protrudes perpendicular to the surface at the center of the plane. The third type (type C) has no modifications and is used to provide a plane-parallel configuration. For testing, the cell is immersed in∼20 L of EOS Ltd. L10B reclaimed insulating oil.
Three different types of solid dielectric sample (types I, II, and III) were machined to match the geometries of the different high-voltage electrodes, each type being based on a cylinder of diameter 25 mm. A sketch of the various combinations of electrode geometry and sample (AI, BIII, and CIII) used in the present study is shown in Fig. 1. A 3-mm-long, 1-mm-wide recess is cut into the curved surface at one end of the type I samples, to accommodate the pin from high-voltage electrode type A. The type II samples have a 3-mm-long section (“shoulder”) machined to a reduced diameter of 24 mm at the end to be in contact with the high-voltage electrode, allowing them to be used with both type A and type B electrodes. The type III samples have no modifications and can be used with the type B and type C high-voltage electrodes.
[image:2.594.307.553.69.120.2]Prior to treatment, all solid samples were rinsed in warm water with a little detergent to remove any surface grease and then rinsed in isopropyl alcohol and dried in an oven at 50◦C for 1 h to remove surface moisture. Powder-free latex gloves
Fig. 1. Sketch of the tested electrode/sample geometries (AI, BIII, and CIII).
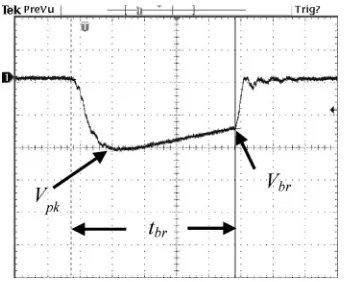
Fig. 2. Voltage waveform illustrating the different parameters recorded for statistical analysis. Vertical scale: 100 kV/division; horizontal scale: 100 ns/division.
were worn throughout the pretreatment process to prevent recontamination of the sample surfaces.
The impulse voltage waveforms were monitored using a Tektronix P6015A probe connected to a tap-off point on a Samtech Ltd. DE(LRP)-02 CuSO4voltage divider (2 kΩinput impedance), giving a measurement system with an overall division ratio of 10 000: 1. The voltage waveforms were viewed and recorded using a Tektronix TDS3032 digital storage oscil-loscope.
III. STATISTICALANALYSIS
Three parameters were extracted from the experimental volt-age waveforms for statistical analysis, as shown in Fig. 2. As breakdown occurred on the impulse falling edge, two voltage levels were recorded, Vpk andVbr, corresponding to the peak
voltage of the breakdown-initiating impulse, and the voltage at the point of breakdown, respectively. The time to breakdown,
tbr, was also recorded.
A. Peak Applied Voltage
First, the experimental data recorded for Vpk in [1] were
subjected to a Weibull statistical analysis, in order to compare the probability of breakdown of the various tested materials at different peak applied voltages. The data were mostly found to be best described by a three-parameter Weibull distribution, where the cumulative probability of failure,F(V), is defined by (1) [7]:
F(V) = 1−exp
−
V −γ α
β
. (1)
For this section of the analysis,V is the peak applied voltage inducing breakdown(Vpk). As normal,αis the scale parameter,
[image:2.594.346.518.145.286.2]TABLE I
WEIBULLDISTRIBUTIONPARAMETERS FORVpk
shape parameter β provides a measure of how sensitive the insulation system is to an increase in voltage, while γ (kV) provides an estimate of the voltage below which the probability of breakdown is zero [10]. If the location parameter,γ, is zero, the distribution becomes a two-parameter Weibull distribution; in this case, the scale parameter, α, can be considered to be the characteristic breakdown voltage. For a two-parameter distribution, the probability of failure (cumulative percentage of breakdowns),F(V), at a voltage ofα(kV) is 0.632, equivalent to the mean of the normal distribution [10]. Whenγis nonzero, the characteristic breakdown voltage can be estimated by the sum ofαandγ.
In order to form probability plots to compare the behavior of the different liquid-solid gaps, the cumulative distribution function is converted into a linear form before plotting. When (1) is rearranged into the form of a straight line(y=mx+c), we find (2):
ln
ln
1 1−F(V)
=βln(V −γ)−βlnα (2)
whereyis equivalent to the left-hand side of the equation,mis equivalent toβ,xcorresponds toln(V −γ), andcis equivalent to−βln(α).
The estimated values of α, β, and γ for each of the ma-terials and electrode types are listed in Table I. Analysis of the parameters was performed using Microsoft Excel, with the Analysis ToolPak add-in loaded, as described in [11]. In certain cases, the data were best described by a two-parameter Weibull distribution—in such instances, the value of the lo-cation parameter, γ, is listed as zero in Table I. When γ is zero,αrepresents the characteristic breakdown voltage, where
[image:3.594.33.292.100.295.2]F(V) = 0.632, and these values are indicated by an asterisk. In order to allow a direct comparison of solid material perfor-mance, the values ofα+γare included in the final column of Table I, to provide an estimate of the characteristic breakdown voltage in all cases. Comparing the values ofα+γ, it is clear that PP has the highest characteristic breakdown voltage for
Fig. 3. Weibull plots and curve fits of peak-applied-voltage(Vpk)data for type I (recess) samples tested with high-voltage electrode type A (pin).
Fig. 4. Weibull plots and curve fits of peak-applied-voltage(Vpk)data for type III (no modifications) samples tested with high-voltage electrode type B (collar).
all geometries. Also, of note is the fact that for plane-parallel electrodes, the characteristic breakdown voltage decreases with increasingεrof the solid, and corresponding increasing
permit-tivity mismatch between the solid and the surrounding mineral oil, as discussed further in Section III-C.
Figs. 3–5 show the form of the Weibull plots. The y-axis values correspond to the left-hand side of (2), and the x -axis values correspond to ln(V −γ). The shape parameter β
describes the gradient of the straight lines fitted to the data in the probability plots in Figs. 3–5. All values of β in Table I are greater than 1, meaning that the probability of breakdown increases with increasing voltage, as would be expected. The higher the value of β, the more sensitive the sample is to an increase in voltage—that is, the probability of breakdown increases more sharply with increasing voltage. The extreme case here is Rexolite for pin-plane geometry (AI), whereβ is 14.5, shown by the steep gradient in Fig. 3.
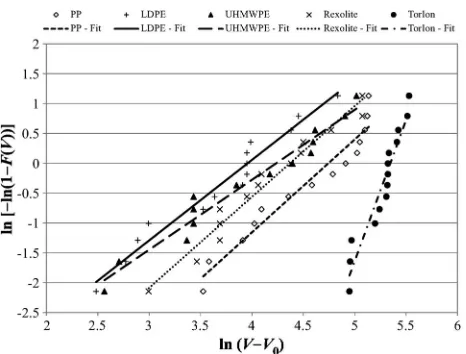
[image:3.594.310.543.287.464.2]Fig. 5. Weibull plots and curve fits of peak-applied-voltage(Vpk)data for type III (no modifications) samples tested with high-voltage electrode type C (plane).
(pin) electrode. The field enhancement under the point-plane geometry can be estimated using (3)[12] to calculate the peak field,Epk, at the tip of the point:
Epk= 2V
rp·ln
4d rp
(3)
whereV is the voltage across the electrodes,rpis the radius of
the pin, anddis the interelectrode gap length. Forrp= 0.5mm,
d= 10 mm, and V up to 450 kV, the estimated peak fields approach 4 MV/cm.
In order to estimate the peak field with collar-plane elec-trodes, this geometry was modeled using the electrostatic field solver QuickField (Tera Analysis Ltd.). The estimated peak field was ∼1 MV/cm, hence the lower β values for the BIII geometry when compared with AI.
The Weibull plots of the peak-applied-voltage data for the collar-plane (BIII) and plane-parallel (CIII) electrodes are shown in Figs. 4 and 5, respectively. Comparing Fig. 3 with the collar-plane plots in Fig. 4, it is clear that the probability of breakdown is generally less sensitive to increasing applied voltage for the type B (collar) electrode than for the type A (pin) electrode, evidenced by the shallower gradients of the collar-plane plots.
The plane-parallel plots (Fig. 5) for PP, LDPE, Rexolite, and Torlon suggest a similar behavior for these materials. The behavior for UHMWPE is best described by a two-parameter Weibull distribution, and hence there is a clear distinction between the UHMWPE plane-parallel plot and those for the other materials.
B. Voltage at Breakdown
The calculated values ofα,β, andγfor each of the materials and electrode types are listed in Table II for the voltage-at-breakdown data. A three-parameter distribution was fit to these data, withV being replaced by recorded values forVbrin (1)
and (2). As in Table I, cases where αrepresents the charac-teristic voltage (γ= 0) have been indicated by an asterisk,
TABLE II
[image:4.594.308.553.105.484.2]WEIBULLDISTRIBUTIONPARAMETERS FORVbr
Fig. 6. Weibull plots and curve fits of voltage-at-breakdown(Vbr)data for type III (no modifications) samples tested with high-voltage electrode type B (collar).
andα+γ values have been listed in the final column. Again, the materials are generally ranked byεr when comparing the
characteristic voltage.
For type I samples tested with high-voltage electrode type A (pin), the data for LDPE, UHMWPE, and Rexolite were all best described by a two-parameter Weibull distribution(γ= 0), and the curves are almost identical. Torlon data were also best described by a two-parameter distribution, although the gradient of the line is twice that of the three aforementioned materials.
TABLE III
WEIBULLDISTRIBUTIONPARAMETERS FORtbr
C. Time to Breakdown
While the clear distinction in material behavior identified in Fig. 6 is interesting, Vbr data were measured on the
im-pulse falling edge. Therefore, time-to-breakdown data were also analyzed to provide a more illuminating analysis of the effect of solid material on the insulation performance of the combined liquid-solid gap. These data were best described by a two-parameter Weibull distribution, where the cumulative probability of failure at timetis defined by (4)[7]:
F(t) = 1−exp
−
t αt
βt
. (4)
For this analysis,twas replaced by data fortbrrecorded in
[1]. The values of αt and βt extracted from the tbr data are
listed in Table III. The scale parameter,αt, can be considered
as the characteristic time to breakdown, asF(t) = 0.632when
t=αt.
Of note from this analysis is the behavior under collar-plane geometry, and the Weibull plots for this data are shown in Fig. 7. It is clear that materials withεrclose to that of the surrounding
mineral oil (εr∼2.2), that is PP (εr∼2.25), LDPE (εr∼
2.2), and Rexolite (εr∼2.5), all show similar performance.
The characteristic time to breakdown, αt, decreases as the
εr of the material increases, however, as evidenced by the
lowerαt values for UHMWPE (εr∼3.0) and Torlon(εr∼
3.9). The high value ofβtfor Torlon, illustrated by the steep
gradient for the Torlon fit in Fig. 7, is indicative of a greater sensitivity to an increase in impulse duration than the other materials.
Analyzing the uniform-field data (geometry CIII), it is evi-dent that the value ofαtfor UHMWPE is actually longer than
that for the other materials of lowerεr, suggesting that another
[image:5.594.77.247.91.278.2]property of UHMWPE results in long times to breakdown. This behavior has been witnessed previously for impulses of longer duration [13], [14], and it is speculated that the ultrahigh-molecular-weight additive may be the reason for the longer times to breakdown for UHMWPE [15].
Fig. 7. Weibull plots and curve fits of time-to-breakdown (tbr)data for type III (no modifications) samples tested with high-voltage electrode type B (collar).
TABLE IV
AVERAGESTREAMERPROPAGATIONVELOCITIES(d/tbr)
IMPLIED BYTIME-TO-BREAKDOWNDATA
IV. IMPLIEDSTREAMERVELOCITIES
At such short time intervals and high dV /dt, a streamer mechanism of breakdown can be assumed to be integral to the breakdown process. While the actual velocity of the streamer that propagates to the point of breakdown cannot be accu-rately determined without spatial and temporal imaging of the streamer development, an average streamer velocity, estimated by dividing the interelectrode gap length, d, by the time to breakdown, tbr, can provide a minimum implied velocity of
streamer propagation, and a basis for comparison with the results from other studies.
The velocity of sound in mineral oil has previously been measured as 1.5 km/s [16], so streamers generated under the conditions investigated here propagate with supersonic velocity in all cases. The estimated average velocities are in the range of 20–50 km/s in nonuniform fields (geometries AI and BIII). The maximum upper velocity exceeds 100 km/s for PP and Rexolite in geometry BIII. For uniform-field measurements (geometry CIII), the average velocities are lower, generally of the order of 11–13 km/s, with the exception of LDPE. The highest upper velocity is greater than 60 km/s, for UHMWPE.
In nonuniform fields, the upper streamer velocities estimated here are faster than those in the case of open oil gaps without solid spacers [17], where the maximum estimated velocity approached 30 km/s for pin-plane geometry, and 20 km/s for collar-plane geometry. Under uniform-field conditions, the estimated velocities in open oil gaps [17] were very similar to those shown in Table IV. The electrodes, the mineral oil, the interelectrode gap length, the voltage waveform, and the measurement technique utilized in [17] were the same as for the present paper, and [1].
Streamer velocities up to 300 km/s in mineral oil have previously been measured by Lesaint and Massala [18], who found that such fast streamers could be observed through the inclusion of a solid pressboard surface parallel to the electric field, in a similar arrangement to the nonuniform-field geome-tries utilized in the present study. Lesaint and Massala achieved these measurements in a 10-cm point-plane gap, with a steel point of radius 100µm forming the high-voltage electrode.
V. DISCUSSION ANDCONCLUSION
Impulse-voltage-breakdown data have been obtained for five dielectric materials considered for use as oil-immersed insula-tors in high-voltage, pulsed-power machines.
Cumulative failure probability distributions were produced for voltage data obtained in surface-breakdown initiation mea-surements, following a method similar to the new step-up method[6]. Some data were best described by two-parameter Weibull distributions, suggesting that the breakdown strength will steadily decrease with increasing shot number. For those data with a positive-value location parameter,γ, this suggests that there is a minimum voltage/field value below which break-down will not occur, independent of shot number [10]. Analyz-ing peak-applied-voltage(Vpk)data, the minimum field value is
highest for PP for all three tested electrode configurations. The Weibull plots for high-voltage electrode type B (collar) were generally of shallower gradient than for high-voltage electrode type A (pin), suggesting that the probability of breakdown was more sensitive to increases in applied voltage for the pin geometry compared with the collar geometry. Comparing data for the pin-plane and collar-plane geometries in [1], higher applied voltages were required to initiate the first flashover with high-voltage electrode type B (collar), suggesting that the field enhancement provided by the pin was greater than that provided by the collar.
When designing a high-voltage system, the length of the insulator should be chosen using information on the known maximum operating voltage of the system and its temporal
behavior, so that the maximum electric-field stress does not ex-ceed a value significantly lower than the mean average applied field threshold for breakdown. This could lead to a reduction in downtime for multimegavolt systems. The values ofγobtained here using Weibull statistical analysis provide an estimate of the applied voltage below which breakdown will not occur for a given solid dielectric material, and PP shows the highest values ofγfor all tested configurations. Only PP consistently reflected a low value ofβ, a measure of the sensitivity of the insulation system to an increase in applied voltage, across the different sets of test conditions.
Statistical analysis of time-to-breakdown(tbr)data, this time
utilizing a two-parameter Weibull distribution, revealed that solid materials withεrclosely matched to that of the
surround-ing mineral oil generally yielded longer times to breakdown than materials of higher εr. The longer times to breakdown
recorded for UHMWPE are thought to be an effect of the ultrahigh-molecular-weight additive [15], suggesting that this material may be a more effective choice for solid insulation immersed in fluids of higherεrsuch as vegetable or seed oils
(εr∼3.0 [19]) or ester fluids (εr∼3.2 [9]), rather than the
mineral oil(εr∼2.2)used in the present study.
Similar experimental studies and statistical analysis to the present work, only with an applied voltage wave shape of 1/6.5µs, can be found in [13], [14]. The similarity of this wave shape to a short-tail lightning impulse means that these results may also be of interest to designers of power systems.
Average streamer propagation velocities, implied by time-to-breakdown data, have also been calculated. Streamers propagate with supersonic velocity for all conditions inves-tigated here, and the maximum estimated velocity exceeds 100 km/s.
The assumption in calculating streamer velocity using infor-mation only on the time to breakdown and the interelectrode gap length is that the statistical time lag will be short at such high electric field and rate of voltage rise, and therefore the major contributor to the time to breakdown will be the formative time lag associated with streamer development and propagation. As discussed in Section IV, spatial and temporal imaging of streamer development would be required in order to directly investigate streamer velocity.
In future work, Laue plots of breakdown time distributions may help to separate the contributions of statistical time lag and formative time lag to the overall time to breakdown.
REFERENCES
[1] M. P. Wilson, S. J. MacGregor, M. J. Given, I. V. Timoshkin, M. A. Sinclair, K. J. Thomas, and J. M. Lehr, “Surface flashover of oil-immersed dielectric materials in uniform and non-uniform fields,”IEEE Trans. Dielectr. Electr. Insul., vol. 16, no. 4, pp. 1028–1036, Aug. 2009. [2] High-Voltage Test Techniques—Part 1: General Definitions and Test
Re-quirements, Int. Std. IEC 60060-1, Sep. 2010.
[3] R. J. Taylor, “Effect of permittivity matching on the flashover of solid/ liquid interfaces,”Proc. IEE, vol. 124, no. 10, pp. 899–904, Oct. 1977. [4] M. Krins, H. Borsi, and E. Gockenbach, “Impact of carbon particles on
[6] H. Hirose, “More accurate breakdown voltage estimation for the new step-up test method in the Weibull model,”IEEE Trans. Dielectr. Electr. Insul., vol. 11, no. 3, pp. 418–423, Jun. 2004.
[7] W. Weibull, “Statistical distribution function of wide applicability,”Trans. ASME J. Appl. Mech., vol. 18, no. 3, pp. 293–297, 1951.
[8] M. M. Morcos and S. E. Cherukupalli, “Review of statistical testing of solid insulating materials,” inProc. 3rd Int. Conf. Conduct. Breakdown Solid Dielectr., 1989, pp. 574–581.
[9] R. Liu, C. Törnkvist, V. Chandramouli, O. Girlanda, and L. A. A. Pettersson, “Ester fluids as alternative for mineral oil: The difference in streamer velocity and LI breakdown voltage,” inProc. Annu. Rep. CEIDP, 2009, pp. 543–548.
[10] Guide for the Statistical Analysis of Electrical Insulation Breakdown Data, Int. Std. IEC 62539(E): 2007 (IEEE Std. 930-2004), Jul. 2007. [11] W. W. Dorner (1999). Using Microsoft excel for Weibull analysis.
Qual. Dig.[Online]. accessed 14th October 2011. Available: http://www. qualitydigest.com/jan99/html/body_weibull.html
[12] R. Coelho and J. Debeau, “Properties of the tip-plane configuration,”
J. Phys. D, Appl. Phys., vol. 4, no. 9, pp. 1266–1280, Sep. 1971. [13] M. P. Wilson, I. V. Timoshkin, M. J. Given, S. J. MacGregor, M. A.
Sinclair, K. J. Thomas, and J. M. Lehr, “Effect of applied field and rate of voltage rise on surface breakdown of oil-immersed polymers,”IEEE Trans. Dielectr. Electr. Insul., vol. 18, no. 4, pp. 1003–1010, Aug. 2011. [14] M. P. Wilson, M. J. Given, I. V. Timoshkin, S. J. MacGregor, M. A.
Sinclair, K. J. Thomas, and J. M. Lehr, “Impulse-breakdown character-istics of polymers immersed in insulating oil,”IEEE Trans. Plasma Sci., vol. 38, no. 10, pp. 2611–2619, Oct. 2010.
[15] M. Kawahigashi, Y. Miyashita, and H. Kato, “Influence of morphology on electrical breakdown strength for polypropylene,” inProc. 3rd Int. Conf. Prop. Appl. Dielectr. Mater., 1991, pp. 1156–1160.
[16] R. Ohyama, A. Watson, and J. S. Chang, “Electrical current conduction and electrohydrodynamically induced fluid flow in an AW type EHD pump,”J. Electrost., vol. 53, no. 2, pp. 147–158, Aug. 2001.
[17] M. P. Wilson, I. V. Timoshkin, M. J. Given, S. J. MacGregor, M. A. Sinclair, K. J. Thomas, and J. M. Lehr, “Effect of electrode geometry and rate of voltage rise on streamer propagation in mineral oil,” inProc. IEEE ICDL, 2011, pp. 1–4.
[18] O. Lesaint and G. Massala, “Transition to fast streamers in mineral oil in the presence of insulating solids,” inConf. Rec. IEEE Int. Symp. Elect. Insul., 1996, vol. 2, pp. 737–740.
[19] E. A. Al-Ammar, “Evaluation of seed oils based on statistical breakdown data for their application as insulating fluids in distribution transformers,”
Eur. J. Sci. Res., vol. 40, no. 1, pp. 15–26, Feb. 2010.
Mark P. Wilson (M’10) was born in Stranraer, Scotland, in 1982. He received the B.Eng. (with honours), M.Phil., and Ph.D. degrees in electronic and electrical engineering from the University of Strathclyde, Glasgow, U.K., in 2004, 2007, and 2011, respectively.
He is presently working as a Teaching Associate at the University of Strathclyde, where he continues to investigate surface flashover of solids immersed in insulating oil.
Dr. Wilson is a member of the IEEE Nuclear and Plasma Sciences Society, from whom he received a Graduate Scholar-ship Award in 2011, the IEEE Dielectrics and Electrical Insulation Society, and the IET.
Martin J. Given(M’99–SM’11) received the degree in physics from the University of Sussex, Brighton, U.K., in 1981 and a Ph.D. degree in electronic and electrical engineering from the University of Strath-clyde, Glasgow, U.K., in 1996.
He is currently a Senior Lecturer in the Depart-ment of Electronic and Electrical Engineering at the University of Strathclyde. His research interests include ageing processes and condition monitoring in solid and liquid insulation systems, high-speed switching, and pulse power applications.
Igor V. Timoshkin(M’07) received the degree in physics from the Moscow State University, Moscow, Russia, in 1992, and the Diploma and the Ph.D. degree from the Imperial College of Science, Tech-nology, and Medicine, London, U.K., in 2001. After graduation from Moscow State University (MSU), he worked as a Researcher at Moscow State Agro-Engineering University, and then at the Institute for High Temperatures of Russian Academy of Sci-ences before moving to Imperial College of Science, Technology, and Medicine (ICSTM) in 1997. He joined the Department of Electronic and Electrical Engineering of the University of Strathclyde, Glasgow, U.K., in 2001 as an Academic Visitor, where he became a Research Fellow in 2002, a Lecturer in 2006, and a Senior Lecturer in 2011. His research interests include properties of solid and liquid dielectric materials, electronics of plasma discharges in condensed media, practical applications of electrohydraulic and high-power ultrasound pulses, biodielectrics, and effects of electromagnetic fields on biological objects.
Scott J. MacGregor(M’95) received the B.Sc. and Ph.D. degrees from the University of Strathclyde, Glasgow, U.K., in 1982 and 1986, respectively.
He is currently with the University of Strathclyde, where he became a Pulsed-Power Research Fellow in 1986, a Lecturer in pulsed-power technology in 1989, a Senior Lecturer in 1994, and a Reader and a Professor of high-voltage engineering in 1999 and 2001, respectively. He has been Dean of Engineering at the University of Strathclyde since January 2010. His research interests include high-voltage pulse generation, frequency diagnostics, power repetitive switching, high-speed switching, electronic methods for food pasteurization and sterilization, generation of high-power ultrasound (HPU), plasma channel drilling, pulsed-plasma cleaning of pipes, and stimulation of oil wells with HPU.
Tao Wangreceived the B.Eng. and M.Sc. degrees from Northeast China Dianli University (China), in 1993 and 1996, respectively, and the Ph.D. degree from the University of Strathclyde, Glasgow, U.K., in 2005.
He then joined the Newland Entech as a research fellow developing high efficiency industrial ozone generator. He joined the department of Electronic and Electrical Engineering of University of Strath-clyde as a lecturer in 2010. His research interests include non-thermal gas discharges and their appli-cations in gas synthesis, water disinfection and advanced oxidation process in water.
Mark A. Sinclair(M’03) received the B.Sc. degree from the Victoria University of Manchester, U.K., in 1990 and then went to St. Andrews and Strathclyde Universities in Scotland to receive an M.Sc. degree in laser engineering and pulsed-power technology.
Kenneth J. Thomas (M’05–SM’10) was born in Carmarthen, South Wales, in 1958. He received the B.Sc degree in physics from Imperial College, London, U.K., in 1979. He completed the Ph.D. degree in laser physics, also at Imperial College, in 1983, and joined the pulsed-power group at AWE.
Since then, he has been involved in the design and construction of multimegavolt pulsed-power ma-chines for flash radiography and supporting research, particularly the application of induction voltage adder technology to the next generation of acceler-ators. He is a C. Phys. and a member of the IET and IoP.
Jane M. Lehr(S’91–M’96–SM’02–F’08) received the B.Eng. degree from the Stevens Institute of Technology, Hoboken, NJ, and the Ph.D. de-gree in electrophysics from Polytechnic University, New York, NY.
Since 2002, she has been a Member of the Technical Staff with the Exploratory Pulsed-Power Technologies Branch, Sandia National Laboratories, Albuquerque, NM. Prior to joining Sandia National Laboratories, she was with the Directed Energy Di-rectorate, Air Force Research Laboratory.