Numerical study of anomalous absorption of O mode
waves on magnetic
fi
eld-aligned striations
B. Eliasson1,2and K. Papadopoulos2
1
SUPA Physics Department, University of Strathclyde, Glasgow, UK,2Departments of Physics and Astronomy, University of Maryland, College Park, Maryland, USA
Abstract
Simple expressions that describe mode conversion and anomalous absorption of ordinary (O) mode waves injected at angles between the vertical and magnetic zenith to upper hybrid (UH) oscillations in the presence offield-aligned density striations are presented. The absorption takes place in a region above the UH resonance layer where the striations allow trapped eigenmodes, leading to excitation of large-amplitude UH waves. The derivation of the expressions is guided by dimensional analysis and numerical simulations. The results are relevant in interpreting high-latitude heating experiments where anomalous absorption due to striations plays a crucial role.1. Introduction
The interaction of HF radio waves with the ionospheric plasma in the vicinity of the upper hybrid (UH) resonance layer plays a critical role in the physics of ionospheric modifications and artificial ionospheric turbulence. It is believed that the UH interaction region gives rise to features such as the downshifted maximum and continuum in the stimulated electromagnetic emissions [Mjølhus, 1998;Leyser, 2001]. Early experiments at Platteville [Cohen and Whitehead, 1970], Tromsø [Stubbe et al., 1982; Jones et al., 1984; Stocker et al., 1993], and in Russia [Getmantsev et al., 1973] showed a drastic increase of absorption of the ordinary (O) mode pump and test waves after a few seconds if the wave frequencies were below the maximum UH frequency of the ionosphere. It has been observed that when the electromagnetic beam is directed along the magnetic zenith (MZ), parallel to the magnetic field lines [Gurevich et al., 2002], or between the MZ and the Spitze angle [Rietveld et al., 2003;Honary et al., 2011], there is an increase of the electron temperature in the heated region. The observations are consistent with the formation of small-scale magneticfield-aligned striations, followed by mode conversion of the O mode pump and test waves to UH waves trapped in the striations [Graham and Fejer, 1976;Vas’kov and Gurevich, 1976;Dysthe et al., 1982;Jones et al., 1984;Mjølhus, 1985;Gurevich et al., 1995, 1996]. The UH oscillations are then responsible for heating the electrons and increasing further the amplitude of the striations [Lee and Fejer, 1978;Dysthe et al., 1982;Inhester, 1982;Gurevich et al., 1995]. Striations measured in situ by a sounding rocket flown through the heater beam at Arecibo [Kelley et al., 1995] had a typical width of 7 m, a mean depletion depth of about 6%, and a separation of about 15 m.
The aim of this paper is to numerically study the efficiency of mode conversion of an O mode to UH waves on
field-aligned striations and its dependence on ionospheric plasma parameters. The study concentrates on cases where the resonant UH interaction and absorption processes take place in a separate region below the turning point of the O mode wave. The results have implications on the electron heating at the UH layer and on the fraction of the electromagnetic wave energy that reaches the critical layer of the O mode where it can excite Langmuir turbulence.
2. Optimal Angle of Incidence
An important parameter is the angle of incidenceχ=χUHto the vertical line in the plane of the magneticfield
(cf. equation (6) below) that results in O mode propagation parallel to the magneticfield lines at the UH layer. In this case the wave electricfield is directed across the striations and the O mode is most efficiently converted to UH waves trapped in the striations [cf. Mjølhus, 1985, Figure 5]. To calculate the optimal angle of incidence χUH, we assume that the ionospheric profile is vertically stratified, and that the
geomagneticfield is directed at an angleθto the vertical line. When the O mode propagates through the
Geophysical Research Letters
RESEARCH LETTER
10.1002/2015GL063751
Key Points:
•The article presents numerical modeling of anomalous absorption
•A scaling law is derived for different plasma parameters
•The numerically obtained scaling law is consistent with experiments
Correspondence to:
B. Eliasson,
Citation:
Eliasson, B., and K. Papadopoulos (2015), Numerical study of anomalous absorption of O mode waves on magneticfi eld-aligned striations,Geophys. Res. Lett.,42, doi:10.1002/2015GL063751.
Received 6 MAR 2015 Accepted 28 MAR 2015
Accepted article online 1 APR 2015
©2015. The Authors.
ionosphere, its frequencyω and horizontal wave vector componentkxare conserved. Since the wave is
injected from a ground-based transmitter in free space, we have
kx¼ωcsinχ: (1)
At the altitude where the wave propagates parallel to the magneticfield, we also have
kx¼ksinθ; (2)
wherek¼
ffiffiffiffiffiffiffiffiffiffiffiffiffiffiffi
k2 xþk2z q
is the local magnitude of the wave vector. At this altitude, the O mode propagates as a left-hand polarized (L) mode wave, obeying the dispersion relation
c2k2
ω2 ¼1
ω2 pe
ω ωð þωceÞ ; (3)
where ωpe¼ ffiffiffiffiffiffiffiffiffiffiffiffiffiffiffiffiffiffiffiffiffiffiffiffiffin0e2=ϵ 0me ð Þ p
is the electron plasma frequency and ωce=eB0/methe electron cyclotron
frequency. Heren0is the local electron number density,eis the magnitude of the electron charge,meis
the electron mass, andϵ0is the electric permittivity in vacuum. Eliminatingkandkxfrom equations (1)–(3) gives
sin2χ sin2θ¼1
ω2 pe
ω ωð þωceÞ: (4)
For example, usingω=ωpeand eliminatingωpein equation (4), wefind the Spitze angle
χ¼χS¼arcsin
ffiffiffiffiffiffiffiffiffiffiffiffi
Y 1þY
r
sinθ
!
; (5)
where the O mode is efficiently converted to a Z mode wave as it reaches the critical layer [e.g.,Mjølhus, 1990]. In equation (5)Y=ωce/ω. Using insteadω¼ωUH¼ ffiffiffiffiffiffiffiffiffiffiffiffiffiffiffiffiffiffiffiffiω2
peþω2ce
q
and eliminatingωpein equation (4) gives the optimal incidence angle
χ¼χUH¼arcsin
ffiffiffi Y p sinθ (6)
that results in O mode propagation parallel to the magneticfield when it reaches the UH layer. For typical parameters at High Frequency Active Auroral Research Program (HAARP),θ= 14.5°,ωce= 9.09 × 10⁶s1,
andω= 20.1 × 10⁶s1wefindχS= 8.0°andχUH= 9.6°. Hence,χUHis between the Spitze and MZ. This is
consistent with the maximum electron heating observed at an incidence angle between the Spitze and MZ [e.g.,Honary et al., 2011].
3. Simulation Setup
We next consider a two-dimensional simulation geometry in thex-zplane with the magneticfield directed along the negativezaxis. For the auroral zone geometry, where the geomagneticfield is directed almost vertically downward, O mode propagation along thezaxis is justified up to a few wavelengths away from the critical layer of the O mode. The ambient ionospheric (ion and electron) number density profile is taken asn0ð Þ ¼z n0;maxexp ðzzmaxÞ2=L2n0
h i
, wheren0,maxis the number density at theF2peak located
at the altitude z=zmax, and Ln0 is the ionospheric length scale. The total plasma density, including a
striation superimposed on the ambient density atx= 0, is taken asn xð ;zÞ ¼n0ð Þz 1δn˜strexp x2=D2 str
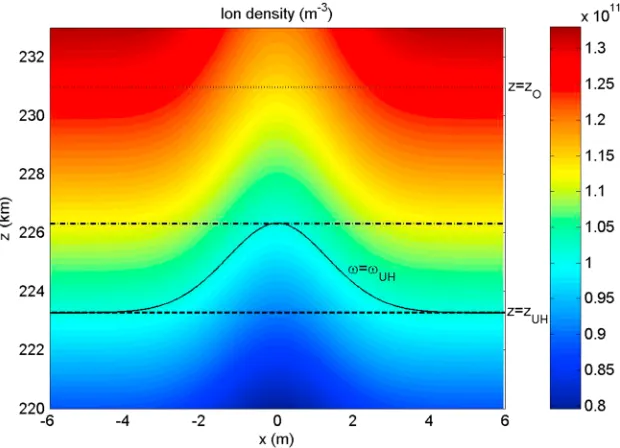
, whereδñstris the relative density depletion andDstris the transverse size of the striation. Figure 1 shows a
density striation withDstr= 2 m,δñstr= 0.1,n0,max= 1.436 × 10¹¹ m3(corresponding to the peak plasma
frequency foF2¼ 3:40 MHz),zmax= 242 km, andLn0= 31.62 km. For periodic boundary conditions along
thexdirection, Figure 1 represents a grid of striations separated by the transverse simulation box size Lx= 12 m. The used pump frequency ω= 20.1 × 10⁶ s1 (f0= 3.20 MHz) corresponds to a vacuum
wavelengthλ0=c/f0= 93.75 m. For the chosen parameters, the critical altitude where the pump frequency
equals the ambient plasma frequency is at zO= 230.96 km (the dotted line in Figure 1). The ambient
magnetic field B0= 5.17 × 10⁵ T corresponds to electron cyclotron frequency ωce= 9.09 × 10⁶ s1
(1.45 MHz). The UH resonance where the pump frequency equals the UH frequency in the unperturbed ionosphere is at zUH= 223.27 km (the dashed line in Figure 1). The critical surface ω=ωUH is
indicated with a solid line in Figure 1, whereωUHðx;zÞ ¼
ffiffiffiffiffiffiffiffiffiffiffiffiffiffiffiffiffiffiffiffiffiffiffiffiffiffiffiffiffiffiffi ω2
peðx;zÞ þω2ce
q
is the UH resonance frequency and
ωpeðx;zÞ ¼
ffiffiffiffiffiffiffiffiffiffiffiffiffiffiffiffiffiffiffiffiffiffiffiffiffiffiffiffiffiffiffiffiffi
n xð ;zÞe2=ϵ 0me
ð Þ
p
is the local electron plasma frequency. In Figure 1 the upper boundary of the UH interaction layer is indicated with a dash-dotted line. Notice that the O mode will propagate up to or near the critical altitude for angles smaller than or close to the Spitze angle.
In order to have well-defined, transmitted, and absorbed waves through the UH region this paper focuses on cases where the UH interaction region is below the critical altitude of the O mode, i.e., the dotted line should be at a higher altitude than the dash-dotted line in Figure 1. The separation between the altitudes of the critical and UH layers is approximately zOzUH≈Y2LUH, where the local length scale isLUH= 1/|d ln
(n0)/dz| at z=zUH, and the separation between the bottom and top of the UH interaction region is
ΔzUH≈δñstrLUH. Hence, the condition for the separation of the UH interaction region from the O mode
critical layer is
Y2>δn˜
str: (7)
For example, for a relative striation density depletion ofδñstr= 0.1, the condition is fulfilled forY>0.32. For
the typical electron cyclotron frequency of 1.45 MHz at HAARP and relative striation depthδñstr= 0.1, the
UH interaction region is separated from the O mode critical layer only for transmission frequencies below 4.5 MHz IfY2<δñstr, the critical altitude of the O mode wave will be located within the UH interaction
region, making the interpretation of the absorption process more complicated.
On the fast UH and O mode timescale, we assume that the ions are immobile and contribute only to a
neutralizing background of the plasma. For the high-frequency electron dynamics and the
[image:3.612.220.530.90.314.2]electromagneticfield, we solve the dynamical equations for the slowly varying complex envelopes, with the substitution∂/∂t→∂/∂tiω. There is a clear separation of length scales in the problem, where the electromagnetic waves have wavelengths of the order 100 m, while the UH waves have typical wavelengths of less than a meter. This poses a computational problem since the numerical scheme must resolve both length scales, while the time step is limited by the Courant condition to the smallest grid size, which in our case is in thexdirection. To resolve this problem, we follow the techniques presented in Figure 1.Spatial profile of the total ion density. A striation of sizeDstr= 2 m and relative density depletionδñstr= 0.1 is
centered atx= 0. The dashed line indicates the altitudez=zUH= 223.27 km of the bottom of the UH layer where
ω=ωUHoutside the striation. The altitude whereω=ωUHis indicated with a solid line, while the dash-dotted line marks the limiting altitudez= 226.29 km of the top of the UH layer, where, locally,ω=ωUHat the center of the striation. The UH
interaction region is constrained between the two altitudes. The critical altitudez=zOof the O mode wave is indicated
Eliasson[2013] and separate the electricfield into an electrostatic, curl-free partEES=∇ϕ, where the scalar
potential is obtained from Poisson’s equation
∇2ϕ¼ e
ϵ0ne (8)
and an electromagnetic, divergence-free partEEMdefined by ∂A
∂t ¼iωAEEM (9)
whereAis the vector potential defined by its relation to the magneticfieldB=∇×Aand the Coulomb gauge ∇A= 0. The electromagnetic electricfield is obtained from
∂EEM
∂t ¼iωEEM e
ϵ0∇
2∇∇ nv e ð Þ
½ : (10)
The overbar denotes spatial averaging in thexdirection, so that the electric current and the electromagnetic
fieldsEEMandAdepend only on the vertical coordinatezand on time, but not on the transverse coordinatex.
This allows us to take about 50–100 times longer time steps, since the Courant condition now limits the time step byΔt≲Δz/cinstead of the much more restrictiveΔt≲Δx/c.
The electron dynamics is governed by the continuity and momentum equations, respectively, ∂ne
∂t ¼iωne∇ðnveÞ (11)
and
∂ve
∂t ¼iωve e
meðEþEextþveB0Þ 3v2
Te
n κ∇ne; (12)
where E=EES+EEM is the total electric field, B0¼B0^z is the downward directed magnetic field,
vTe¼pffiffiffiffiffiffiffiffiffiffiffiffiffiffiffiffiffikBTe=me is the electron thermal speed,Teis the electron temperature,kBis Boltzmann’s constant,
andκ= 1/(14Y2) accounts for a kinetic dispersive effect for UH branch of the electron Bernstein waves that becomes important for low pump frequencies within a few electron cyclotron harmonics [e.g.,Lominadze, 1981]. A pseudo-spectral method is used to calculate the spatial derivatives accurately, with typical grid sizesΔx= 4 cm in the transverse direction andΔz= 17 m in the longitudinal direction, and a standard fourth-order Runge-Kutta scheme is used to advance the solution in time, with a time step of
Δt= 108 s. The size of the simulation box is 13 km in thezdirection, and different widths are used in the x direction to match the widths of the striations. To resonantly drive an upward propagating (opposite to the direction ofB0) L mode wave below the UH interaction region, a right-hand circularly polarized externalfieldEext¼ðx^þi^yÞ expð Þik exp ðzz0Þ2=D2ext
h i
is used, centered atz0near the bottom
of the simulation box and with a vertical widthDext= 250 m. The wave number k, given by equation (3),
matches that of the propagating L mode wave. A damping layer for the electromagnetic wave is introduced
near the top of the simulation box to absorb O mode waves that have propagated through the UH interaction
region. The externalfield is switched on at the start of the simulationt= 0.
4. Numerical Results
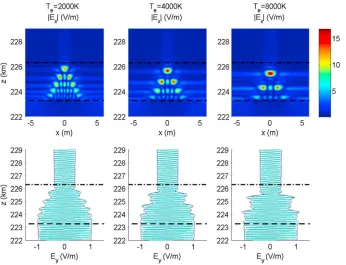
Key physics characteristics of the O to UH mode conversion are illustrated in Figures 2–4 at timet= 0.1 ms into the simulations. The O mode wave injected from the bottom side is continuously converted to UH waves, and the UH wave amplitude gradually increases with time. The fraction of O mode wave energy converted to UH waves quickly reaches a steady state, and for times larger than 0.1 ms, the amplitude profiles of the electromagnetic wave undergo only very slight changes. To study the absorption of the O mode wave, it is therefore sufficient to run the simulations up tot= 0.1 ms and then record the results. Figure 2 shows examples of simulations using the electron temperatureTe= 4000 K and three different
striations with transverse sizesDstr= 1 m,Dstr= 2 m, andDstr= 4 m. In order to keep the packing factor
η= 2Dstr/Lxunchanged, the simulations were performed with a box size in thexdirection of 6 m, 12 m, and
24 m, respectively. Note the following: (i) The wave energy is efficiently mode converted at quantized
heights where the wave frequency is equal to quantized eigenfrequencies of trapped UH waves, as discussed byMjølhus[1998]. (ii) The absorption layerΔzUHstarts at the altitude whereω=ωUHoutside the striation, but
its extent is bracketed by the altitude where locallyω=ωUHat the center of the striation. (iii) As the striation
width increases, the absorption width increases occupying a larger fraction ofΔzUH, the number of layers where
the UH waves are resonantly absorbed increases, and the resonant layers move closer to each other. The total number of UH resonances (both odd and even) in a striation is roughly given by [Mjølhus, 1998]
M¼1π
∫
ffiffiffiffiffi δn n0s
dx
λDepffiffiffiffiffi3κ ; (13)
but due to symmetry, only even (M/2) resonances are excited. HereλDe=vTe/ωpeis the electron Debye length.
In our case we haveδn=n0 ¼δ˜nstrexp x2=D2 str
, and the integral can be evaluated as
M¼ ffiffiffiffiffiffiffiffiffiffiffiffi
2δn˜str 3πκ
r
Dstr
λDe : (14)
For the parameters used in Figure 2, we haveλDe≈0.014 m,δñstr= 0.1, andκ= 5.5. For the casesDstr= 1 m,
2 m, and 4 m, the number of even resonances areM/2≈2.3, 4.5, and 9, respectively, which is consistent with Figure 2, where respectively 2, 4, and 8 resonances are visible. (iv) Most importantly, in all three cases, the relative absorption, as seen by the value ofEyat Figure 2 (bottom) remains the same. Theycomponent of
the electricfield decreases about 50% in amplitude above the UH layer, implying that about 75% of the wave energy is absorbed and converted to UH waves.
When instead changing the electron temperature (cf. Figure 3), the wavelength of the UH wave (Figure 3, top) increases with increasing temperature; for lower temperatures the number of resonant layers increases and the resonant layers move closer to each other. Similar to Figure 2, the absorption layer is constrained toΔzUH
starting whereω=ωUHoutside the striation up to an altitude below where, locally,ω=ωUHat the center of
[image:5.612.204.544.90.351.2]the striation. Most importantly, the relative absorption remains the same for different temperatures, as seen by the value ofEyat Figure 3 (bottom).
Figure 2.(top) Thexcomponent of the electricfield showing trapped UH waves and (bottom) theycomponent of the electric field representing the O mode electromagnetic wave, for density striations with the widthsDstr= 1 m, 2 m, and 3 m, relative
striation depthδñstr= 0.1, and electron temperatureTe= 4000 K. The simulation domain is adjusted to keep the packing
factorη= 2Dstr/Lx= 0.333 the same for the three cases. The dashed line indicates the altitudez= 223.27 km of the UH layer
In contrast, we see in Figure 4 that an increase ofδñstrfrom 0.05 to 0.15 leads to a reduction of the O mode
amplitude above the UH interaction region by almost an order of magnitude. Hence, the striation depth is a crucial parameter for the anomalous absorption of the O mode wave. For deeper striations, the interaction region ΔzUH increases, leading to a larger number of resonant layers, while the distance between the
layers depend only weakly onδñstr.
5. Scaling Analysis
From Figures 2 and 3, we conclude that the absorption of O mode waves to UH waves on striations does not significantly depend onDstrandTewhile keeping other parameters constant. By dimensional analysis of the
governing equations, onefinds that the physics of the system depends only on four local dimensionless parameters:η,δñstr,ΔzUH/λ0. (ΔzUHis the vertical width of the UH interaction region, between the
dash-dotted and dashed lines in Figure 1), and Y=ωce/ω0. Note that ΔzUH also depends on Dstr, Y, and
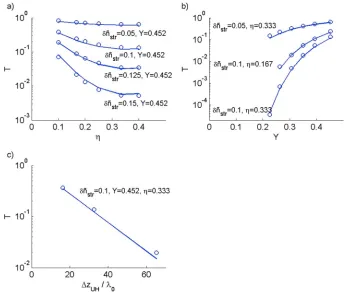
parameters defining the ionospheric profile. By performing a set of simulations similar to the ones in Figures 2–4 for different combinations of the parameters, we have found a simple expression for the transmission coefficient (transmitted intensity above the striation divided by incident intensity below the striation)
T≈ EyT 2
EyT0
2¼exp 3:24δn˜str
ΔzUH
λ0 η1:4η 2
1
Y1:09
; (15)
estimated as the squared amplitude ratio of the transmitted electricfield above the UH interaction regionEyT
andEyT0 with and without striation, respectively. The formula is valid for typical ionospheric parameters
0.2<Y<0.46,η<0.5, andδñstr≲Y2(cf. equation (7)).
[image:6.612.204.550.88.353.2]A comparison between numerically obtained values of the transmission coefficient and the expression (15) is shown in Figure 5, with good agreement. As seen in Figure 5a, the transmission coefficient in general decreases with increasing packing factorη, since there are more striations per given area to absorb wave energy. However, for large values η>0.25, the absorption becomes less efficient and the curves in Figure 5a have a minimum atη≈0.35. This is reflected in the term proportional toη2in the exponential in Figure 3.The same as in Figure 2 for electron temperaturesTe= 2000 K, 4000 K, and 8000 K, using density striation with
the widthDstr= 2 m and relative striation density depletionδñstr= 0.1.
Figure 4.The same as Figure 2 for relative striation depthsδñstr= 0.05, 0.1, and 0.15, widthDstr= 2 m, and electron
temperatureTe= 4000 K.
[image:7.612.200.544.419.712.2]equation (15) and is due to close-packing effects which changes the average dielectric properties of the plasma and reduces the effectiveness of absorption for densely packed striations. On the other hand, we see in Figures 4, 5a, and 5b that an increase ofδñstrfrom 0.05 to 0.1–0.15 can decrease the transmitted
electricfield by more than a factor 10 and the corresponding transmission coefficient by a few orders of magnitude. An increase ofδñstrincreases both the depth of the striation locally and the vertical width of
the UH interaction region (cf. Figure 4). Tofirst order,ΔzUH≈δñstrLUH, and hence, the expression in the
exponential of (15) is approximately proportional toδn˜2str. Therefore, most of the injected wave energy will be absorbed when the striations have grown to a significant amplitude. Finally, the results in Figure 5c, indicating a decrease ofTwithΔzUH, were obtained by keepingδñstr,Y, andηconstant, while halving and
doubling the ionospheric vertical length scaleLn0, so as to decrease and increaseΔzUHproportionally.
The numerical results are in qualitative agreement with the theoretical expression for the transmission coefficient for small amplitude striations, corresponding to δñstrLUH/Dstr≪1, given in equation (2a) of
Mjølhus[1985], which for parallel propagation of the O mode along the striations can be written as
T¼exp π2LUH
λ0 1Y
ð Þ2
ffiffiffi
Y
p δn
n0 2
* +
" #
; (16)
where the angle brackets denote spatial averaging andδnis the density perturbation due to the striations. In our case,δn=n0¼ δn˜strexpx2=D2
str
þδn˜strðη=2Þpffiffiffiπ, where we have subtracted the mean density and a
spatial average over the simulation box gives ðδn=n0Þ2
D E
≈pffiffiffiffiffiffiffiffiπ=2 δn˜2str=2
ηpffiffiffiffiffiffiffiffiπ=2η2
, which also recovers the close-packing effect governed by theη2term in equation (15); the coefficientpffiffiffiffiffiffiffiffiπ=2≈1:25in front ofη2is comparable to the coefficient 1.4 obtained numerically in equation (15). The decrease of the transmission coefficient for the relative decrease of the magnetic field Y seen in Figure 5b is also consistent with equation (16). In general,T+A+R= 1, where AandR are the absorption and reflection coefficients, respectively [e.g.,Mjølhus, 1985]. Mjølhus[1985] also predicted a significant reflection of O mode waves by the UH layer for wave propagating into denser plasma, which would limit the absorption coefficient to A < 0.5. A reflection by the UH interaction region would give rise to a standing wave pattern below the UH layer, which, however, is not seen in Figures 2–4. Hence, the numerical results indicate thatR≈0 and A= 1T. The numerical results are consistent with experiment [e.g.,Cohen and Whitehead, 1970;Stubbe et al., 1982], where the amplitude of reflected O mode waves on the ground drops about 10–15 dB after the striations have had time to develop. If there is no direct reflection by the UH layer, the O mode must travel through the UH layer twice:first, as an upgoing wave into denser plasma to the turning point of the O mode, and then as a downgoing wave propagating out from the plasma. If the transmission coefficient is the same for upgoing and downgoing waves, the total transmission coefficient is Ttot≈T2 whereTis given by equation (15). As is evident from Figure 5, an injected wave could then be
absorbed and decreased in power several tens of decibels before returning back to ground.
References
Cohen, R., and J. D. Whitehead (1970), Radio-reflectivity detection of artificial modification of the ionosphericFlayer,J. Geophys. Res.,75(31), 6439–6445, doi:10.1029/JA075i031p06439.
Dysthe, K. B., E. Mjølhus, H. L. Pécseli, and K. Rypdal (1982), Thermal cavitons,Phys. Scr.,T2/2, 548–559. Eliasson, B. (2013), Full-scale simulations of ionospheric Langmuir turbulence,Mod. Phys. Lett. B,27(8), 1330005.
Getmantsev, G. G., G. P. Komrakov, Y. S. Korobkov, L. F. Mironenko, N. A. Mityakov, V. O. Rapoport, V. Y. Trakhtengerts, V. L. Frolov, and V. A. Cherepovitskii (1973), Some results of investigations of nonlinear phenomena in the F-layer of the ionosphere,JETP Lett.,18, 364. Graham, K. N., and J. A. Fejer (1976), Anomalous radio wave absorption due to ionospheric heating effects,Radio Sci.,11(12), 1057–1063,
doi:10.1029/RS011i012p01057.
Gurevich, A. V., A. V. Lukyanov, and K. P. Zybin (1995), Stationary striations developed in the ionospheric modification,Phys. Rev. Lett.,75, 2622–2625.
Gurevich, A. V., A. V. Lukyanov, and K. P. Zybin (1996), Anomalous absorption of powerful radio waves on the striations developed during ionospheric modification,Phys. Lett. A,211, 363–372, doi:10.1016/0375-9601(95)00970-1.
Gurevich, A. V., K. P. Zybin, H. C. Carlson, and T. Pedersen (2002), Magnetic zenith effect in ionospheric modifications,Phys. Lett. A,305, 264–274. Honary, F., N. Borisov, M. Beharrell, and A. Senior (2011), Temporal development of the magnetic zenith effect,J. Geophys. Res.,116, A06309,
doi:10.1029/2010JA016029.
Inhester, B. (1982), Thermal modulation of the plasma density in ionospheric heating experiments,J. Atmos. Terr. Phys.,44(12), 1049–1059. Jones, T. B., T. Robinson, P. Stubbe, and H. Kopka (1984), Frequency dependence of anomalous absorption caused by high power radio
waves,J. Atmos. Terr. Phys.,46(2), 147–153, doi:10.1016/0021-9169(84)90140-5.
Geophysical Research Letters
10.1002/2015GL063751
Acknowledgments
This work was supported by the MURI grant FA95501410019. B.E. acknowl-edges support from the EPSRC (UK), grant EP/M009386/1. Simulation data supporting thefigures can be requested from Bengt Eliasson, e-mail: [email protected].
Kelley, M. C., T. L. Arce, J. Salowey, M. Sulzer, W. T. Armstrong, M. Carter, and L. Duncan (1995), Density depletions at the 10-m scale induced by the Arecibo heater,J. Geophys. Res.,100(A9), 17,367–17,376, doi:10.1029/95JA00063.
Lee, M.-C., and J. A. Fejer (1978), Theory of short-scalefield-aligned density striations due to ionospheric heating,Radio Sci.,13(5), 893–899, doi:10.1029/RS013i005p00893.
Leyser, T. B. (2001), Stimulated electromagnetic emissions by high-frequency electromagnetic pumping of the ionospheric plasma,Space Sci. Rev.,98, 223–328.
Lominadze, D. G. (1981),Cyclotron Waves in Plasmas, Pergamon Press, New York.
Mjølhus, E. (1985), Anomalous absorption and reflection in ionospheric radio modification experiments,J. Geophys. Res.,90(A5), 4269–4279, doi:10.1029/JA090iA05p04269.
Mjølhus, E. (1990), On linear mode conversion in a magnetized plasma,Radio Sci.,25(6), 1321–1339, doi:10.1029/RS025i006p01321. Mjølhus, E. (1998), Theoretical model for long time stimulated electromagnetic emission generation in ionospheric radio modification
experiments,J. Geophys. Res.,103(A7), 14,711–14,729, doi:10.1029/98JA00927.
Rietveld, M. T., M. J. Kosch, N. F. Blagoveshchenskaya, V. A. Kornienko, T. B. Leyser, and T. K. Yeoman (2003), Ionospheric electron heating, optical emissions, and striations induced by powerful HF radio waves at high latitudes: Aspect angle dependence,J. Geophys. Res.,
108(A4), 1141, doi:10.1029/2002JA009543.
Stocker, A. J., F. Honary, T. R. Robinson, T. B. Jones, and P. Stubbe (1993), Anomalous absorption during artificial modification at harmonics of the electron gyrofrequency,J. Geophys. Res.,98(A8), 13,627–13,634, doi:10.1029/93JA00878.
Stubbe, P., H. Kopka, T. B. Jones, and T. Robinson (1982), Wide band attenuation of radio waves caused by powerful HF waves: Saturation and dependence on ionospheric variability,J. Geophys. Res.,87(A3), 1551–1555, doi:10.1029/JA087iA03p01551.