City, University of London Institutional Repository
Citation
:
Lloyd, D. and Dykes, J. (2011). Human-Centered Approaches in
Geovisualization Design: Investigating Multiple Methods Through a Long-Term Case Study.
Transactions in Visualization and Computer Graphics, 17(12), pp. 2498-2507. doi:
10.1109/TVCG.2011.209
This is the unspecified version of the paper.
This version of the publication may differ from the final published
version.
Permanent repository link:
http://openaccess.city.ac.uk/438/
Link to published version
:
http://dx.doi.org/10.1109/TVCG.2011.209
Copyright and reuse:
City Research Online aims to make research
outputs of City, University of London available to a wider audience.
Copyright and Moral Rights remain with the author(s) and/or copyright
holders. URLs from City Research Online may be freely distributed and
linked to.
City Research Online:
http://openaccess.city.ac.uk/
[email protected]
Human-Centered Approaches in Geovisualization Design:
Investigating Multiple Methods Through a Long-Term Case Study
David Lloyd and Jason Dykes
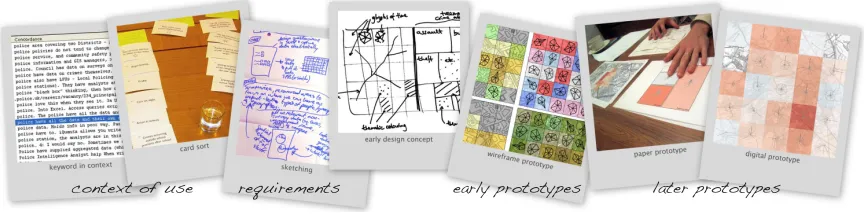
[image:2.612.95.528.143.252.2]context of use requirements early prototypes later prototypes
Fig. 1. Graphical approaches used in a long-term investigation into using human-centred methods in geovisualization design include, from left: keyword in context; card sorting; requirements and design concept sketching; and wireframe, paper and digital prototypes.
Abstract—Working with three domain specialists we investigate human-centered approaches to geovisualization following an
ISO13407 taxonomy covering context of use, requirements and early stages of design. Our case study, undertaken over three years, draws attention to repeating trends: that generic approaches fail to elicit adequate requirements for geovis application design; that the use of real data is key to understanding needs and possibilities; that trust and knowledge must be built and developed with collaborators. These processes take time but modified human-centred approaches can be effective. A scenario developed through contextual inquiry but supplemented with domain data and graphics is useful to geovis designers. Wireframe, paper and digital prototypes enable successful communication between specialist and geovis domains when incorporating real and interesting data, prompting exploratory behaviour and eliciting previously unconsidered requirements. Paper prototypes are particularly successful at eliciting suggestions, especially for novel visualization. Enabling specialists to explore their data freely with a digital prototype is as effective as using a structured task protocol and is easier to administer. Autoethnography has potential for framing the design process. We conclude that a common understanding of context of use, domain data and visualization possibilities are essential to successful geovis design and develop as this progresses. HC approaches can make a significant contribution here. However, modi-fied approaches, applied with flexibility, are most promising. We advise early, collaborative engagement with data – through simple, transient visual artefacts supported bydata sketchesand existing designs – before moving to successively more sophisticateddata wireframesanddata prototypes.
Index Terms—Evaluation, geovisualization, context of use, requirements, field study, prototypes, sketching, design.
1 INTRODUCTION
Visualization applications can present users with novel challenges: they aim at insight through exploration, have high complexity, mul-tiple (usually interlinked) components and, in the case of geovisual-ization –geovis[17], a focus on spatial data with attendant issues of scale, spatial dependence and heterogeneity [2]. Exploration can in-volve tasks that are hard to define, broad in nature, time consuming and difficult to master – often with uncertain outcomes [45]. Visualization tools are various, complex and unfamiliar to most potential users, they present data in (often novel) ways designed to amplify cognition that can make significant cognitive demands on users. The diversity and complexity of different domains, of specialists’ tasks and data, means no single solution fits all and compromise or customization are in-evitable [16]. Generic visualization applications have their place and
• David Lloyd is with the giCentre, City University London, E-mail: [email protected].
• Jason Dykes is with the giCentre, City University London, E-mail: [email protected].
Manuscript received 31 March 2011; accepted 1 August 2011; posted online 23 October 2011; mailed on 14 October 2011.
For information on obtaining reprints of this article, please send email to: [email protected].
are increasingly being formally evaluated, although such tests can be challenging or problematic [8, 20, 47]. But when customization or specific solutions are necessary, then the inevitable knowledge gap be-tween designers and prospective users with domain expertise must be bridged [67]. A range of human-centered (HC) approaches can facili-tate this process and provide ‘grounding’ [26], but despite a convinc-ing call to arms [62], limited progress has been made in determinconvinc-ing those appropriate in a geovis context.
in-design
later prototypes
early prototypes
context
of use
requirements
fullevaluation
[image:3.612.77.532.52.124.2]application
Fig. 2. Stages of the Human-Centered Design process described in ISO13407 [27]. Those addressed in our study are highlighted in white, with ‘snapshots’ of some of the graphical approaches investigated throughout the process shown by way of example in Fig. 1.
adequate for exploratory analytical activity. The domain and organi-zational contexts are likely to reflect the situation of a large number of similar cases. We interacted with these three specialists for several weeks during each stage of our research over the three year period. Mutual understanding was developed through this process as a long-term relationship developed. We used a number of methods structured as related case studies that linked together in a cohesive way by em-ploying Gerring’s design typology [22]. This methodological design [36] enabled comparisons to be made between HC approaches. Qual-itative and quantQual-itative analytical techniques were used to evaluate the effects of the methods, with findings triangulated where possible with evidence from multiple strands of inquiry to give us confidence in our results. This corresponds closely to the mixed-methods [24] approach. ISO standard 13407 on human-centered design processes for inter-active systems [27] identifies key activities as:understanding context
of use;determining requirements;producing designs; and their
evalua-tion(Fig. 2). The HC literature reveals an evolving repertoire of tools, approaches and nomenclature in support of ISO 13407 [41]. His-torically, visualization practitioners have not adhered to any one HC school of thought and we too adopted a pragmatic approach, drawing upon common techniques that seemed plausible in the contexts of our cases. The majority of data we collected were qualitative in nature and analysis was carried out using audio transcription [6, 33], coding [34] and qualitative data analysis techniques [43]. These were underpinned by approaches for generating meaning and for testing and confirming findings [43]. The outputs from each stage of the ISO13407 process investigated provided input to later stages, in terms of the evolving development of a design, as our knowledge of the specialists’ context and data grew and as we experienced and reflected upon how well suc-cessive HC approaches worked in a geovis situation. It is important to emphasise that the focus of our research is how HC approaches work in a geovis context, although inevitably we have gained insights into the processes of constructing a geovis application along the way that will prove to be of benefit to visualization researchers. We have reported aspects of our research in detail as it has progressed [37, 38, 39, 36]: this paper lacks some of that detail but represents a reflection upon the wider body of work in which we are able to draw higher-level con-clusions by triangulating between experiences and the multiple cases involved in the long-term study and thus make broad recommendations that may be of use to others in geovis design and beyond.
2 UNDERSTANDING CONTEXT OF USE
We considered ethnographic field research methods and used Contex-tual Inquiry (CI) [5], with a range of data collection methods [48] such as interviews, observation, questionnaires and examining documents to understand specialists’ context of use. We employed content anal-ysis [31] techniques including calculating word frequencies, examin-ing keywords-in-context [40], constructexamin-ing networks of relationships between concepts and using card sorting [25, 44, 57] to study spe-cialists’ task categories identified through these approaches. CI is a pragmatic approach for researchers: Beyer and Holtzblatt describe the core premise as “go where the customer works, observe the customer
as he or she works, and talk to the customer about the work” [5] and
advocate a ‘master-apprentice’ model when working in the field. We found that this worked well in practice. The roles are assumed easily and useful information is gleaned on both sides. Enabling the domain specialist to assume a dominant role in a familiar context at the
out-set of a collaborative project can also be a useful device in terms of developing trust and confidence and team-building.
Interviews provided insights on specialists’ skills, experience, tools, aims, inputs and outputs that would be of use to a visualization de-signer. Observation provides a less systematic approach to gathering contextual information, with a smaller coverage than interviews. It did however lead to avenues of inquiry and to insights that it is hard to imagine surfacing in an interview and it can lend additional weight to interview evidence. Studying internal documents was an effective way of learning about specialists’ context without taking up their time. Studying external documentation, such as academic literature on the domain, provided corroboration of insights obtained from specialists and grounded their context to the domain generality.
One HC approach where the nature of geovis made a difference was card sorting. Using it to understand how specialists grouped plausible domain tasks enabled us to include spatial tasks next to others and see how they were categorised – to get a sense of the importance of the spatial components of information in the context of task. Cluster anal-ysis made comparing different tasks possible, and including a geovis designer in a card sort yielded a quantitative benchmark against which to compare the specialists’ categorisations. This provided a check on the designer’s concept of the specialists’ domain early on in the pro-cess, before specialists’ requirements were explored, designs produced or code was cut and was useful in identifying disconnections between the specialists’ and designer’s views of the domain. Card sorting also identified clusters of tasks in the crime domain that we were able to use subsequently as focii for prototyping.
Word frequency counts from interview transcriptions yielded useful quantitative information, identifying dominant concepts. Keyword-in-context analysis is particularly valuable as it provides insight into spe-cialists’ motivations. Both techniques offer the potential for insight into subject context for visualization designers. In one example, a frequently occurring word – “police”, led us to discover its use in a context that gave insight into the balance of power between the spe-cialists and their major data provider (the local police force) and from there to the kinds of value-added analyses required to differentiate our specialists from those of the police force.
ISO13407 refers only to “users, tasks and the organizational and
physical environment” in understanding context of use. But an
impor-tant aspect of designs for data analysis is to acquire specialists’ data. The heterogeneity of geographic data and its dependencies on scale and space make this particularly important. This has significant im-plications for the relationship with specialists and requires a focus on ‘data in context’, of which geographic context may play a key compo-nent, alongside those of specialist and organization. However data in context is not a substitute for context of use. Specialists’ data needs to be studied explicitly in a process akin to ‘studying documentation’ – an off-line activity disconnected from the data owners. In working with domain specialists we found the need to be explicit about un-derstanding both their context of useandtheir data in context, which entailed collecting metadata relating to lineage, confidentiality, for-mat, volume, etc. Geovis designers need early access to domain data so that it may be studied in detail. This requires domain specialists’ trust. Engaging them as ‘masters’ in a CI master-apprentice manner is therefore appropriate: a ‘(geovis) researcher – (application domain)
subject’ or consultant/client style approach may be an unhelpful way
3 ESTABLISHING REQUIREMENTS
We anticipated that the novelty, complexity and characteristics of geo-vis would make establishing requirements a challenge. We therefore employed alternative approaches as well as a widely used standard, the Volere method [54], in which a structured template of generic questions is used to elicit requirements. In the first of two alterna-tive approaches, we attempted to provide the specialists with an un-derstanding of the possibilities of geovis in order to elicit methods that might engage with their context of use. This builds on a HC tradition of involvement through participatory, collaborative engagement with users. Van Wijk suggests that “domain experts could make steps to
cross the bridge” by using visualization experts to “educate domain
experts to define visualizations themselves” [67]. While pedagogic
lit-erature recommends active approaches to learning, in line with the HC tradition, we prepared a lecture for the specialists with the aim of de-scribing a comprehensive set of geovis tools and interactions, in the expectation that domain specialists might ‘cross the bridge’ by decid-ing which had promise in their context of use. This didactic means of education contradicts our usual pedagogic practice, which tends to be much more ‘hands on’ in the tradition of active learning. There was some scepticism regarding the suitability of this more objective method, however, lecturing is time-efficient and a de-facto standard in education. Card sort [44], sketching [65] and a recall [1] interview after two weeks were used to elicit information from the specialists re-garding candidate methods and designs. Sketches allow for “a dialog between the sketch and the viewer. . . that facilitates better
understand-ing of the problem and in turn generation of new ideas” [65] and have
been used in an information visualization context [12]. We asked the specialists to “define visualizations themselves” by sketching a data exploration application using techniques described in the lecture for three major crime domain themes established during the context of use phase –fear of crime,racial crimeandthe ‘night-time’ economy.
The second alternative approach was a response to our developing understanding of the difficulty of eliciting requirements as we tried first Volere and then the didactic approach to bridge building. Instead of attempting to bridge the gap [67] by taking geovis to the specialists, we reversed the direction and took a representation of the specialists’ context to geovis designers. Whilst not a scalable method, this gave us a series of suggestions, ‘grounding’ in geovis methods with which to compare the specialists’ solutions and an indication as to whether an objective geovis solution to a stated visualization need may exist [36]. It also provided multiple opportunities to evaluate our represen-tation of geovis context of use – ascenario[9, 53] developed from the information gathered in the earlier context of use stage.
Analysis of these three HC approaches (Volere, lecture and sce-nario) developed a body of evidence from which to triangulate. Quan-titative methods included counts of methods used in designs both by geovis experts and the specialists and the tabulation of the results of a summative questionnaire from the geovis experts [36]. Qualitative information came from the coding and analysis of audio recordings made of the Volere sessions, the scenario interviews with the geovis experts, the post-lecture sessions in which card sorting and sketching were used and the recall interviews [36].
The requirements template elicited only the most peripheral infor-mation from the specialists. The possibilities of visualization were not captured – the potential of geovis and the effective use of geography to structure and interact with information represent ‘undreamed of’ re-quirements [52] that slipped through the net during our ‘trawl’. This was despite our specialists being involved in spatial analysis, using geographic information systems, and having knowledge of analytical graphics. The Volere template also fails to give weight to the collection of domain data and metadata – an important need already established. The results of the lecture were mixed. During the card sort held immediately afterwards the specialists appeared overwhelmed by the possibilities. They identified virtually all the tools and interactions as being useful in their domain but were unable to differentiate in terms of suitability or priority. In the recall interview a fortnight later, just a few tools were remembered, but the recall prompted useful commen-tary on some of these: “the glyphs I liked. I think I could see a use
for them straight away. . . you could, use them in quite a simple way to look at those areas. . . that have quite a similar characteristics and quite similar problems. I thought that would be quite an interesting
way to do it.”; “I thought [the tree maps] would be particularly useful
. . . [to have as] quite a simple, straightforward way of demonstrating
[our problems are] . . . mostly criminal damage and violent crime. . .”.
Specialists were observed during their sketching and they described the difficulty of representation, of the task and general (post-lecture) fatigue: “. . . difficult to draw/visualise things like zooming. . . how to
describe what you want to do on paper”; “I can’t think in this way,
[I’ve] got too many things in my head.” While these sketches could
not be considering as requirements, it was possible to study the tool and interaction components in order to gain an insight into what spe-cialists might find useful in such an application. Tohidiet al.outline an exploratory analysis based on counting ideas found in sketches [65]. In our case, seven user sketches produced 78 elements for the three crime tasks: ‘the night-time economy’ produced over twice as many as the other two crime types. The most frequently drawn tools were
star plot/glyph(three times) andline graphs(four) and there were 15
interactions associated withfilteringandaggregation– an insight into the importance of these functions to the specialists. This reductive way of examining the sketches showed promise as a quick means of deter-mining the relative acceptability of tools with domain specialists and associated discussion helped establish knowledge.
We developed a scenario by iterating drafts that incorporated the key elements learned from studying context of use with the domain specialists. The leading specialist confirmed that the final draft fairly represented the team’s exploratory work. The scenario was sent to nine individual geovis experts – potential (and proven) designers of geovis applications – to garner suggestions for tools and interactions that might be of use to the crime prevention team in their exploratory work. Their suggestions, recounted in a subsequent prompted inter-view, showed this to be a fruitful exercise. While two experts found the scenario too broadly scoped, all were able to make suggestions on tools and interactions, as well as providing commentary on the process and their approach to geovis design. Significantly, all nine requested access to supplementary information in the form of sample data with metadata and maps explaining local administrative geography. The ex-perts made 334 suggestions for tools (153) and interactions (181) after considering the scenario during interviews lasting typically for about an hour. Some consistency was apparent – the ‘top eight’ tools and interactions accounted for over 60% of all mentions. The top ranked interactions wereaggregating(23 mentions),filtering(22),comparing
(17),linking(13),zooming(11),symbolising(11) andclassifying(6). The top ranked tools weremap(35 mentions),spreadsheet/table/grid
(18),density/hot spots(12),small multiples(11),cartograms(9),
an-imation(6), parallel coordinate plot (6) and histogram(6). These
sixteen suggestions were combined into a concise statement of use to a designer building a geovis application for the specialists, and indeed used in our early designs. However the most mentioned tools and in-teractions may owe their position to being those with the widest scope, the most popular, those with the greatest past use where crime data is involved, or those mentioned in the scenario. It is also possible that highly ranked interactions owe their positions to their relatedness to highly ranked tools, or vice versa. This needs further research. We found the scenario approach was useful in geovis design but should be modified to include supplemental information, especially domain data and metadata and the graphic depiction of the geographic context through maps and data characteristics in other graphics. The geovis experts expressed their ideas differently – some were data-centered, some task-centered and some tool-centered. Some had a strong pref-erence for communicating ideas through sketches whereas others did so orally. This suggests that awareness of personal styles may be im-portant in interactions when experts work with each other or with do-main specialists and indicates that despite some consistency, alterna-tive, personal designs are likely to be developed by geovis designers.
30mins; 334 suggestions in 9 x 60 mins). The Volere template, post-lecture card sorting and the recall interview did not produce results at anything like this level. Clearly creativity is not lacking on either side of the ‘gap’, but no one approach created the ‘bridge’. Our experi-ences with the lecture suggest the need for geovis specialists to nav-igate potential users of geovis applications through the design space with ‘waymarks’ that are indicative of possibilities rather than offer-ing a comprehensive set. Whilst this may engender bias, objectivity is neither possible nor necessary in our view: geovis designers can not be independent of process, and designs should be developed through dis-course – with designers guiding the way and reflecting upon their ef-fect on the process. Responsibility and flexibility on the part of the de-signer are essential however. Emphasizing transience and thepossible
nature of suggestions through sketches and alternative arrangements (e.g. card sorts) is important here. Just as contextual inquiry through shadowing and master-apprentice results in a sample of domain con-text, so geovis education in the context of establishing requirements may best focus on a narrow set of examples described in detail rather than a comprehensive set of possibilities. Indeed to turn the process on its head, CI approaches and educational sessions in which they are simulated – such as a geovis designer being shadowed whilst working from a specialist’s scenario – may be effective for mediating geovis possibilities to specialists, particularly as they are more likely to in-volve active learning and if they can establish engagement by using relevant data identified through analysis of context of use. A com-plimentary approach [42] emphasizes the need to augment and apply knowledge by encouraging creative thinking during the requirements process. This has since proved successful in geovis [18], with a more interactive approach to learning used in developing design ideas.
The combined outputs from the process to establish requirements yielded a few methods deemed suitable for combination in a design: thematic maps, density maps, tree maps, glyphs, statistical graphics and a series of interactions for spatial and attribute selection and focus. Studying data in context reveals the particular combination of spatial, temporal and crime attribute data used. Factors that stand out from the context of use study include the limited linking of crime data to exter-nal (non-crime) data and being able to combine and filter/aggregate in terms of space, time and attribute to theorise about causality and policy effect. In addition to the composite guidance from the geovis experts, these high-level elicited suggestions comprise the inputs to the design stage of the HC process. Developing these enabled us to investigate typical HC approaches to design and prototyping for geovis.
4 EARLY PROTOTYPE DESIGNS
Early designs are frequently communicated to prospective users through a ‘wireframe prototype’ –wireframe, “designed to provide
an early approximation to a software idea” [66]. Such early designs
are “. . . best considered as sketches. They illustrate the essence of an idea, but have many rough and/or undeveloped aspects . . . the team
recognizes it as something to be worked on and developed further”
[23]. However, the complex and interactive nature of geovis militates against simple paper sketches, presenting a conundrum. We also faced the issue that the heritage, practice and guidance from both the HC and visualization traditions is a formidable body of knowledge from which to create practical designs. We experimented with rough de-signs for early prototypes in keeping with the uncertainty associated with initial design stages. These were based upon and continually evaluated against guidance from the body of HC and geovis knowl-edge to ensure relevance andcognitive plausibility [61]. This was often an internal process and we were influenced by Duncan [15] to document design choices by “capturing the inner dialogue of the
cre-ative process”. This approach was inspired by autoethnography, an
“autobiographical genre of writing and research” [19], that provided
[image:5.612.313.564.50.248.2]a helpful framework for reflecting on design ideas emerging from this diverse and sometimes conflicting body of knowledge. The method has been used in interactive design [15] and supports documented re-flection as advocated by Krygieret al. [32]. Our experiences led us to reflect on how visualization researchers learn design. The impor-tance of “learning through doing”, building portfolios, criticism and
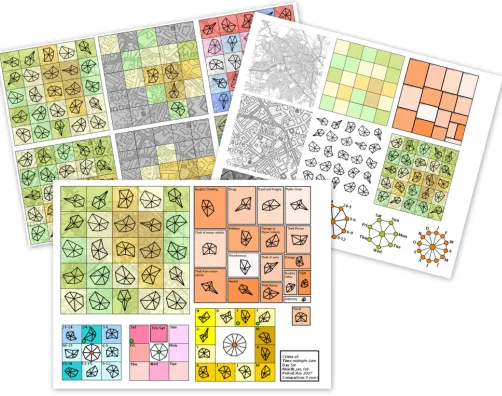
Fig. 3. Wireframe prototype (foreground), containing spatial (map), tem-poral (glyphs) and crime attribute (tree map) data. Other sheets (back-ground) show alternative states of the wireframe.
redesign [4, 29, 30] are often emphasized, and compliment our reflec-tions on learning earlier in the process. But without methods to frame (re)design it can be difficult to justify candidates. The geovis literature on how exactly designs come into being is surprisingly silent, despite the cartographic tradition – a possible blind spot for the discipline. The route to the summit may be less spectacular than the view from the top, but both are of service. We propose that designers expose more of the process that leads to a final design to help the learning of others. Our geovis experts showed willingness and ability to communicate design decisions and possibilities effectively. Duncan’s autoethnographic ap-proach [15] helped us to describe our own, detailed design journey [36] and may be of use here.
We considered various ways to modify the wireframe concept for geovis. We employed an analog light box and produced our ideas as sketches in the form of stacked transparencies. The layers were far from wholly transparent however and difficult to handle mean-ing that we were unable to effect smooth transitions. This technol-ogy was engaging and emphasized the underdeveloped and transient nature of designs but did not allow their dynamic nature to be repre-sented adequately. We returned to the medium of paper and had an insight that we could represent different states of an application effec-tively as multiples on large sheets. A typical state for a design would be supplemented by additional sheets containing stand-alone multi-ples of tool components and states. Interactions would be conveyed verbally, for example, explaining that “when the amount of data gets below a certain level, the squares affected turn grey, as in this pic-ture” (Fig. 3). We wished to see whether thesegeovis-modifiedpaper wireframes could engage the specialists to generate ideas, suggest im-provements and offer opinions to advance the design process.
Based on the specialists’ context of use, the high-level output from both sides of the ‘bridge’ obtained during the requirements phase and our reflective design practice, we created two early prototype sketches on paper, critiqued them and iterated both. In these, images of geo-vis tools were created from a range of existing applications. Back-ground maps in the wireframes reflected an area familiar to the spe-cialists, whilst the data represented was synthetic. These designs were again critiqued and iterated into geovis-modified wireframes – con-taining real and relevant geographic context – which were shown and explained to the specialists individually. They were asked to react through a ‘think aloud’ protocol, a method that consists of “asking people to think aloud while solving a problem and analysing the
re-sulting verbal protocols” [21]. Sessions were audio recorded and
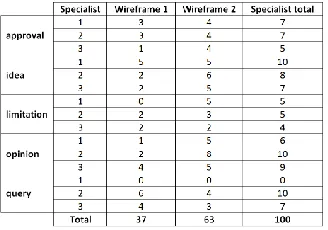
Fig. 4. Counts of text blocks containing different interaction types from specialists for the two wireframes designs, showing extent of engage-ment. The same text block can appear under multiple headings.
Ourgeovis-modifiedwireframes proved successful in
communicat-ing an understandcommunicat-ing of the design to the specialists as strongly evi-denced by the richness of their engagement with the wireframes and their narratives (see Fig. 4). Indeed seeing a tool (temporal glyph) in a wireframe completely changed a specialist’s mind about it at this stage of the HC process: “I looked at those [the glyphs] a fortnight ago [at the geovis lecture] and I hated them . . . I really hated them. I thought they were inelegant and I thought that they were hard to inter-pret. But. . . I mean, [now] I really do like it, because you’ve got the interaction of it here, I do like it. But it is kind of. . . you are trusting in
your eye, like you are saying.” We found that as trust was developed
over time and methods were employed using familiar and interesting data in ‘sketchy’ interface mock-ups that were evidently suggestive rather than definitive, mutual understanding of the problem domain increased markedly. A significant result from the work with these spe-cialists using wireframes is the crucial importance ofreal domain data. Evidence comes from another participant, who despite being told the data were simulated, was unable to hold back from attempting to in-terpret the data given the geographic context: “One of the things that is perhaps hampering my limited imagination is because it is random data. . . I immediately try and make sense of it, kind of thing. ‘Ah, theft from vehicles is very similar to. . . oh no it isn’t - it’s just random’. I immediately start to try to interpret it instead of just trying to leave it
at the level of [an example of a possible technique]. . .”
The need for real data in a geovis context can lead to contradic-tions. Real data wireframes take longer to produce than simulated data wireframes, undermining their ‘quick production’ nature. Longer production times contradict the important ‘throw away’ and ‘unfin-ished’ characteristics. Quality of paper, printing and the way in which the wireframes are introduced may also have an effect. Rough edges can disclose their status as being open to development, suggestion and change. A wireframe with higher production values may mislead a subject as to its ‘finished’ state and discourage criticism and interac-tion. Such a wireframe may lead to a greater degree of attachment in the designer, who may be reluctant to amend or discard it. The special-ists did not make amendments, annotations, additional sketches, or the like on our paper wireframes even when encouraged to do so, perhaps indicating that their production values discouraged changes.
When choosing which of the two wireframes they wished to pur-sue, specialists gave reasons that indicated how strongly their choices were rooted in their context and current tool use. Their chosen de-sign integrated spatial, temporal and crime attribute data and enabled aggregation of all three aspects at a variable range of scales. These specific considered needs were not acquired through our use of more standard HC methods at the formal ‘requirements’ stage but confirmed through interaction with the wireframes. Whilst iteration is key to HC design, the importance of these sizable ‘loops’ between (as well as within) stages of the process in the geovis context were notable and important devices to account for learning on both sides.
The paper wireframes were simple and only scratch the surface of what geovis could deliver. In one sense this is disappointing in that more advanced tools and interactions were not discussed with
prospective users. Nevertheless, it was pragmatic and “novelty is
rel-ative” in visualization [67] – it also changes rapidly, re-emphasizing
the need for iterations. One could conceive of more complex geovis tools and interactions to explore other possibilities and more advanced software may be used effectively to suggest ideas here [58]. But this is likely to contradict the need for early designs to be underdeveloped and with ‘rough edges’. The comparative success ofgeovis-modified
wireframes that situated data and method concurrently in the context of known places suggests that a focus on specific methods through early design sketches may be appropriate even earlier in the process of engagement with domain experts if ‘sketchiness’ can be afforded.
The importance of real data to engage specialists is clear from our results. Only real data carries the subtle spatial and temporal correla-tion artefacts that these specialists expect to find in thematic maps and that were absent in our glyphs of simulated crime incidents (Fig. 3). Including this in wireframes, without over-committing resources to something that should have ‘sketch like’ qualities, is challenging. We have previously highlighted the need to remove barriers to entry for those wishing to create geovis applications by “increasing efficiencies,
sharing software components and reusing resources” [16]. We suggest
developingdata sketchesto quickly and flexibly produce transient and uncertain visual representations of domain data to support the HC de-sign process by scavenging existing applications for functionality and exploiting advances in rapid graphical application development such as Processing [50, 49] that allow data, interactions and functionality to be quickly and flexibly combined. Graphical toolkit advances such as ProtoVis [7] may also be effective for rapidly creating viable early designs. These loosely bounded collections of data, functionality and ideas develop through the design process. Whilst the persistence of design elements through the process contradicts the emphasis on tran-sience, ‘patchwork prototyping’ [28] offers some efficiencies and is supported by data sketching. We have since combined hand-drawn sketches, data and interactive functionality with positive results [49].
The feedback received from the specialists on our early prototypes (Fig. 4) was useful and drove the development of more refined designs in which we investigated additional HC techniques.
5 LATER PROTOTYPE DESIGNS
As designs for a geovis application developed we examined the effec-tiveness of different types of design format and the protocols through which specialists encountered them. ISO13407 suggests a number of approaches including paper and software prototyping. Paper prototyp-ing [51] is a “variation of usability testing where representative users perform realistic tasks by interacting with a paper version of the inter-face that is manipulated by a person ‘playing computer’ who doesn’t
explain how the interface is supposed to work” [63]. A software, or
digital interactive –digital, prototype is “almost a digital version of the paper prototype. Except, digital prototypes can range from a series of low-fidelity, narrative click-through screens for quick visualization of a design concept to a high-fidelity interactive portrayal of an evolved
design. . .” [3].
We were interested in two kinds of feedback from the specialists shown a more realistic and functional prototype to establish how these devices might be used in a geovis context. We wished to find out whether useful suggestions for functionality and enhancement were forthcoming – the purpose of any prototype; and also to determine whether prototypes elicited exploratory behaviour that would be seen in users of a geovis application. The HC literature suggests a num-ber of ways to approach prospective users with prototypes that vary in the extent that the tasks carried out are determined in advance by the researcher or are left to the user; whether users are helped to use the interface by the researcher –chauffeured prototyping[46] – or not; and whether aspects of the interface are concealed – Wizard of Oz
prototyping[13] – or not. Dumaset al. suggest an active
interven-tion approach “in which a member of the [research] team sits in the room with the participant and actively probes the participant’s
under-standing of what is being tested” [14]. North argues that “researchers
[should] observe what insights users gain on their own” [45]. Clearly
Fig. 5. Later prototypes being used in active intervention sessions. Paper prototype and interface (left). Digital interactive prototype screen examples (centre) and set-up following an active intervention session with a digital interactive prototype accessed through a paper interface (right).
specialists available, but we attempted to cover as many approaches as possible in order to compare the extent that they yielded suggestions for functionality and enhancement and allowed exploratory behaviour. A user testing with active intervention approach was employed with both paper and digital prototypes, as shown in Fig. 5, and a free ex-ploration approach used additionally in the case of the digital proto-type by way of comparison, also with active intervention. We used real domain data, having determined the importance of this during the wireframe analysis, and designed a series of simple tasks involving the spatial, temporal and attribute characteristics of reported crimes to act as probes for the active intervention approaches. Seven sessions with three specialists typically lasted two hours each. We used ‘think aloud’ with audio transcription and coding to elicit users’ instances of exploration and to capture suggestions for enhancing the functional-ity of the prototypes. This had been effective earlier in the process. Order of presentation of prototype was randomised and we used two related, but different, crime attribute datasets to avoid a learning effect. Summative questioning followed these sessions to gather supplemen-tal information from specialists. To free the specialists from the need to learn an interface and to focus on functionality rather than access to it, participants interacted with both prototypes through a simple paper interface in the user testing with active intervention conditions. This was interpreted by a researcher acting as a ‘chauffeur’ [46]. When the digital interactive prototype was used with free exploration, the inter-face was under specialist control.
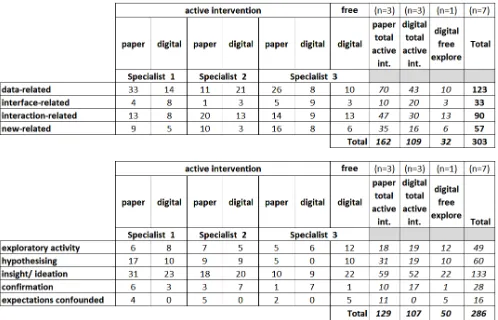
In excess of 300 suggestions for functionality and enhancements were elicited from 15 hours of individual prototyping sessions with the three specialists. Suggestions were subsequently coded using an emergent scheme into 35 main areas for improvement after an ini-tial pass through the data [55]. These were in turn grouped into four categories relating to: data, interface, interaction and novelty – ‘
new-related’ (see top of Fig. 6), with geovis related suggestions placed in
thenewcategory. The active intervention protocol data in Fig. 6 shows 162 suggestions for the paper and 109 for the digital prototype, with the paper version scoring more highly in three out of the four cate-gories. To establish whether these differences were significant we cre-ated a null hypothesis that the category of suggested functionality and enhancements was independent of prototype type (paper vs. digital in the active intervention protocol) and used a one-sided chi-squared test to compare suggestion types made for functionality and enhance-ment of the prototype. This yielded a chi-squared value of 10.66 – the critical value at the 0.05 significance level being 7.81 (DF=3). This en-abled us to conclude that the difference in number of suggestions made was unlikely to be independent of prototype type. The paper prototype yielded more suggestions than the digital interactive prototype except for interface-related improvements. In particular, it produced more
Fig. 6. Counts of instances of (top) suggestions for improvement by cat-egory for each later prototype and (bottom) observed geovis behaviour during the course of the paper and digital interactive prototyping ses-sions, by subject, prototype and protocol.
[image:7.612.309.558.278.438.2]partic-ular requests. What specialists learned from prototypes, and indeed what we learned from their interactions with them, was heavily data-dependent. Different specialists have different spatial knowledge and different responses to different spatial data sets. We found strong evi-dence that not all crimes are equally important to all specialists and some seemingly similar crime categories remained relatively unex-plored as they were deemed less “interesting” than others – partly due to their more predictable geography: car crime in parking lots; purses lost at pubs on Friday evenings. Whilst crime types used in the pro-totypes were randomised within the evaluation framework, this issue could have confounded our efforts to isolate the paper and digital ditions and the means of reporting. It draws attention to another con-tradiction in evaluating HC methods for geovis design: that real data is essential for establishing needs and yet real data sets are not com-parable in terms of their spatial characteristics or levels of familiarity and interest to participants – even when their geographies are consis-tent. A significant depth of interaction, engagement and exploration were apparent as specialists used the digital prototype – as evidenced by a large number of quotations captured during free exploration. The overall level of exploratory activity here was about twice that observed in digital active intervention in sessions of comparable length (see bot-tom of Fig. 6). Clearly, these prototypes supported exploratory activity and thus worked as a basis for developing geovis designs – though as indicated above many of these related to additional requirements as knowledge was developed and possibilities identified.
Specialists were able to engage in geovis and make suggestions for improving both prototype types. A key difference with the later pro-totypes was that specialists saw real domain data presented ‘geovisu-ally’, which resonated with them and invited engagement, explanation and exploration. One typical comment expressed this clearly: “I have been drawn into these [areas] by being able to manipulate the resolu-tion of the data. . . the more you go on with it, the more you get sucked
in to particular areas”. This may be true both of geographic areas and
metaphorical ‘areas’ of the design space and process.
We found that understanding context of use is a communications process that is not finalised in the initial ISO 13407 phase – emphasiz-ing the importance of iterations in the design process. There is a high possibility that tasks may not be fully understood without data rich (early and late) prototypes, which may lead to problems in prototyping sessions. The user testing protocol with active intervention requires task construction by the designer. It requires more resources to admin-ister especially where a chauffeur undertakes interface control. This affects the operating speed of the prototype and may place a barrier between it and the specialist. Free exploration yields a similar quan-tity of geovis related suggestions for functionality and enhancement as active intervention with a digital prototype. It needed fewer resources to administer and the tasks could be selected by the specialist. While it was necessary to tutor them in operating the rudimentary interface to the prototype, this was not a problem in practice. Methodologically, a long sequence of interviews, questions, observations, geovis wire-frame and prototyping sessions, even over a long time span, placed a large burden on these domain specialists. Most of the interactions with them were ‘one shot’ as the act of showing a wireframe or a prototype changed perceptions. Consequently, there was a balance between try-ing to extract as much as possible from these valuable participants and exhausting them, perhaps to the point of them withdrawing their coop-eration. Using tasks as a means of elicitation feels like ‘user testing’ – an approach that may be fundamentally at odds with the notion of ‘partnering’ with domain experts and attempting to understand their context of use over a long period of time. The free exploration proto-col appears to offer significant advantages over task-based user testing in this respect, with active intervention useful in both cases. We ob-served that individual geographical knowledge played a part in how specialists interacted with prototypes – the background map was im-portant in all cases and should clearly be chosen with care. We have evidence that the specialists might find geovis intimidating and proto-types (and indeed applications) may benefit from a clear pathway for neophytes. Reducing the tools available at first sight with “extras on
demand” [64] may be advantageous.
While the success of the paper prototype is encouraging, it relied on a system to produce multiple paper representations containing real domain data. In practice, this meant that our paper prototype relied on the prior existence of our digital prototype. Developing data sketches (see section 4) supports this process with efficiency. While design-ers who use this approach may be tempted to ‘cut to the chase’ with the digital prototype, we recommend they consider the advantages of paper over digital prototyping: its less finished aspect and potentially less intimidating nature, as well as our evidence of its superior results with the domain specialists. Work with these prototypes produced fur-ther evidence for conclusions drawn earlier on: the importance of real data; the importance of domain knowledge (especially as tasks become more complex); and the emerging context relating to specialists, tasks and data. Using a rudimentary interface to support free exploration in a digital interactive data prototype in conjunction with paper data pro-totyping that uses low fidelity output derived from the digital design may be an effective ‘discount’ approach to geovis design.
The transcriptions of participant’s interactions with prototypes to-talled over 150,000 words. While this detail was necessary to under-stand the way specialists interacted with geovis prototypes for the pur-poses of this research, it is not required if the aim is to establish pos-sible improvements. An experienced “note taking observer” [63] who records these in real time against a prior coding scheme is an important member of the team. Better still would be sessions where specialists and designers discuss and agree prototype development as part of the reflective design process. The HC technique of affinity diagrams [5], may be helpful here. More generally, geovis researchers working with domain experts should seek to develop ways to achieve flexibility in application design, with continual iteration, quick prototyping and the infrastructure to support this. This needs to be built on a foundation of creating bonds, understanding and confidence with specialists.
From these prototyping sessions, we compiled a list of 35 suggested features that built upon the designs and sought HC approaches to pri-oritise these. The Analytic Hierarchy Process (AHP) [59] is a well established [70] method to achieve this through a quantitative measure of user consistency. Our work on using the AHP as an HC means of prioritising suggested characteristics in the later stages of design is reported elsewhere [39].
6 CONCLUSIONS
The complex and composite natures of the geographic, visualization and HC domains make effective geovis design a challenge. Learning must take place on all sides in the contexts of organisation, application domain and power relations. Our contribution is an in-depth appraisal of various HC approaches that were poorly represented in the visual-ization literature in the context of geovis when our work commenced. This is based upon a long-term engagement with a group of domain specialists and our work with them to evaluate means of developing design ideas for applied geovis. As a result of this experience we re-port some specific results that relate to individual techniques, but also offer some general recommendations for this kind of activity. While our focus has been geovis, few of our findings have been unequivocally spatial in nature and many may be applicable to other visualization and design settings. This is not unexpected as many methods used in geo-vis are shared by or derive from graphical statistics and information visualization – and vice versa. It emphasizes the difficulty of devel-oping requirements that relate to the representation of and interaction with geography and suggests the importance both of iterative geovis development and the need for guidance in design by geovis experts rather than design objectivity. We summarize our findings and recom-mendations in Fig. 7 where geovis specific issues are highlighted.
HC Approaches Data Collection Data Analysis Summary Process Findings Summary Research Findings & Recommendations
Context of Use Contextual inquiry(CI)
Interviews; Observation; Studying docs;
Transcription; Word frequency;
Keyword in context (KWIC) 1.Word frequency & KWIC are useful & efficient analysis tools Specialists' internal documents & broader academic writing on the domain provide insights & context.
2.
Need to study broad context, including data, to develop subsequent situated design ideas in light of likely unknown (geo)vis requirements.
1.
Card sorting can elicit varying spatial emphases in specialists' approaches to tasks.
2.
» It is essential to study data & (geo)vis in context with known (spatial) data & tangible visual artefacts. » Experiment with ways of introducing tangible visual artefacts of specialists' data as early as possible.
Card sorting:
domain tasks Classifying (card sort)
Requirements
Template (Volere) Questionnaire
conducted orally Transcription;
Deductive coding
Transcription with deductive coding is highly labour intensive. A trained note-taker recording & coding during data collection is an alternative, although prior coding schemes are difficult to achieve. 1.
A scenario of specialists' context provides 'common ground' -information that enables geovis experts to suggest relevant methods. 2.
Geovis experts express their ideas differently. Awareness of personal styles might be important when experts meet domain specialists (or other geovis experts).
3.
Sketching & counting instances of tools & interactions can elicit information to supplement card sorting & summative interview. 4.
Sketching can establish relative acceptability & comprehension of geovis methods (which may in turn contribute to learning). 5.
Failure of generic Volere template to establish requirements for a geovis application & to elicit information about specialists' data.
1.
Failure of lecture on geovis to establish from domain specialists which methods might be of use. 2.
Consulting geovis experts to establish methods for specialists is effective, but with caveats. 3.
Scenarios are effective, but specialist data (including spatial) & metadata is important to geovis experts to supplement a scenario.
4.
» Requirements may usefully be informed by known (spatial) data & vis/geovis examples & prototypes. » Scenarios & sketching can generate useful design ideas if supplemented with data in context. » Transcription is costly - consider using a trained note-taker with a prior coding scheme. » Early use of tangible visual artefacts is conducive to mutual information sharing & building trust & teams.
Scenario used by geovis experts
Interview & think aloud; Summative questioning
Counts of geovis methods in card sort & in sketching
Lecture for communicating geovis to specialists
Card sorting: geovis methods;
Sketching;
Recall interviews
Design Early Prototypes
Early design Documenting
design process Reflection (autoethnography)
Autoethnographic inspired approach to reflection in the geovis design process is useful.
1.
See transcription above. 2.
Specialists interact effectively with modified wireframe prototypes, which elicit a rich body of information, creativity & understanding. 3.
Wireframes need to be modified to represent multiple tools & multiple states to successfully communicate a geovis application to specialists.
1.
Specialists engage poorly with dummy data map wireframes -- they do not represent spatial correlation. Real data is important. Using known phenomena in known areas exploits tacit knowledge.
2.
Phenomena & data vary hugely. Using a variety of real data sets with different characteristics is recommended, in discussion with specialists who understand the vagaries of data & geography. 3.
Despite data realism wireframes must afford uncertainty by retaining provisional visual characteristics. 4.
» Designers of (geo)vis applications are encouraged to systematically record & share their 'design narrative'. » Use a variety of prototypes & data sets in a number of states & select a range of phenomena for study. » Means of reusing designs & affording uncertainty are important for flexibility, interaction & efficiency. Wireframe prototype Think aloud; Summative questioning; Observation
Transcription & deductive coding; Counts, & representative comments, coded by approval, ideas, limitations, opinions & queries; Counts of tools, interactions & data; Summative questioning & observation for effective additional evidence
Design Later Prototypes
Paper prototype with user testing & active intervention protocol; Digital prototype with user testing & active intervention protocol; Digital prototype with free exploration protocol Think aloud; Summative questioning; Observation;
Transcription & deductive coding; Counts, & rep. comments, coded by instances of exploratory activity, hypothesis forming, insight/ideation, expectation confirmed/confounded & suggestions for improvement; Summative questioning & observation for effective additional evidence
See transcription above. The later prototyping required transcription of 150,000 words, taking several months.
1.
Both paper & digital prototypes engage specialists successfully, elicit exploratory activity, hypothesis forming, confirm/confound expectations & establish possible improvement, with both protocols. 2.
A paper prototype with multiple representations of real data relies on the prior existence of a digital process, if not a digital prototype. 3.
A free exploration protocol yields results with fewer resources & less researcher intermediation that a user testing protocol. It may also address some of the power/partnership issues, stimulate interest & help with trust & team-building. See requirements above. 4.
Paper prototype produces more suggestions for improvement than digital and twice as many related to novel features (such as geovis). Paper prototypes seem effective in stimulating creative thinking. 1.
The free exploration protocol yields twice the level of exploration as user testing with active intervention protocol & may have other advantages. See trust & team building above.
2.
Detailed domain knowledge (including spatial knowledge) is needed is needed to make hypotheses & extract meaning from patterns in data.
3.
Where cartography is used to aid spatial navigation, maps also convey attribute information to specialists that supports ideation & design.
4.
» Use paper prototypes to stimulate interaction & generate ideas about novel features.
[image:9.612.44.557.47.251.2]» Free exploration is efficient & effective for exploring ideas & results in learning about domain, data & methods. » Extras on demand may reduce the intimidating nature of geovis prototypes & contribute to learning. » Use 'data sketches' with rapid development methods to create wireframes, & prototypes as the process iterates.
Fig. 7. Summary of HC approaches used. Stages follow chronologically, row by row, showing main data collection and analysis methods, summaries for process findings (of use to researchers building an application for domain specialists) and our research findings (here, entries in bold are most specific to geovis) and associated recommendations. Color indicates which approaches may be helpful to researchers:red = not recommended;
green = recommended;amber = intermediate. The coding does not apply to use in pursuit of our research aims, where transcription, for example, was a good way to amass information for analysis, but is too time-consuming for everyday use.
here as participants become partners in in-depth studies [60]. We find that keyword-in-context analysis is a strong technique in addressing a corpus of textual domain information; that internal and external docu-mentation supplement interviews and observation effectively; and that card sorting is a valuable technique to understand conceptual models of tasks and techniques. Strong evidence was generated in our case study that the communication process between specialists in domain and visualization must be firmly embedded in the domain context with real data that domain specialists know and own from an early stage.
We report that domain specialists had ‘undreamed-of’ requirements that could not be effectively established from a standard HC approach (the Volere template), nor from the card sorting or recall interviews af-ter a lecture on geovis tools and inaf-teractions. The levels of detail and engagement here were inadequate. Sketching by specialists did pro-duce a large number of geovis elements within sketches that were not, in themselves, useful as early designs. Developing ascenario supple-mented withdataproved effective both in transferring our understand-ing of the specialists’ context of use and needs and in communicatunderstand-ing these to geovis experts – the scenario resulting in credible suggestions for tools and interactions to include in a design with some consistency. As such, we recommend that structured requirement elicitation and di-dactic methods of knowledge sharing such as the lecture be eschewed in the case of geovis in favour of early and repeated exposure to simple ‘sketchy’ approximations based on visualization experts’ experience, assembled from appropriate low-cost/investment components that pro-vide access to domain specialist’s data. Confirming patterns in known data may be a useful process [56] even at this early stage as designers guide prospective users subjectively through design possibilities.
Synthesising design elements for a plausible initial design was challenging. Highlighting the introspection and reflection on design, which is infrequently explicit in the visualization literature, may be beneficial as may sharing this information both with specialists and other geovis designers. We recommend designers externalise their jus-tification, as did our geovis experts. Autoethnography could be con-sidered as a means of framing reflection when reporting discourse.
Our work showed that specialists engaged particularly well with tangible visual artefacts containing real domain data, including wire-frame, paper and digital prototypes under different protocols. They undertook many exploratory activities, formed hypotheses, gained in-sights, confirmed known facts and confounded others. Specialists gen-erated many suggestions for enhancements through prototypes. Both
paper and digital prototypes were effective at encouraging exploratory activity with real data sets, but paper was better at delivering sugges-tions for functionality and enhancements, particularly for suggessugges-tions considered ‘novel’ – it should not be discounted as a means of empha-sizing early designs as possibilities, engaging specialists in the process and establishing their likelihood to have effect.
We recognise that the activities reported here took place within our research framework, that emphasized the need to develop knowledge about HC process rather than a working design. This may have influ-enced participants in terms of their engagement. Giving domain spe-cialists confidence in the potential effect of their suggestions is essen-tial. This can be supported in a number of ways, such as by giving do-main specialists control over the process through, for example: ‘show and tell’ approaches to developing visualization awareness; ‘imagi-nation exercises’ [18] with no ‘wrong answers’; and the inversion of power relations involved in specialists shadowing geovis developers as they design, and externalise the design process, or instructing them to act as chauffeurs through paper prototypes and interfaces.
A key theme in these conclusions is the strong recommendation that real data that are known and of interest to subject specialists be utilised early in the geovis design process. We recommend that it be utilised as a framework for discussionfrom the outset. Tangible vi-sual artefacts depicting real and known data are likely to be the most effective at engaging participants in discussing the issues of distance, spatial dependence, scale and heterogeneity that they deal with in their analytical roles and around which any geovis solution should be de-signed. They are likely to inform designers about choices that relate well to important structure in data as they explore change, cause and effect. Indeed undeveloped prototypes that combine data, interactive functionality and hand-drawn sketches may meet many of the needs of early geovis design and work particularly well as ‘discount’ methods used to inform the HC design process (e.g. [49, 11]).
cy-context of use requirements
evaluation A
B design
context of use requirements
evaluation A
[image:10.612.104.518.50.182.2]B design
Fig. 8. The Human-Centered Design process [27] development cycle, with alternative entry points and process trajectories. The green trajectory (left) may be considered a ‘traditional’ use of HC approaches [26] beginning at pointBas opposed to HC design that begins atA. We identify the need to use informative example designs to establish context of use and requirements in geovis as shown by the red trajectories.
cle at point A (Fig. 8, left – see blue trajectory) represents a view that underlies much of this work. However, note our recommendation that an engagement with data, graphics and interaction is so important in grounding geovis applications in geographic phenomena when es-tablishing context of use and requirements, that tangible visualization examples containing real data are essential at these stages. Thus we suggest that low level data prototypes containing relevant and interest-ing data, includinterest-ing the paper designs (with simulated interaction) that were so effective in our study, and even existing (evaluated) applica-tions (clearly presented as designpossibilities) [58], be brought into the stages at which context of use and requirements are established. The potential costs of bias are mitigated by the likely benefits in terms of creativity, knowledge sharing and team building – particularly if identified as a risk. Fig. 8, right, shows two (red) trajectories that start at this stage, with designs, and draw them in to the vital stages that ‘ground’ development and establish needs to inform more specific de-signs that are subsequently suitable for formal evaluation. Establishing a means of rapidly generating flexible visual artefacts that do not rep-resent high levels of investment (in terms of time or ideas) or suggest permanence but that increasingly use relevant known data is key here. In summary, the ISO13407 taxonomy is useful in the geovis con-text, if applied flexibly and the following are considered in detail and with sensitivity: the relationship between designers and ‘users’; their mutual learning; geography and the data that describes it; a wide range of possibilities in terms of design and function. In light of this we make a series of broad recommendations for using HC design geovis:
1. make the design process interactive, creative and interesting with buy-in from all parties;
2. use a range of real data that is known to domain experts in de-signs – do so early on in the process with example dede-signs; 3. emphasize transience in designs that affords suggestions –
show-ing data in designs on paper works well;
4. scenarios (with data) and shadowing can be effective – the latter may work both ways to address the contexts of both domains and challenge power relations (CI for geovis education);
5. develop digital sketches to create visual artefacts such as paper and digital interactive prototypes – be efficient in terms of re-use where you can, but not at the cost of a lack of flexibility; 6. free exploration with prototypes or existing software meets many
of these needs, being engaging for specialists, informative for designers and developing the knowledge of each concurrently; 7. a think-aloud protocol can be effective for establishing reactions
to visual stimuli, for mediation and learning;
8. build a team through co-discovery and by breaking down power relations – you may not even realise they exist;
9. reflection in design is essential – autoethnography can exter-nalise and systematize this;
10. iterate within and between levels of the HC process – for example through an ‘extras on demand’ approach in prototypes.
Finally, the participants in this research are described as geovis ‘
re-searchers’ or ‘designers’ and subject domain ‘specialists’. While
in-dicative of academic objectivity, terms such as ‘subject’ do not con-vey the reality of the engagement required between the parties over a lengthy period forin-vivodesign work, even when it involves the kinds of structured experiments described here. A relationship had to be forged and understanding and confidence built. We consider
co-discovers,colleaguesorpartners[60] to be more appropriate terms.
HC approaches that feel like user testing are uncomfortable when do-main specialists who have come to regard themselves asco-discovers
are asked to act as ‘subjects’. The free exploration protocol was more appropriate in this respect in later prototyping, where it was as effec-tive as aceffec-tive intervention with tasks and simpler to administer. Like Robinsonet al. [56], we find that the development process is likely to occur across multiple projects and the relationships and trust devel-oped in establishing the designs described here have proved to be an excellent basis for continuing work.
ACKNOWLEDGMENTS
This work was funded by the EPSRC via industrial CASE award EP/C547438/1. Significant contributions made by Robert Radburn and colleagues in Research and Information at Leicestershire County Council, Dr. Panayiotis Zaphiris, the nine geovis experts and four anonymous reviewers are acknowledged with thanks.
REFERENCES
[1] P. A. Alexander, J. M. Kulikowich, and S. K. Schulze. How
subject-matter knowledge affects recall and interest. Am.Ed.Res.J., 31(2):313–
337, 1994.
[2] G. Andrienko, N. Andrienko, U. Demˇsar, D. Dransch, J. Dykes, S. Fab-rikant, M. Jern, M.-J. Kraak, H. Schumann, and C. Tominski. Space,
Time, and Visual Analytics.Int.J.GIS, 24(10):1577–1600, 2010.
[3] J. Arnowitz, M. Arent, and N. Berger.Effective Prototyping for Software
Makers. Morgan Kaufmann, Amsterdam, Netherlands, 2007.
[4] E. Bertini. Visuale: The neglected role of interaction in information vi-sualization. http://visuale.bertini.me/?m=200705, 2007.
[5] H. Beyer and K. Holtzblatt. Contextual Design: Defining
Customer-Centered Systems. Morgan Kaufmann, San Francisco, CA, 1997. [6] C. M. Bird. How I Stopped Dreading and Learned to Love Transcription.
Qualitative Inquiry, 11(2):226–248, 2005.
[7] M. Bostock and J. Heer. ProtoVis: A Graphical Toolkit for Visualization.
IEEE Trans.Vis & Comp.Graph., 15(6):1121–1128, 2009.
[8] S. Carpendale. Evaluating information visualizations. In A. Kerren,
J. Stasko, J.-D. Fekete, and C. North, editors,Information Visualization,
volume 4950 ofLNCS, pages 19–45. Springer Berlin / Heidelberg, 2008.
[9] J. M. Carroll. Five reasons for scenario-based design. Interacting with
Computers, 13(1):43–60, 2000.
[10] M. Catani and D. Biers. Usability evaluation and prototype fidelity: Users
and usability professionals.Proc. Human Factors and Ergonomics
![Fig. 2. Stages of the Human-Centered Design process described in ISO13407 [27]. Those addressed in our study are highlighted in white, with‘snapshots’ of some of the graphical approaches investigated throughout the process shown by way of example in Fig](https://thumb-us.123doks.com/thumbv2/123dok_us/1594901.112272/3.612.77.532.52.124/centered-described-addressed-highlighted-snapshots-graphical-approaches-investigated.webp)

![Fig. 8. The Human-Centered Design process [27] development cycle, with alternative entry points and process trajectories](https://thumb-us.123doks.com/thumbv2/123dok_us/1594901.112272/10.612.104.518.50.182/human-centered-design-process-development-alternative-process-trajectories.webp)