The impact of government targets on waiting times for elective surgery: new insights from time-to-event analysis
58
0
0
Full text
(2) Department of Economics School of Social Sciences. The impact of government targets on waiting times for elective surgery: new insights from time-to-event analysis Sofia Dimakou 1 David Parkin2 Nancy Devlin3 Department of Economics, City University John Appleby4 King’s Fund, London. Department of Economics Discussion Paper Series No. 06/05. 1. Department of Economics, City University, Northampton Square, London, EC1V 0HB, UK. Email: s.dimakou@city.ac.uk 2 Email: d.parkin@city.ac.uk 3 Email: n.j.devlin@city.ac.uk 4 King’s Fund, Cavendish Square London, U.K. E-mail: Jappleby@kf.com.
(3) Introduction Waiting lists for elective surgery - that is, routine, non-emergency clinical procedures are a common feature of collectively-financed health care systems where coverage is universal and consumers face zero price at the point of demand. Waiting lists function, in part, as a non-price rationing device to reconcile differences between supply and demand. The number waiting at any point in time is determined by the rate at which people leave the list - by being admitted for surgery, self-deferring, being removed for clinical reasons or dying - relative to the rate at which people join the list, as a result of a decision by a consultant (Boyle and Appleby, 2001). Recent work by Gravelle, Smith and Xavier (2003) has demonstrated that waiting times and waiting list sizes act as signals that have an impact upon both supply and demand. Long waiting lists and extensive waiting times for elective surgery have been a persistent source of policy, political and popular concern in the UK and other OECD countries for many years (Siciliani and Hurst, 2003). Notwithstanding the considerable resources and effort that have been directed to reducing waiting lists and waiting times in England since the NHS Plan (Department of Health, 2000), the number waiting for inpatient treatment is currently around 900,000, 9% of whom have waited six or more months; a further two million are waiting for an outpatient appointment (Department of Health, 2004). Policies to reduce waiting lists can include both supply-side responses, for example extra funding for elective surgery, tackling supply bottlenecks, provider monitoring and management of waiting lists; and demand management, for example promulgating guidelines for appropriate referral and explicit methods for prioritising patients. Historically, NHS policy on waiting tended to reflect a view that waiting lists were a backlog of untreated patients, a problem that could be ameliorated by short-term increases in activity (Hamblin, Harrison and Boyle, 1998). More recently, the emphasis of policy has shifted from waiting lists to waiting times, on the grounds that patients are more concerned about the speed with which the queue moves - and thus the time they spent on the list – rather than the number of people waiting in front of them. While current policy combines a number of the supply- and demand-side strategies noted above, the main strategy has been to use waiting times targets (Harrison and Appleby, 2005). These take the form of maximum waiting times for elective surgery that providers should meet - with associated rewards and penalties for successful and unsuccessful performance. The waiting time target for inpatient elective surgery to be achieved by 2005 is 6 months, with intermediate targets of 18 months by March 2000; 15 months by March 2002, 12 months by March 2003 and 9 months by March 2004 (Appleby et al, 2005). Furthermore, the government has pledged that by 2008 there will be a maximum wait of only 18 weeks from initial referral of a patient by a general practitioner to inpatient treatment if required.. 1.
(4) Although there has been some success in reducing waiting lists and times, such as the significant reductions in long waits since 2000, there are a number of concerns specifically relating to the use and impact of these targets. Principal among these is the extent to which targets distort clinical priorities, by changing the order, and thus speed, with which patients are treated. The National Audit Office reports that 20% of consultants surveyed in three specialties stated they had changed the order they had prioritised patients so as to meet the corresponding target (NAO, 2001). In one respect, this changed order of priorities is not an unintended side effect, but indeed the entire point. Although there is evidence to suggest that the length of a patient's wait may have influenced clinical decisions to admit even before the introduction of targets (Appleby et al, 2005), presumably the targets reflect an explicit view that whatever clinical or social factors determined priority for treatment did not place sufficient weight on time waited, in particular, maximum time waited. However, if providers are meeting targets by substituting less urgent cases, with less ability to benefit, for more urgent cases, with higher ability to benefit, then this would be a potential cause for concern on both economic and ethical grounds. The challenge in analysing the number, importance and effect of these changes in admission decisions arising from the targets is that the admission criteria without targets are neither clearly specified nor consistent. Individual clinicians assess patients' conditions according to their own personal judgements of clinical urgency. There are neither ‘gold standard’ admission criteria nor any systematic scoring system in widespread use in the UK to aid between-patient prioritisation. Culyer and Cullis (1976) advocated such an approach over 25 years ago, and there are examples of such systems from other countries (Siciliani and Hurst, 2003; Hadorn and Holmes, 1997). More fundamentally, neither the way in which providers meet the targets nor what differentiates 'successful' from 'unsuccessful' trusts with respect to the targets are clear. For example, targets may be met principally by increasing surgical throughput reducing waiting times for all patients - or by substituting the treatment of low wait patients with high wait patients, or a mix of both. The targets create incentives which might be expected to affect both manager and clinician behaviour. Appleby et al (2005) provided some evidence on these issues for orthopaedic surgery. Waiting times distributions were compared before and after the introduction of targets, with differences in the distributions used to identify changes in admission patterns. The results appear to suggest that “…any reordering of cases had less to do with substituting very short wait (presumed urgent) cases with longer wait (presumed less urgent) cases but rather that the latter displaced some (less urgent) ‘filler cases’ – that is, those with short operating times which could be used to make best use of available theatre time”. However, given the reliance on relatively crude before-and-after comparisons of waiting times distributions, this interpretation remains somewhat speculative. This paper investigates these issues, using the techniques of time-to-event (survival) analysis. Our aim is to address the following questions: how have behavioural responses to the targets influenced the distribution of waiting times? How is the 2.
(5) probability of admission for any given waiting time affected by the targets? To what extent are clinical distortions evident in the pattern of admissions? Can variations between individuals' waiting times be explained by clinical, patient or provider-level characteristics? In addressing these questions, there is an additional aim, to assess whether or not time-to-event analysis provides additional insights and therefore whether or not it should be more widely applied to waiting time data.. Applying time-to-event analysis to waiting list data Time-to-event analysis has been widely used in social and economic sciences, where it is also known as duration analysis, in biomedical sciences, where it is known as survival analysis, and in engineering, where it is known as failure-time analysis. It consists of a set of parametric and non-parametric methods for estimating survivor and hazard functions, which are explained below, allowing the comparison of the survival of different groups and estimating the impact of explanatory variables on survival. (See, for example, Cox and Oakes, 1984; Collett, 1994). In the context of this paper, ‘survival’ means remaining on a waiting list, , the ‘event’ is admittance to a hospital and ‘time’ is that between being placed on a waiting list and being admitted. Time-to-event analysis offers several advantages in analysing waiting time data. First, because the analysis is performed on individual record data, it may generate deeper insights than methods that focus on comparison of average waiting times. Secondly, survival analysis techniques are appropriate given that waiting times are not usually normally distributed. Thirdly, it addresses the problem of censored observations, which contain only partial information about waiting times, such as for patients who have been entered onto a waiting list but have not been admitted and patients who have been admitted, but for whom the date of entering the waiting list is not known. However, in this study the data set did not include censored observations. Two key concepts in time-to-event analysis are survival functions and hazard functions. A survival function shows the conditional probability of a person surviving on the waiting list until a given time, which is a cumulative density function derived from the unconditional probability of survival. Such functions can be modelled parametrically, by assuming a particular distribution, but can also be estimated empirically usually through the application of the Kaplan-Meier or product limit estimator. In effect, this shows the rate at which people leave the waiting list and the variations in this rate over time. It also provides an estimate of the average waiting time as the integral of the survival function, though for data that are not censored this is merely an alternative calculation to a straightforward mean. An advantage of survival functions over means in this context is observing patterns of waiting list behaviour over time – the same average waiting time might be generated by very different means of managing lists over time. Survival functions can also be compared between different groups, defined for example by illness, treatment, doctor or patient characteristic, and differences can be tested statistically using the log-rank test. In addition, the impact of variables that affect waiting time patterns can be analysed. The hazard function shows the probability of a person leaving the waiting list at a given time, conditioned by the probability that they remained on the waiting list until 3.
(6) that time. The survival and hazard functions are mathematically related, and any given hazard function generates a particular survival function and vice versa. For example, if the hazard function is constant – the instantaneous conditional probability remains the same at all times – this generates an exponential survival function of the form S(t ) = e − λt , where λ is the hazard rate. The advantage of this is that it may reveal patterns of waiting list behaviour that would not otherwise be apparent – for example, if management effort in clearing waiting lists varies over time, so that patients have a varying probability of being admitted that is not related to the length of time that they have already waited. In the context of analysing the impact of other variables on waiting list patterns, parametric models have two flavours, which depend on assumptions about the hazard rate. Proportional hazard (PH) models assume that there is a baseline hazard function that depends on time but not on the other variables and is therefore common to all individuals. The other variables, which are usually assumed to be time-invariant, essentially scale the hazard function for each individual. A valuable technique in estimating PH models is the semi-parametric Cox regression, which does not require any assumption about the hazard rate, simply the impact on it of the other variables. Accelerated failure time (AFT) models allow scaling to vary over time. Although these are therefore more flexible, they are entirely reliant on assumptions about the underlying hazard function; there is no equivalent of Cox regression.. Data and Methods Hospital Episode Statistics (HES) data were used. HES data cover all episodes of care for UK NHS hospital patients provided in NHS hospitals or elsewhere. These are obtained from an annual snapshot of data submitted by NHS Trusts to the NHS-Wide Clearing Service (NWCS). The data are collected by financial year and in each year cover approximately 11 million admitted patient records. We analysed HES data for elective surgery in three specialties - general surgery, trauma and orthopaedics and ophthalmology - for the financial years 2001/2 and 2002/3. We chose these specialties because they constitute more than 50% of the overall proportion of patients waiting for elective treatment. The data include information on specialty, diagnosis, operation, Healthcare Resource Group (HRG), admitting hospital, type of admission and patient characteristics such as age, sex, ethnicity and residence5. However, because of confidentiality issues, we were not able to obtain data on individual referring GPs or admitting consultants, even at an anonymised level. Analysis of data that contained such information would obviously be very valuable, but our work only shows the potential of time-to-event analysis in such uses. Analysis of waiting times included the following: • Estimation of the survival and hazard functions of waiting times of patients admitted through waiting lists using the Kaplan-Meier estimator.. 5. The data contained no items that would enable an individual patient to be identified.. 4.
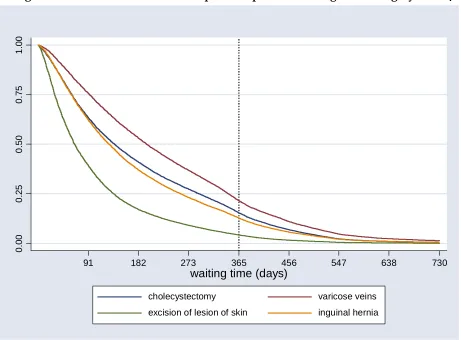
(7) • Exploring differences in survival and hazard functions according to specialty, operation, HRG, provider level and admission type, by both graphical methods and by the log-rank test. • Adjustment of survival and hazard rate functions for the effects of covariates which may impact on waiting times, using parametric Proportional Hazard and Accelerated Failure Time models under different distributional assumptions and Cox regression.. Results Identifying variations in waiting times for elective surgery in different specialties Figure 1 shows the survival curves for all patients admitted in the three specialties during 2001/2. The results for 2002/3 are not shown but are very similar. Initial analysis revealed that there are some patients in the HES data who appear to wait for a very long time (~ 3500 days), but as this is most likely the result of coding problems, all patients waiting more than three years - 1095 days – (around 0.1% of all patients) were excluded from the analysis. The curves show the proportion of patients on the waiting lists at each time. At time 0, all patients are on the list and the curve falls as they leave the list by being admitted. At around 600 days the proportion of people remaining on each list is very small. This figure is truncated at 730 days to reveal more informative patterns. Future drafts of this paper will follow the same display. The shortest waiting times are for general surgery, followed by ophthalmology with orthopaedics having the longest times. The log-rank test for equality of the survivor functions revealed that the differences between waiting times for the three specialties are statistically significant for both financial years. The shapes of the curves are quite different, and the curves for general surgery and ophthalmology cross, so that after the point of intersection (at around 456 days) ophthalmology patients have the shortest times.. 5.
(8) 0.00. 0.25. 0.50. 0.75. 1.00. Figure 1: Kaplan-Meier survival curves for three specialties – 2001/2. 91. 182. 273. 365. 456. 547. 600 638. 730. waiting time (days) general surgery. trauma & orthopaedics. ophthalmology. Figure 2: Hazard curves for three specialties – 2001/2. 0. .0025. .005. .0075. .01. .0125. .015. Prevailing target – 15 months. 91. 182. 273. 365. 456. 547. 638. 730. waiting time (days) general surgery. trauma & orthopaedics. 6. ophthalmology.
(9) Figure 2 shows the estimated hazard functions for 2001/2. In that year, the national maximum waiting time target was 15 months. The hazard functions show the effects of waiting times targets clearly: the probability of admission for those whose wait approaches a target increases markedly and falls when their wait exceeds the target. The impact is, however, different in the different specialties. For general surgery, increased waiting list activity is observed as a peak in the curve for people waiting 4 and 15 months; for ophthalmology, at exactly 15 months; for orthopaedics between 15 and 18 months. Although the hazard curves for 2002/3 are not shown, they suggest that as the targets waits become shorter, the peaks changed, in each case occurring at a lower waiting time. For general surgery, the main peak was at 12 months, which coincides with the waiting time target for that year; for orthopaedics between 12 and 15 months; for ophthalmology, around 14 months. Identifying variations of waiting times for different operative procedures Given that waiting lists may be managed for particular operations, rather than specialties as a whole, waiting time patterns between operations may differ. Waiting times were therefore analysed for the most four frequently occurring operative procedures within each specialty: General surgery Excision of gall bladder (total cholecystectomy) Ligation of varicose veins of leg Excision of lesion of skin Primary repair of inguinal hernia Trauma & Orthopaedics Release of entrapment of peripheral nerve at wrist Total prosthetic replacement of hip joint using cement Total prosthetic replacement of knee joint using cement Endoscopic operations on semilunar cartilage Ophthalmology Extirpation of lesion of eyelid Incision of capsule of lens Prosthesis of lens Cauterisation of lesion of retina. These 4 operative procedures account for 26% of all general surgeries. These 4 operative procedures account for 28% of all orthopaedic surgeries. These 4 operative procedures account for 71% of all ophthalmologic surgeries, with lens prosthesis being the prevalent one (62% of all ophthalmologic procedures). In each case, analysis at the level of was also performed; this gave similar results to that at the operation level and is therefore not reported.. 7.
(10) Figure 3 shows survival curves for procedures within general surgery for 2001/2. The shortest waiting times were for excision of lesion of skin, followed by inguinal hernia repair, gall bladder excision and varicose vein ligation. The log-rank test for equality of the survivor functions also revealed that these differences were statistically significant. They may be due to the urgency of the operation type, its difficulty and whether or not it can be performed as a day case.. 0.00. 0.25. 0.50. 0.75. 1.00. Figure 3: Survival curves for four operative procedures in general surgery – 2001/2. 91. 182. 273. 365. 456. 547. 638. 730. waiting time (days) cholecystectomy. varicose veins. excision of lesion of skin. inguinal hernia. The survival curves for orthopaedic and ophthalmology procedures are not shown, but again there were significant differences between them. In orthopaedics, the order from shortest to longest waiting time was release of entrapment of peripheral nerve at wrist, endoscopic operations on semilunar cartilage, hip replacement and knee replacement. There is a particularly large difference between the curves of the first two procedures compared with the last two. Within ophthalmology, the order was cauterisation of lesion of retina, incision of capsule of lens, extirpation of lesion of eyelid and prosthesis of lens. Figure 4 shows the hazard curves for general surgical operations for 2001/2. Observed peaks in hazard rates for excision of lesion of skin are around 3 months and 15 months. For 2002/3, the first peak is unchanged, but the second peak reduces to almost 12 months; suggesting that increased activity due to shorter target times affects patient waits that are at or longer than the target, but not those that are shorter than the target. For the other procedures, peaks are observed at just after 15 months for 2001/2 and. 8.
(11) between 12 and 15 months for 2002/03, again suggesting a response to the shorter maximum waiting times targets over the two years. Figure 4: Hazard curves for four general surgical operations – 2001/2. 0. .0025. .005. .0075. .01. .0125. .015. Prevailing target – 15 months. 91. 182. 273. 365. 456. 547. 638. 730. waiting time (days) cholecystectomy. varicose veins. excision of lesion of skin. inguinal hernia. Hazard rates for orthopaedic and ophthalmologic procedures are not shown, but also show differences between procedures and responses to shorter targets. Within orthopaedic procedures, the main peaks for endoscopic operations on semilunar cartilage, hip replacement and knee replacement all reduced from 15 months in 2001/2 to between 12 and 15 months for 2002/3. However, the main peak for release of entrapment of peripheral nerve at wrist increased from between 6 and 12 months in 2001/2 to 12 months in 2002/3 – both of which are shorter than the prevailing target. Within ophthalmologic procedures, the main peak for prosthesis of lens reduced from 15 months in 2001/2 to between 12-15 months for 2002/3. The other three procedures had far earlier peaks, at around 3 months, which were the same in both years. There were other peaks in 2001/2, between 12 and 15 months for extirpation of lesion of eyelid, a little less than 12 months and around 18 months for incision of capsule of lens, and a little more than 15 months for cauterisation of lesion of retina. In 2002/3, these secondary peaks were between 12-15 months for all three. Again, this suggests activity to achieve the targets was focussed on tackling longer waits.. 9.
(12) Identifying variations in waiting times for elective surgery between providers Seven Trusts were chosen for analysis at the provider level: • The Royal Free, Hampstead • Queen’s Medical Centre, Nottingham University Hospital • Southampton University Hospitals • Guy’s & St.Thomas • Birmingham Heartlands & Solihull • The Newcastle Upon Tyne Hospitals • Central Manchester and Manchester Children’s University Hospitals We chose these providers because first they represent different geographical entities from all over England and secondly due to the different pattern of admissions they exhibit. According to the geographical area they belong to, trusts are part of distinct Health Authorities and broader Regional Offices. Manchester University Hospital belongs to North West Regional Office, Nottingham University Hospital to Trent Regional Office, Southampton Hospital to South East Regional Office, Newcastle Upon Tyne Hospitals to Northern and Yorkshire Regional Office, Birmingham Heartlands & Solihull to West Midlands and finally the Royal Free and Guy’s & St.Thomas Hospitals to North Central and South East London respectively. Figure 5 shows hazard curves for these providers for both years. The patterns and peaks differ greatly between providers. Some do not have notable peaks; for these providers, the probability of admission did not vary much over waiting time, for example the hazard curve for the Royal Free Hospital is almost horizontal in both years. All of the peaks, for those providers that have them, change over time, although the extent of this differs. For example Newcastle Upon Tyne Hospitals has a main peak of between 6 and 12 months for both years, with only a small difference between them. Other providers’ changes were much larger, for example, the main peak for Birmingham Heartlands & Solihull reduced from a little more than 15 months in 2001/2 to 12 months in 2002/3.. 10.
(13) Figure 5: Hazard rates for seven Trusts in 2001/2 and 2002/3 Prevailing target – 15 months. 0 .005 .01 .015 .02 .025 .03 .035 .04 .045 .05. 2001/2. 91. 182. 273. 365. 456. 547. 638. 730. waiting time (days) Royal Free. Nottingham. Southampton. Birmingham. Newcastle. Manchester. Guys. Prevailing target – 12 months. 0 .005 .01 .015 .02 .025 .03 .035 .04 .045 .05. 2002/3. 91. 182. 273. 365. 456. 547. 638. 730. waiting time (days) Royal Free. Nottingham. Southampton. Birmingham. Newcastle. Manchester. 11. Guys.
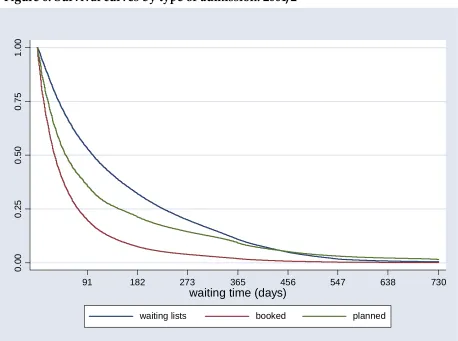
(14) Identifying variations in probability of admission according to admission source Patients can be admitted to hospital from a variety of sources. Three major routes are waiting lists, where there is no exact date of admission, booked admissions, where there is an exact date for admission and planned, where there is an exact date of admission for a course of treatment over time or a second operation. Figure 6 shows survival curves for 2001/2 by admission method and Figure 7 shows corresponding hazard curves for both 2001/2 and 2002/3. Booked admission patients are usually admitted fairly quickly, and survival curves show that the proportion of patients waiting for booked admission decreases more quickly over time than for planned or waiting list patients. Below 450 days, survival on the waiting list for planned admissions is below that for waiting list admissions; after that the reverse occurs. The main peaks in the hazard curves for booked admissions are 3 months for both years and also 15 months for 2001/2 and 12 months for 2002/3. The patterns for the hazard rates do not change for planned admissions over the two years, but the main peak for waiting list admissions reduces from around 15 months in 2001/2 to between 12-15 months in 2002/3.. 0.00. 0.25. 0.50. 0.75. 1.00. Figure 6: Survival curves by type of admission: 2001/2. 91. 182. 273. 365. 456. 547. 638. waiting time (days) waiting lists. booked. 12. planned. 730.
(15) Figure 7: Hazard rates by type of admission Prevailing target – 15 months. 0. .0025. .005. .0075. .01. .0125. .015. 2001/2. 91. 182. 273. 365. 456. 547. 638. 730. waiting time (days) waiting lists. booked. planned. Prevailing target – 12 months. 0. .0025. .005. .0075. .01. .0125. .015. 2002/3. 91. 182. 273. 365. 456. 547. 638. waiting time (days) waiting lists. booked. 13. planned. 730.
(16) Applying time-to-event analysis at a less aggregated level The analysis undertaken so far has clearly established that patterns of admissions for elective surgery varies between different specialties, operative procedures, HRGs, particular providers and different admission methods. Yet, all previous graphs exploited data at an aggregated level; the first part of the paper concentrated on the differences between specialties as a whole, that is in all NHS trusts of England during financial years 2001/2 and 2002/3, the second part revealed waiting times variations according to type of operation undertaken in all UK hospitals, the third part explored differences between providers with respect to the entire set of waiting lists of each provider treating the different heterogeneous lists as a homogeneous unique waiting list and finally the last part used all available data of the two financial years to compare different admission methods in terms of differences of the time period a patient has to wait for treatment. This section of the paper will address the same questions using less aggregated data. It aims to expose behavioural responses to targets by managers and clinicians and their effect on waiting times distributions. Evidence for possible clinical distortions will be also examined. In order to demonstrate the potential of time-to-event analysis at exploiting less aggregated data we show the successive levels of analysis – aggregate towards less aggregate – using the seven trusts mentioned previously. The cases of Birmingham Heartlands & Solihull and Royal Free, Hampstead, which as illustrated in figure 5 behave quite differently, are analysed in more detail in the main text. Selected survival and hazard curves of the rest trusts are presented at appendix I. Figures 8 and 9 show the survival and hazard curves of overall waiting times for elective surgery for Birmingham Heartlands & Solihull. For 2001/2, at time 0, all patients are on the list, at around 2 months (57 days) 50% of them have been moved from the list to be treated and at around 4.5 months (143 days) the proportion increases to 75%. The same pattern characterises the waiting time distribution of elective patients for 2002/3. Hazard curves reveal notable peaks at a little more than 15 months for 2001/2 and 12 months for 2002/3. It is obvious that this trust attempts to adjust to national targets by changing the probability of moving patients from lists for admission. What is not obvious, though, is whether it maintains the same behaviour for all specialties and different operative procedures.. 14.
(17) Figure 8: Survival curves of overall waiting times for Birmingham. 0.00. 0.25. 0.50. 0.75. 1.00. 2001/2. 91. 182. 273. 365. 456. 547. 638. 730. 547. 638. 730. waiting time (days). 0.00. 0.25. 0.50. 0.75. 1.00. 2002/3. 91. 182. 273. 365. 456. waiting time (days). 15.
(18) Figure 9: Hazard rates of overall waiting times for Birmingham Prevailing target – 15 months. 0. .005. .01 .015. .02 .025. .03 .035. .04 .045. .05. 2001/2. 91. 182. 273. 365. 456. 547. 638. 730. 638. 730. waiting time Prevailing target – 12 months. 0. .005. .01 .015. .02 .025. .03 .035. .04 .045. .05. 2002/3. 91. 182. 273. 365. waiting time. 16. 456. 547.
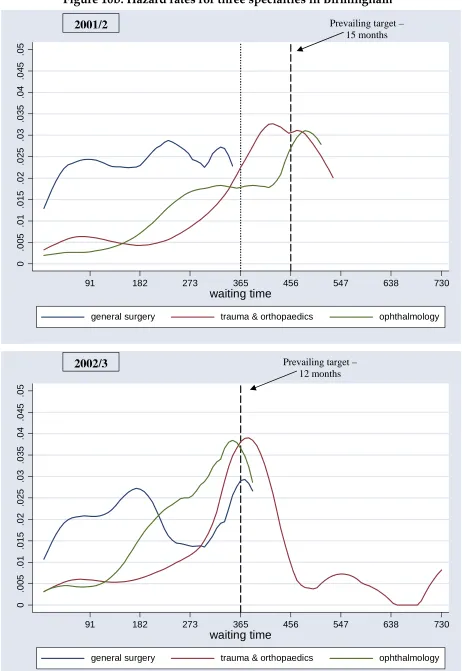
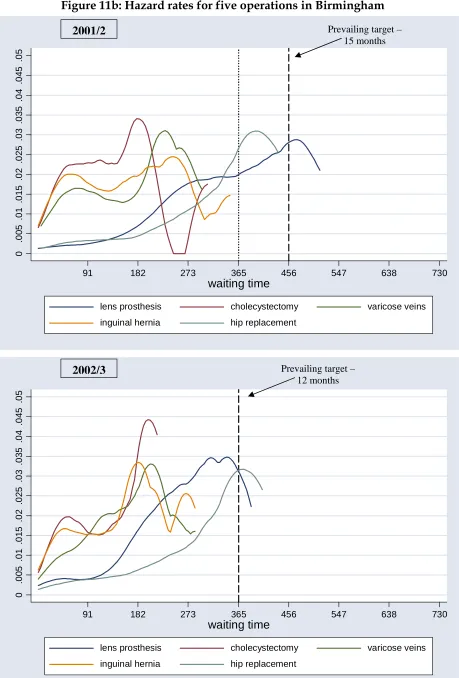
(19) Analysis at the level of specialty and type of operation illustrates variability in trust responses (figures 10 and 11). Figure 10 demonstrates the estimated survival and hazard functions by different specialties for both financial years. In particular, patients waiting for general surgery tend to wait shorter periods than patients scheduled for orthopaedic or ophthalmologic procedures. According to 2001/2 survival curve, 50% of patients are moved off the general surgery list at around 1 month (34 days), the orthopaedic list at 4 months (111 days) and the ophthalmologic list at 6.5 months (194 days). At around 8 months the survival curves of the last two specialties intersect. Similar results are observed for the subsequent year, yet the difference between orthopaedic and ophthalmologic specialties diminishes. In addition, the probability of admission does not remain constant and exhibits different patterns for each specialty. For general surgery, increased waiting list activity is observed as peaks in the curve for people waiting 3, 8 and 11 months for 2001/2 and 2, 6, and 12 months for 2002/3; for orthopaedic surgeries, between 12 to 15 months for 2001/2 and at 12 months for 2002/3; for ophthalmology around 15 months for 2001/2 and a little less 12 months for 2002/3. Two insights can be drawn from this figure. Firstly, it is clear that the trust does not adopt the same behaviour in managing different surgical lists; general surgery waiting lists follow a very different pattern than the other two specialties. Secondly, it shows the effects of waiting times targets; the probability of admission for those whose wait approaches a target increases and falls when their wait exceeds the target. Figure 11 shows the estimated survival and hazard functions by different operative procedures for Birmingham Heartlands & Solihull during 2001/2 and 2002/3. The shorter waiting times are for cholecystectomy, inguinal hernia and varicose vein procedures and the longest for lens prosthesis and hip replacement. Furthermore, it is worth emphasising that the three general surgical waiting lists do not consist of patients waiting more that 1 year, while lens prosthesis and hip replacement do. The hazard curve for 2001/2 reveals the following patterns: for cholecystectomy, peaks are at 2 and 6 months, for inguinal hernia at 2 and 8 months, for varicose vein at 2 and 7 months, for lens prosthesis at almost 15 months and for hip replacement at between 12 and 15 months. The hazard curve for 2002/3 demonstrates that as the targets become tougher, the peaks change towards the lower waiting times. A peak at exactly 12 months, which is the target of that year, is observed for hip replacements and a little less than 12 months characterises lens prosthesis.. 17.
(20) Figure 10a: Survival curves for three specialties in Birmingham. 0.00. 0.25. 0.50. 0.75. 1.00. 2001/2. 91. 182. 273. 365. 456. 547. 638. 730. waiting time (days) general surgery. trauma & orthopaedics. ophthalmology. 0.00. 0.25. 0.50. 0.75. 1.00. 2002/3. 91. 182. 273. 365. 456. 547. 638. 730. waiting time (days) general surgery. trauma & orthopaedics. 18. ophthalmology.
(21) Figure 10b: Hazard rates for three specialties in Birmingham Prevailing target – 15 months. 0. .005 .01 .015 .02 .025 .03 .035 .04 .045 .05. 2001/2. 91. 182. 273. 365. 456. 547. 638. 730. waiting time general surgery. trauma & orthopaedics. ophthalmology. Prevailing target – 12 months. 0. .005 .01 .015 .02 .025 .03 .035 .04 .045 .05. 2002/3. 91. 182. 273. 365. 456. 547. 638. 730. waiting time general surgery. trauma & orthopaedics. 19. ophthalmology.
(22) Figure 11a: Survival curves for five operations in Birmingham. 0.00. 0.25. 0.50. 0.75. 1.00. 2001/2. 91. 182. 273. 365. 456. 547. 638. 730. waiting time (days) lens prosthesis. cholecystectomy. inguinal hernia. hip replacement. varicose veins. 0.00. 0.25. 0.50. 0.75. 1.00. 2002/3. 91. 182. 273. 365. 456. 547. 638. waiting time (days) lens prosthesis. cholecystectomy. inguinal hernia. hip replacement. 20. varicose veins. 730.
(23) Figure 11b: Hazard rates for five operations in Birmingham Prevailing target – 15 months. 0 .005 .01 .015 .02 .025 .03 .035 .04 .045 .05. 2001/2. 91. 182. 273. 365. 456. 547. 638. 730. waiting time lens prosthesis. cholecystectomy. inguinal hernia. hip replacement. varicose veins. Prevailing target – 12 months. 0 .005 .01 .015 .02 .025 .03 .035 .04 .045 .05. 2002/3. 91. 182. 273. 365. 456. 547. 638. waiting time lens prosthesis. cholecystectomy. inguinal hernia. hip replacement. 21. varicose veins. 730.
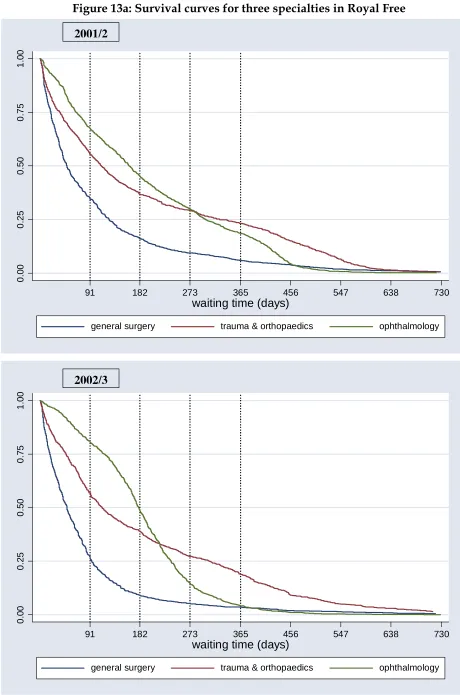
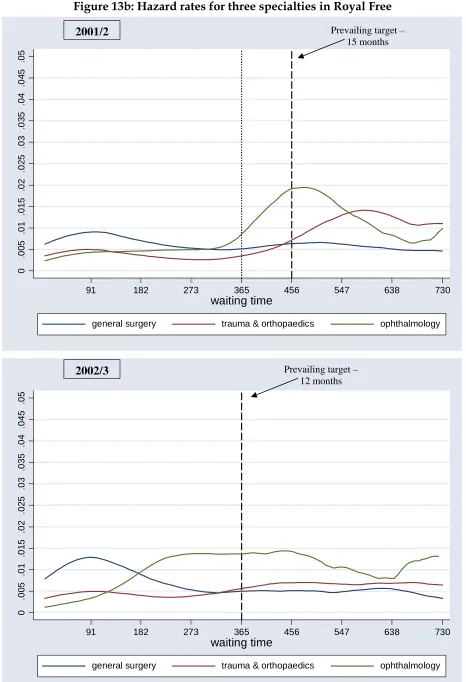
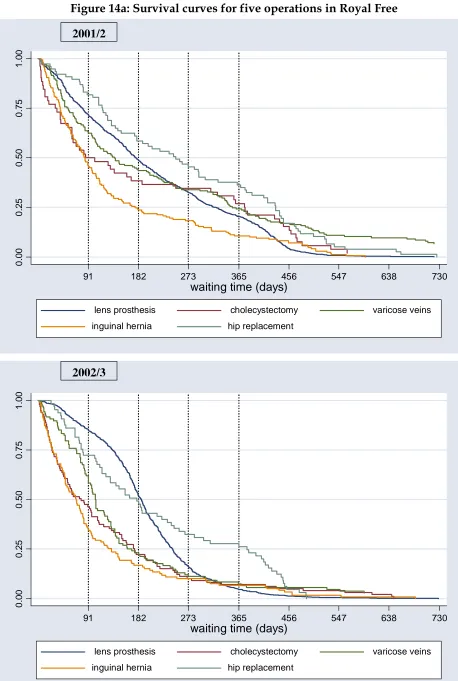
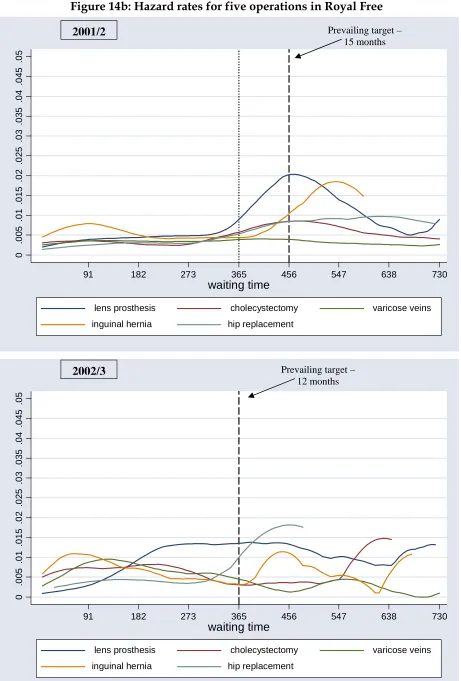
(24) Birmingham Heartlands & Solihull exhibits great management activity to tackle excessive waiting times for its patients. Quite different behavioural responses are observed by the Royal Free Hampstead trust in London. Analysis of the overall waiting times of the trust reveals that Royal Free patients have to wait a little longer for treatment as the rate of admission over time changes slower (figure 12). But, more importantly, the hazard rates do not change substantially, for 2001/2 there is only a very small peak at around 17 months while for the following year there is no peak at all. The probability of admission for elective surgery is constant, independent of the time patients spent on waiting lists. According to official returns of waiting lists for elective surgery (Department of Health Hospital Waiting Times/List Statistics) Birmingham Heartlands & Solihull had achieved the national waiting time targets for 2001/02, while Royal Free had not. One limitation of the official waiting list statistics of that year was that broad time intervals of waiting were used (eg. patients waiting for 12-17 months). Thus, we cannot calculate exactly the number of people waiting more than 15 months. However, none of their patients had to wait more than 12 months at the end of 2003, thus they both achieved the waiting time target for the next year. Conversely, based on NHS performance ratings, both trusts had no inpatients waiting longer than the standards for both years tested (Department of Health, NHS Performance Ratings 2001/02, 2002/03). Yet, less aggregated analysis at the level of three specialties suggests that probability of admission is constant only for general surgeries for 2001/2 and orthopaedic procedures for 2002/3 (figure 13). The other specialties follow different patterns with the presence of specific peaks. At the less aggregated level of waiting lists for different operations, the image is much clearer (figure 14). For 2001/2, varicose vein procedures have constant hazard rates, cholecystectomy is characterized by a very wide peak at 15 months, the hip replacement hazard curve is positively sloped but with a very small slope; on the contrary, lens prosthesis exhibits increased admission activity for people waiting 15 months and inguinal hernia for 18 months. For 2002/3, with the exception of hip replacement and inguinal hernia (peaks at around 15 months) the hazard rates of all other procedures are represented by almost flat lines.. 22.
(25) Figure 12a: Survival curves of overall waiting times for Royal Free. 0.00. 0.25. 0.50. 0.75. 1.00. 2001/2. 91. 182. 273. 365. 456. 547. 638. 730. 547. 638. 730. waiting time (days). 0.00. 0.25. 0.50. 0.75. 1.00. 2002/3. 91. 182. 273. 365. 456. waiting time (days). 23.
(26) Figure 12b: Hazard rates of overall waiting times for Royal Free Prevailing target – 15 months. 0. .005. .01 .015. .02 .025. .03 .035. .04 .045. .05. 2001/2. 91. 182. 273. 365. 456. 547. 638. 730. 638. 730. waiting time Prevailing target – 12 months. 0. .005. .01 .015. .02 .025. .03 .035. .04 .045. .05. 2002/3. 91. 182. 273. 365. waiting time. 24. 456. 547.
(27) Figure 13a: Survival curves for three specialties in Royal Free. 0.00. 0.25. 0.50. 0.75. 1.00. 2001/2. 91. 182. 273. 365. 456. 547. 638. 730. waiting time (days) general surgery. trauma & orthopaedics. ophthalmology. 0.00. 0.25. 0.50. 0.75. 1.00. 2002/3. 91. 182. 273. 365. 456. 547. 638. 730. waiting time (days) general surgery. trauma & orthopaedics. 25. ophthalmology.
(28) Figure 13b: Hazard rates for three specialties in Royal Free Prevailing target – 15 months. 0. .005 .01 .015 .02 .025 .03 .035 .04 .045 .05. 2001/2. 91. 182. 273. 365. 456. 547. 638. 730. waiting time general surgery. trauma & orthopaedics. ophthalmology. Prevailing target – 12 months. 0. .005 .01 .015 .02 .025 .03 .035 .04 .045 .05. 2002/3. 91. 182. 273. 365. 456. 547. 638. 730. waiting time general surgery. trauma & orthopaedics. 26. ophthalmology.
(29) Figure 14a: Survival curves for five operations in Royal Free. 0.00. 0.25. 0.50. 0.75. 1.00. 2001/2. 91. 182. 273. 365. 456. 547. 638. 730. waiting time (days) lens prosthesis. cholecystectomy. inguinal hernia. hip replacement. varicose veins. 0.00. 0.25. 0.50. 0.75. 1.00. 2002/3. 91. 182. 273. 365. 456. 547. 638. waiting time (days) lens prosthesis. cholecystectomy. inguinal hernia. hip replacement. 27. varicose veins. 730.
(30) Figure 14b: Hazard rates for five operations in Royal Free Prevailing target – 15 months. 0 .005 .01 .015 .02 .025 .03 .035 .04 .045 .05. 2001/2. 91. 182. 273. 365. 456. 547. 638. 730. waiting time lens prosthesis. cholecystectomy. inguinal hernia. hip replacement. varicose veins. Prevailing target – 12 months. 0 .005 .01 .015 .02 .025 .03 .035 .04 .045 .05. 2002/3. 91. 182. 273. 365. 456. 547. 638. waiting time lens prosthesis. cholecystectomy. inguinal hernia. hip replacement. 28. varicose veins. 730.
(31) The other five NHS trusts adopt different behavioral responses to meet the 15 month target for 2001/2 and the 12 month target for 2002/3. Some of the estimated survival and hazard functions by overall waiting time, by specialty and different operative procedures during 2001/2 and 2002/3 are illustrated in appendix I. Moreover, the proportion of patients leaving the list for admission with respect to the time they had to wait is displayed in table 1. Generally, Southampton, Guys and Manchester trusts have the longest waiting lists, followed by Royal Free and Nottingham whose patients have to wait moderate time periods to be treated. Birmingham and Newcastle providers perform the best of all seven trusts as their waiting times as a whole, by different specialty and by the majority of the operations tested are the shortest. Although the majority of providers manage more effectively their waiting lists during the second financial year, not all of them show signs of improvement; for example, lens prosthesis waiting lists for Manchester increased during 2002/3. We also observe providers to be offering improved surgical treatment in terms of waiting for some operative procedures and not for others. Guys hospital falls in that category; for example, the rate at which patients leave the lens prosthesis waiting list for treatment is quicker for 2002/3 than the previous year, but the exact opposite effect characterises the waiting times distribution of cholecystectomy. Clearly, in addition to some universal management tactics to reduce waiting times for elective surgery, trusts also develop appropriate measures to deal with the separate surgical waiting lists. Besides the importance of other factors such as the natural history of each disease and its clinical evolution and severity, this behavioural response by trusts might explain part of the waiting times variations. Differences among trusts reflect the level and type of activity employed by them at any given time. Some providers exhibit greater activity to tackle the excessive waits of their patients and offer better quality health care than others (e.g. the cases of Birmingham and Newcastle trusts). Some manage only the longest waiters while others appear to tackle the whole spectrum of the waiting times distribution. Although not commonly seen, there are trusts in which the probability of admission remains constant with respect to the time period patients spent on lists (e.g. the case of Royal Free).. 29.
(32) Table 1: Proportions of patients leaving lists for admission with respect to the time they already had to wait 2001/02 overall waiting (days) Proportion of patients leaving list trust Royal Free Nottingham Southampto n Guys Birmingham Newcastle Manchester. by specialty (waiting times, days) general surgery. orthopaedics. by operation (waiting times, days). ophthalmology. lens prosthesis. cholechystectom y. varicose vein. inguinal hernia. hip replacement. 50%. 75%. 50 %. 75 %. 50%. 75%. 50%. 75%. 50%. 75%. 50%. 75%. 50%. 75%. 50%. 75%. 50%. 75%. 90 94 144. 217 247 236. 49 61 71. 126 142 174. 112 112 218. 327 235 433. 162 134 167. 301 282 200. 178 263 180. 323 312 203. 103 162 156. 376 315 365. 139 109 352. 353 204 412. 85 132 137. 176 238 236. 250 286 479. 432 397 507. 149 57 75 130. 308 143 125 266. 158 34 24 62. 414 63 62 163. 163 111 140. 311 259 416. 137 194 89 174. 220 253 134 274. 150 205 91 212. 218 256 128 293. 123 47 109 152. 221 73 193 409. 322 55 369. 359 95 452. 222 46 69 127. 474 77 128 405. 244 213 250. 470 287 519. 2002/03 overall waiting (days) Proportion of patients leaving list trust Royal Free Nottingham Southampto n Guys Birmingham Newcastle Manchester. by specialty (waiting times, days) general surgery. orthopaedics. by operation (waiting times, days). ophthalmology. lens prosthesis. cholechystectom y. varicose vein. inguinal hernia. hip replacement. 50%. 75%. 50 %. 75 %. 50%. 75%. 50%. 75%. 50%. 75%. 50%. 75%. 50%. 75%. 50%. 75%. 50%. 75%. 97 101 155. 201 228 267. 49 72 68. 94 174 202. 113 130 220. 308 270 382. 180 106 188. 239 228 243. 188 205 217. 244 246 250. 78 231 161. 175 335 336. 105 96 375. 170 142 421. 69 125 151. 133 253 244. 179 236 298. 380 342 404. 126 65 73 135. 283 153 120 311. 161 40 22 86. 330 71 64 257. 183 119 137. 324 234 321. 75 144 87 171. 150 198 131 321. 67 153 87 275. 120 201 123 349. 213 49 87 157. 347 79 123 324. 144 72 297. 204 117 357. 262 47 96 173. 354 94 187 328. 229 181 278. 366 262 413. 30.
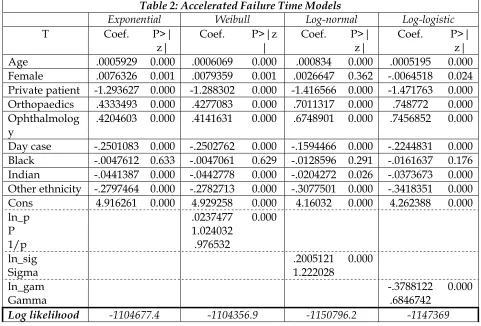
(33) Survival analysis with covariates For the AFT models, the dependent variable is waiting time until admission; for the PH models it is the hazard rate. For both models, the independent variables are Age, which was calculated as age minus 50, the average for the sample, and a series of dummy variables representing sex, admission category, main specialty, patient classification and ethnicity. This defines a “reference group” of people that are male, 50 years old, NHS patients, admitted in general surgery, admitted to inpatients and white. The dummy variables are therefore Female; Private patient; Orthopaedics; Ophthalmology; Day case; Black; Indian; and Other ethnicity,. T Age Female Private patient Orthopaedics Ophthalmolog y Day case Black Indian Other ethnicity Cons ln_p P 1/p ln_sig Sigma ln_gam Gamma Log likelihood. Table 2: Accelerated Failure Time Models Exponential Weibull Log-normal Coef. P>| Coef. P>|z Coef. P>| z| | z| .0005929 0.000 .0006069 0.000 .000834 0.000 .0076326 0.001 .0079359 0.001 .0026647 0.362 -1.293627 0.000 -1.288302 0.000 -1.416566 0.000 .4333493 0.000 .4277083 0.000 .7011317 0.000 .4204603 0.000 .4141631 0.000 .6748901 0.000. Log-logistic Coef. P>| z| .0005195 0.000 -.0064518 0.024 -1.471763 0.000 .748772 0.000 .7456852 0.000. -.2501083 -.0047612 -.0441387 -.2797464 4.916261. -.2244831 -.0161637 -.0373673 -.3418351 4.262388. 0.000 0.633 0.000 0.000 0.000. -1104677.4. -.2502762 -.0047061 -.0442778 -.2782713 4.929258 .0237477 1.024032 .976532. 0.000 0.629 0.000 0.000 0.000 0.000. -1104356.9. -.1594466 -.0128596 -.0204272 -.3077501 4.16032. 0.000 0.291 0.026 0.000 0.000. .2005121 1.222028. 0.000. -1150796.2. 0.000 0.176 0.000 0.000 0.000. -.3788122 0.000 .6846742 -1147369. Table 2 shows the results using four different AFT models. In interpreting these, it should be noted that the very large sample size means that the statistical significance of a variable’s coefficient is a poor guide to its practical significance. The only coefficients that are not statistically significant are those for the black ethnic group, in all specifications, and for females in the AFT Log-normal specification. The models as a whole are also statistically significant with high log-likelihood values. Because the models produce similar results, we will discuss only the AFTExponential model. The antilog of the constant term is the average waiting time for the reference group as defined above, ie: e 4.91 = 136.5 days. Although age has a significant coefficient, this translates into an increase of less than one day’s waiting time for a one-year increase in age, other things being equal. The changes in waiting times due to being female or Indian are also less than one day. Such differences are obviously of no account, but other findings are of more interest. Other things being 31.
(34) equal, private patients wait on average 99 fewer days; Orthopaedic and Ophthalmology patients wait on average 74 and 71 more days; day case patients wait on average 39 fewer days; “Other” ethnic groups wait on average 44 fewer days.. Table 3: Proportional Hazard Models Cox Exponential Weibull Gompertz t Haz. Ratio P>|z| Haz. Ratio P>|z| Haz. Ratio P>|z| Haz. Ratio Age .9994073 0.000 .9993787 0.000 .9993014 0.000 .9992734 Female .9923965 0.001 .9919063 0.001 .9911281 0.000 .9875895 Private patient 3.645988 0.000 3.74066 0.000 3.751843 0.000 3.594825 Orthopaedics .648334 0.000 .6453342 0.000 .6463513 0.000 .6437025 Ophthalmology .6567444 0.000 .6543478 0.000 .6590856 0.000 .6672428 Day case 1.284164 0.000 1.292128 0.000 1.297126 0.000 1.319649 Black 1.004773 0.633 1.004831 0.629 1.005844 0.559 .9981193 Indian 1.045127 0.000 1.046385 0.000 1.048196 0.000 1.044269 Other ethnicity 1.322794 0.000 1.329707 0.000 1.328031 0.000 1.339732 ln_p .0237477 0.000 p 1.024032 1/p .976532 gamma .0003357 0.000 Log likelihood -1104677.4 -1104356.9 -1103564.3. P>|z| 0.000 0.001 0.000 0.000 0.000 0.000 0.850 0.000 0.000. Table 3 shows the results from the PH models. All covariates are again statistically significant apart from the black ethnic group. The results from the parametric models are consistent statistically, functionally and quantitatively with those from the Cox regression. Overall, there is very little to choose between these models, so the results presented above concerning the impact of the independent variables may be taken as representative. Some variables have no real impact on waiting times, such as age and sex; however, some, such as whether the patient is NHS or private, have an impact on waiting times that is significant in both statistical and practical terms.. Discussion This study analysed waiting time data in a number of ways which suggest the potential usefulness of time-to-event analysis. The first part of the analyses that we report captures the whole set of patients admissions for elective surgery from all over UK using around 2 million record level information for each financial year. The second part of the analyses examines data at less aggregated levels – at different providers by different specialties and operative procedures. From the point of view of the aims of this study, the first question was: how have behavioural responses to the targets affected the distribution of waiting times? The survival curve analysis confirmed the findings that would be possible from a simple comparison of waiting times, that more demanding targets were associated with 32.
(35) reductions in average waiting times. The value added is that the analysis showed more clearly how these reductions were achieved in terms of alterations in the shape of the waiting time distribution, rather than simply the central tendency. This finding was demonstrated more clearly by the more detailed and refined analyses of the paper. Waiting times distributions did vary at the level of each trust revealing much more details of trusts’ behavioural tactics and waiting lists management over time. The second question was: How is the probability of admission for any given waiting time affected by the targets? The hazard curve analysis casts light on two aspects of this. First, that hazard rates are in general not constant over time. The reasons for the existence of differences over time might be due, for example to the characteristics of the operation or underlying disease, for example increasing severity and urgency due to delays might lead to a simple increasing probability over time. However, the existence of peaks, where probability rises then falls, suggests that other factors are taken into account. The fact that these in many cases coincide with target waiting times suggests that waiting list management is a major factor. Secondly, the peaks do change over time in line with changes in targets. The third question was: To what extent are clinical distortions evident in the pattern of admissions? There is less evidence available on this. In general hazard rate peaks which were at or higher than target waiting times moved towards new targets over time, whilst those which were already shorter than targets did not move or in some cases appeared later in the distribution. This provides some indication that waiting list management does involve adjustment of relative priorities. The fourth question was: Can variations between individuals' waiting times be explained by clinical, patient or provider-level characteristics? These results suggest that they can, although more analyses and further data are needed to answer this properly. From an equity point of view, it is useful to know that characteristics such as age and sex do not affect waiting times in any important way, and that we can be confident about those findings because of the very large sample size. Some findings suggest that more investigation is required, for example the difference in waiting times for “Other” ethnic groups. However, some large differences are of immediate interest. Particularly interesting is the very large difference between NHS and private patients – which in this context is private patients using NHS accommodation or services – suggesting that private patients have a considerable advantage in access compared to NHS patients, even though the two groups are competing users for exactly the same facilities and services. A limitation of this study as a test of the potential advantages of time-to-event analysis is that data only included completed patient spells, with no censored observations. This is related to the way data were collected and reported by HES: Exits from the waiting list were restricted to admissions and excluded such reasons as dying, moving away, or no longer need treatment. A further limitation to the study is that some observations suggested extremely long waits, in some cases greater than three years; whilst this is possible, it is more likely to be due to 33.
(36) problems with patient record coding. We took account for such outliers by restricting analysis at waiting time up to 3 years and truncating graphs at 2 years to reveal details about the main part of the distribution, away from the long right-hand tail. Also, it is possible that Trusts may have to some extent met their targets by adjustments such as reclassifying patients that have been included on waiting lists as planned cases and reclassifying day-cases as outpatients (NAO, 2001). We have not yet explored this issue, but there is clearly potential to do so. The final question concerned the methods themselves. As stated, we believe that we have demonstrated that time-to-event analysis does in practice provide the additional insights that it promises. It should therefore be more widely applied to waiting time data. Further analysis at less aggregated levels would be particularly useful, such as by referring GP, PCT and admitting consultant. This has three potential uses. First, it may provide an additional set of variables which explain variations in the distribution of waiting times, and therefore waiting time management. Secondly, it might offer a tool by which these individuals and organisations can learn about the practical effects of their management policies. Thirdly, it might offer a tool for assessing performance, for example for hospitals in respect of consultants’ admitting behaviour and PCTs in respect of hospitals’ admitting behaviour and GPs’ referring behaviour. The policy implications of our findings are important. How physicians, consultants and managers respond to the implementation of waiting time targets is decisive for the success of policies to tackle long waiting. As noted, the observation that increased elective surgery activity for patients waiting the exact times as the prevailing targets supports the suggestion that clinical distortions might have taken place. As it is inappropriate to concentrate on less urgent routine cases in preference to those who require more urgent treatment so as to meet the targets, this phenomenon may have important clinical and policy implications. To assess the practical significance of this, it would be necessary to link the distribution of waiting times to quality of life information, such as urgency, severity of illness and rates of deterioration. In addition, future research that would relate specific HRGs with cost could establish whether there is any association between the cost of different type of surgeries and trends in waiting times of the relevant patients. Such analyses would help in deciding whether or not it is necessary to introduce a more standardised prioritisation system using explicit criteria, along the lines of the “admission index” suggested by Culyer and Cullis (1976), which could incorporate clinical, social and economic factors.. 34.
(37) References Appleby, J., Boyle, S., Devlin, N., Harley, M., Harrison, A. and Thorlby, R. (2005). ’Do English NHS waiting times targets distort treatment priorities in orthopaedics?’ JHSRP. 10: 167-72. Boyle, S. and Appleby, J. (2001). NHS activity. Short measure. Health Serv J. 11: 24-7. Collett, D. (1994). Modelling survival data in medical research. Chapman and Hall, London. Cox, D.R. and Oakes, D. (1984). Analysis of Survival Data. Chapman and Hall, London. Culyer, A.J. and Cullis, J.G. (1976). Some economics of hospital waiting lists in the NHS. Journal of Social Policy. 5(3): 239-64. Department of Health. (2000). The NHS plan: A plan for investment. A plan for reform. Cmd 4818-I. London: The Stationery Office. Department of Health Statistical Press Notice, ‘NHS waiting list figures to 30 September 2004’. http://www.dh.gov.uk/assetRoot/04/09/44/41/04094441.pdf. Department of Health. NHS Performance Ratings. Acute Trusts, Specialist Trusts, Ambulance Trusts, Mental Health Trusts 2001/02. Department of Health. NHS Performance Ratings. Acute Trusts, Specialist Trusts, Ambulance Trusts, Mental Health Trusts 2002/03. Department of Health. Hospital Waiting Times/List Statistics. http://www.performance.doh.gov.uk/waitingtimes/index.htm Gravelle, H., Smith, P. and Xavier, A. (2003). Performance signals in the public sector: the case of health care. Oxford Economic Papers, 55: 81-103. Hadorn, D.C. and Holmes, A.C. (1997). The New Zealand priority criteria project. Part 1: Overview. BMJ. 314: 131. Hamblin, R., Harrison, A. and Boyle, S. (1998). Waiting lists. The wrong target. Health Serv J. 108: 28-31. Harrison, A. and Appleby, J. (2005). The war on waiting for hospital treatment – what has labour achieved and what challenges remain? King’s Fund, London. NAO Inpatient and Outpatient waiting in the NHS. Report by the Comptoller and Auditor General. HC 221 Session 2001-2002: 26 July 2001. National Audit Office: TSO, London. Siciliani, L. and Hurst, J. (2003). Explaining waiting times variations for elective surgery across OECD countries, OECD health working papers no.7. 35.
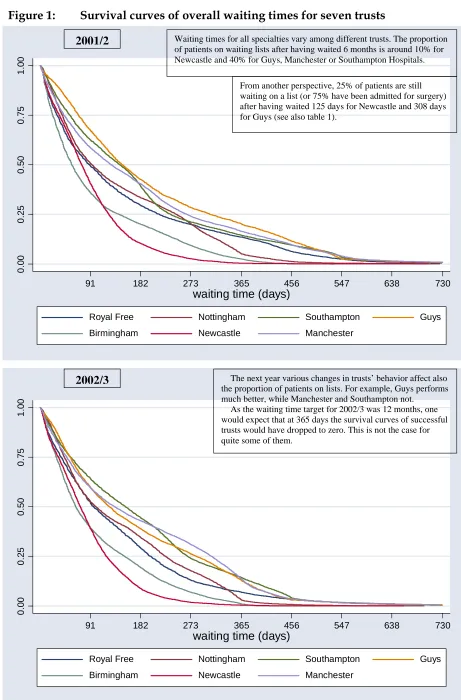
(38) Appendix I Figure 1:. Survival curves of overall waiting times for seven trusts Waiting times for all specialties vary among different trusts. The proportion of patients on waiting lists after having waited 6 months is around 10% for Newcastle and 40% for Guys, Manchester or Southampton Hospitals.. 1.00. 2001/2. 0.00. 0.25. 0.50. 0.75. From another perspective, 25% of patients are still waiting on a list (or 75% have been admitted for surgery) after having waited 125 days for Newcastle and 308 days for Guys (see also table 1).. 91. 182. 273. 365. 456. 547. 638. 730. waiting time (days) Royal Free. Nottingham. Southampton. Birmingham. Newcastle. Manchester. Guys. The next year various changes in trusts’ behavior affect also the proportion of patients on lists. For example, Guys performs much better, while Manchester and Southampton not. As the waiting time target for 2002/3 was 12 months, one would expect that at 365 days the survival curves of successful trusts would have dropped to zero. This is not the case for quite some of them.. 0.00. 0.25. 0.50. 0.75. 1.00. 2002/3. 91. 182. 273. 365. 456. 547. 638. 730. waiting time (days) Royal Free. Nottingham. Southampton. Birmingham. Newcastle. Manchester. 36. Guys.
(39) Figure 2:. Two quite different behaviour responses by Guys and Manchester Trusts Survival curves reveal various trends in waiting times distributions of each specialty. But they can even inform us about the trust’s tactic for all of them. Although the 3 lines are exactly the same at the beginning, they then become parallel to each other until they drop to zero at the same point in time. This seems like a universal behavior of Guys for all 3 specialties, but at the same time informs us that it gives priority to ophthalmologic patients than orthopaedic ones or those scheduled for general surgery.. 0.00. 0.25. 0.50. 0.75. 1.00. 2001/2. 91. 182. 273. 365. 456. 547. 638. 730. waiting time (days) general surgery. trauma & orthopaedics. ophthalmology. A different pattern of admissions is observed for Manchester Hospital. General surgeries are conducted quicker than the other 2 specialties. 25% of patients are still waiting after having waited 163 days for general surgeries, 274 days for ophthalmologic procedures and 416 days for an orthopaedic operation. The KM curves of orthopaedic and ophthalmologic cross a little after 6 months; before that point orthopaedic procedures are conducted quicker while after that point they are conducted much slower than ophthalmologic ones.. 0.00. 0.25. 0.50. 0.75. 1.00. 2001/2. 91. 182. 273. 365. 456. 547. 638. 730. waiting time (days) general surgery. trauma & orthopaedics. 37. ophthalmology.
(40) Figure 3:. KM curves for three specialties in Guys and Manchester for the next financial year Guys Hospital has put much effort in ameliorating the waiting times of ophthalmologic procedures. The survival curves of the other two specialties are more or less the same as for 2001/2.. Guys. 0.00. 0.25. 0.50. 0.75. 1.00. 2002/3. 91. 182. 273. 365. 456. 547. 638. 730. waiting time (days) general surgery. ophthalmology. An extraordinary change of tactics by Manchester Trust. This financial year, they aim at employing a universal pattern of admissions for all specialties. To achieve that, admissions for general surgeries are decelerated. The other 2 specialties behave similarly; only the point where they crossed moves to around 11 months.. Manchester. 0.00. 0.25. 0.50. 0.75. 1.00. 2002/3. trauma & orthopaedics. 91. 182. 273. 365. 456. 547. 638. 730. waiting time (days) general surgery. trauma & orthopaedics. 38. ophthalmology.
(41) Figure 4:. Shift of hazard curve’s peaks towards shorter targets in Guys Prevailing target – 15 months. All 3 specialties follow similar patterns of admissions. The probability of being admitted for an elective procedure increases at around 547 days (18 months).. 0. .005 .01 .015 .02 .025 .03 .035 .04 .045 .05. 2001/2. 91. 182. 273. 365. 456. 547. 638. 730. waiting time general surgery. trauma & orthopaedics. Prevailing target – 12 months. 2002/3 An interesting shift of the 3 peaks towards shorter waiting times takes place for 2002/3 (approaching the year’s target at 365 days). Ophthalmologic procedures also exhibit an earlier peak at around 3 months.. 0. .005 .01 .015 .02 .025 .03 .035 .04 .045 .05. ophthalmology. 91. 182. 273. 365. 456. 547. 638. 730. waiting time general surgery. trauma & orthopaedics. 39. ophthalmology.
(42) Figure 5:. Hazard rates for three specialties in Manchester Prevailing target – 15 months. All specialties exhibit the exact same peak at 18 months for 2001/2.. 0. .005 .01 .015 .02 .025 .03 .035 .04 .045 .05. 2001/2. 91. 182. 273. 365. 456. 547. 638. 730. waiting time general surgery. trauma & orthopaedics. Prevailing target – 12 months. 2002/3 Increased probability of admission for 2002/3 is very close to 12 months. All curves follow the same pattern. Clearly, the establishment of national waiting time targets puts pressure to providers to achieve them. When a patient’s wait approaches the corresponding target (12 months) he has an increased probability to be admitted for surgery in Manchester Hospital.. 0. .005 .01 .015 .02 .025 .03 .035 .04 .045 .05. ophthalmology. 91. 182. 273. 365. 456. 547. 638. 730. waiting time general surgery. trauma & orthopaedics. 40. ophthalmology.
(43) Figure 6:. The KM curves for three specialties in Newcastle are almost identical for both years As illustrated in the graph, general surgery has shorter waiting times than ophthalmology. Orthopaedic operations are not conducted in that trust. At around 7 months the KM curves cross and ophthalmologic patients are treated quicker. Interestingly, there is nobody on the list waiting for an ophthalmologic procedure more than 16 months for 2001/2 and 13 months for 2002/3. On the contrary, there are some general patients with really long waiting times (>638 days-21 months).. 0.00. 0.25. 0.50. 0.75. 1.00. 2001/2. 91. 182. 273. 365. 456. 547. 638. 730. waiting time (days) general surgery. ophthalmology. The proportion of patients waiting for general surgeries and ophthalmologic procedures changes by the same rate for both financial years (the KM curves are almost identical to each other). This is also shown in table 1:. 1.00. 2001/2. 0.75. general surgery: 25%: 24 days (2001/2), 22 days (2002/3), 75%: 62 days (2001/2), 64 days (2002/3). 0.00. 0.25. 0.50. ophthalmologic surgery: 25%: 89 days (2001/2), 87 days (2002/3) 75%: 134 days (2001/2), 131 days (2002/3). 91. 182. 273. 365. 456. 547. waiting time (days) general surgery. 41. ophthalmology. 638. 730.
(44) Figure 7:. Hazard rates for three specialties in Newcastle Prevailing target – 15 months. .005 .01 .015 .02 .025 .03 .035 .04 .045 .05. 2001/2. 0. Although the KM curves were identical for both years the hazard curves are different. Regarding the specialty with shorter waiting times (general surgery), patients are admitted with a greater probability when they have waited around 2 months, 1 year and 22 months (3 peaks). The target of 456 (15 months) of this year does not affect the behavior of the trust. For ophthalmologic procedures an increase probability of admissions is observed at 1 year.. 91. 182. 273. 365. 456. 547. 638. 730. waiting time general surgery. ophthalmology. Prevailing target – 12 months. .005 .01 .015 .02 .025 .03 .035 .04 .045 .05. 2002/3. 0. The 3 peaks of general surgery become 2: an early one (short waiters) and a later one (1 year) which coincides with the target of that year. Regarding ophthalmology, as there is no patient on the list that waits more than 13 months the probability of admissions for these last ones is increasing.. 91. 182. 273. 365. 456. 547. waiting time general surgery. 42. ophthalmology. 638. 730.
(45) Figure 8:. Moving towards a less aggregated analysis in Nottingham-Is it informative? Patients waiting for general surgery are removed quicker from lists. Ophthalmology and orthopaedics curves intersect 2 times: for patients waiting up to 3 months ophthalmologic procedures are quicker, for waits 3 to 10.5 months orthopaedic patients are admitted quicker and the setting is reversed again for those waiting more than 10.5 months.. 0.00. 0.25. 0.50. 0.75. 1.00. 2001/2. 91. 182. 273. 365. 456. 547. 638. 730. waiting time (days) general surgery. trauma & orthopaedics. ophthalmology. Varicose vein, inguinal hernia and cholecystectomy follow the pattern of the overall KM curve of general surgery and have shorter waits for their patients. However, their KM curves are shifted to the right compared to the aggregated one. Furthermore, there are differences among them: eg cholecystectomy performs much worse than the other 2. Similar remarks can be extracted for the KM curves of lens prosthesis and hip replacement.. 0.00. 0.25. 0.50. 0.75. 1.00. 2001/2. 91. 182. 273. 365. 456. 547. 638. waiting time (days) lens prosthesis. cholecystectomy. inguinal hernia. hip replacement. 43. varicose veins. 730.
(46) Figure 9:. Survival curves by specialty and by operation in Nottingham (2002/3) 2002/3. 0.00. 0.25. 0.50. 0.75. 1.00. For 2002/3, although waiting for general surgery is better than the other 2 specialties, it is worse comparable with the previous year. The trust decided to put pressure in lowering waiting times for ophthalmologic procedures for the whole range of patients waits. Finally, a very small proportion of elective patients waits more than 1 year.. 91. 182. 273. 365. 456. 547. 638. 730. waiting time (days) general surgery. trauma & orthopaedics. ophthalmology. The pressure in lowering waiting times for ophthalmologic procedures is reflected in the KM curve of lens prosthesis, which moves to the left. Cholecystectomy does not perform so well and clearly does not follow the same pattern of the overall KM curve for general surgeries.. 0.00. 0.25. 0.50. 0.75. 1.00. 2002/3. 91. 182. 273. 365. 456. 547. 638. waiting time (days) lens prosthesis. cholecystectomy. inguinal hernia. hip replacement. 44. varicose veins. 730.
(47) Figure 10:. Hazard rates for three specialties in Nottingham Prevailing target – 15 months. Only the peak of orthopaedic procedures is exactly at the target of 15 months of this year. The peaks of the other 2 specialties are at 12 months, with the one of ophthalmologic procedures of bigger magnitude. It is like the trust is trying harder to ameliorate waiting times for the latter specialty; this is in concordance with the KM curve of the same year where the proportion of patients on lists is bigger for ophthalmologic patients compared to general surgery patients.. 0. .005 .01 .015 .02 .025 .03 .035 .04 .045 .05. 2001/2. 91. 182. 273. 365. 456. 547. 638. 730. waiting time general surgery. trauma & orthopaedics. ophthalmology. Prevailing target – 12 months. .005 .01 .015 .02 .025 .03 .035 .04 .045 .05. 2002/3. 0. In 2002/3, as targets become tougher, trusts behave accordingly. It is quite characteristic that all 3 specialties have peaks exactly at the new target (12 months); of course, this behavior is not of the same magnitude among them.. 91. 182. 273. 365. 456. 547. 638. 730. waiting time general surgery. trauma & orthopaedics. 45. ophthalmology.
(48) Figure 11:. Hazard rates for five operations in Nottingham Prevailing target – 15 months. 0 .005 .01 .015 .02 .025 .03 .035 .04 .045 .05. 2001/2 Hip replacements exhibit a peak at 15 months which is the target of that year. The other operations either follow the pattern of their overall specialty (eg lens prosthesis) or diverge a little (inguinal hernia).. 91. 182. 273. 365. 456. 547. 638. 730. waiting time lens prosthesis. cholecystectomy. inguinal hernia. hip replacement. Prevailing target – 12 months. 2002/3 0 .005 .01 .015 .02 .025 .03 .035 .04 .045 .05. varicose veins. Increased probability for admission for all operative procedures is taking place at 12 months, which is the target of that year.. 91. 182. 273. 365. 456. 547. 638. waiting time lens prosthesis. cholecystectomy. inguinal hernia. hip replacement. 46. varicose veins. 730.
(49) Figure 12:. Moving towards a less aggregated analysis in Southampton-Is it informative? A significantly different pattern of admissions is observed by Southampton. First, the specialty with the longest waits is orthopaedics. It is worth noticing that the KM curve is almost a straight line. Second, general surgery performs better compared to ophthalmology only for patients waiting up to 7 months. In the contrary, for patients’ waits longer than 7 months, ophthalmologic patients wait less than general surgery patients.. 0.00. 0.25. 0.50. 0.75. 1.00. 2001/2. 91. 182. 273. 365. 456. 547. 638. 730. waiting time (days) general surgery. trauma & orthopaedics. ophthalmology. At around 1 year, only 50%of patients waiting for varicose vein surgery have been admitted to hospital. The KM curve of this operative procedure differs than the one of overall general surgery. Another example of great divergence from the aggregated curve is hip replacement operations.. 0.00. 0.25. 0.50. 0.75. 1.00. 2001/2. 91. 182. 273. 365. 456. 547. 638. waiting time (days) lens prosthesis. cholecystectomy. inguinal hernia. hip replacement. 47. varicose veins. 730.
(50) Figure 13:. Southampton Trust does not seem to be influenced by national targets Prevailing target – 15 months. The hazard rate for general surgery is almost constant as no major peaks appear. Ophthalmologic patients are mostly admitted after having waited 7 months.. 0. .005 .01 .015 .02 .025 .03 .035 .04 .045 .05. 2001/2. 91. 182. 273. 365. 456. 547. 638. 730. waiting time general surgery. trauma & orthopaedics. Prevailing target – 15 months. 2001/2 0 .005 .01 .015 .02 .025 .03 .035 .04 .045 .05. ophthalmology. More information can be derived from this graph: inguinal hernia follows the above overall general surgery curve, cholecystectomy has a small peak at 18 months and varicose vein patients have an increased probability of admission at around 13 months. Lens prosthesis’s hazard curve matches the one of ophthalmology.. 91. 182. 273. 365. 456. 547. 638. waiting time lens prosthesis. cholecystectomy. inguinal hernia. hip replacement. 48. varicose veins. 730.
(51) Figure 14:. Survival curves by specialty and by operation in Southampton (2002/3) 2002/3. 0.00. 0.25. 0.50. 0.75. 1.00. The same pattern as the previous year is followed for 2002/3.. 91. 182. 273. 365. 456. 547. 638. 730. waiting time (days) general surgery. trauma & orthopaedics. ophthalmology. An unexpected survival curve by varicose vein operation, if one considers only the analysis by specialty. Inguinal hernia and cholecystectomy survival curves move together until the point of 7 months, where they start to deviate. Lens prosthesis follows the same pattern as the specialty of ophthalmology.. 0.00. 0.25. 0.50. 0.75. 1.00. 2002/3. 91. 182. 273. 365. 456. 547. 638. waiting time (days) lens prosthesis. cholecystectomy. inguinal hernia. hip replacement. 49. varicose veins. 730.
(52) Figure 15:. Hazard rates by specialty and by operation in Southampton (2002/3) Prevailing target – 12 months. The wide peaks of general surgery and orthopaedics move towards shorter waiting times. Ophthalmology still has a peak early in waiting times distribution.. 0. .005 .01 .015 .02 .025 .03 .035 .04 .045 .05. 2002/3. 91. 182. 273. 365. 456. 547. 638. 730. waiting time general surgery. trauma & orthopaedics. Prevailing target – 12 months. 2002/3 0 .005 .01 .015 .02 .025 .03 .035 .04 .045 .05. ophthalmology. At less aggregated level, details of each operative procedure can be revealed. In this case they follow the pattern of the overall specialties.. 91. 182. 273. 365. 456. 547. 638. waiting time lens prosthesis. cholecystectomy. inguinal hernia. hip replacement. 50. varicose veins. 730.
(53) Figure 16:. Waiting list management for five operations by Guys Varicose vein, inguinal hernia and hip replacement surgeries suffer the longest waiting times. On the other hand, the outflow of patients for lens prosthesis and cholecystectomy is faster.. 0.00. 0.25. 0.50. 0.75. 1.00. 2001/2. 91. 182. 273. 365. 456. 547. 638. 730. waiting time (days) lens prosthesis. cholecystectomy. inguinal hernia. hip replacement. varicose veins. Guys Hospital improves access for varicose vein operation by admitting patients quicker than the previous year. Better performance is also observed for lens prosthesis. Of course, the achievements mentioned were conducted at the expense of some other operations such as cholecystectomy.. 0.00. 0.25. 0.50. 0.75. 1.00. 2002/3. 91. 182. 273. 365. 456. 547. 638. waiting time (days) lens prosthesis. cholecystectomy. inguinal hernia. hip replacement. 51. varicose veins. 730.
(54) Figure 17:. Hazard rates for five operations in Guys Prevailing target – 15 months. 0 .005 .01 .015 .02 .025 .03 .035 .04 .045 .05. 2001/2 The majority of the hazard curves consist of very wide peaks such cholecystectomy (two peaks at around 3 and 17 months), inguinal hernia (18 months), varicose vein (9-15 months), lens prosthesis (6 and 15-18 months).. 91. 182. 273. 365. 456. 547. 638. 730. waiting time lens prosthesis. cholecystectomy. inguinal hernia. hip replacement. Prevailing target – 12 months. 2002/3 0 .005 .01 .015 .02 .025 .03 .035 .04 .045 .05. varicose veins. More peaks are observed this year, thus greater activity by Guys. At the same time they correspond to shorter waiting times.. 91. 182. 273. 365. 456. 547. 638. waiting time lens prosthesis. cholecystectomy. inguinal hernia. hip replacement. 52. varicose veins. 730.
Figure
+7
Related documents
University of Medical Sciences, Tehran, Iran• 3 Department of Occupational Health Engineering, School of Public Health and Safety, Shahid Beheshti University of Medical
Long term treatment with only metformin and pioglitazone and in combination with irbesartan and ramipril significantly ( P <0.001) reduced elevated serum
multirate-aware routing protocol: During the process of path discovery, the quality of wireless links is estimated to suggest optimal transmission rates, which are then used
Mon Integrated Care (Center City) Tues Traditional MH (N Knox) Wed* (July-Mar) Traditional MH (N Knox) Wed* (Apr-July) Psychosoc Rehab (5 th St) Thurs Integrated Care
Based on quality management principles Customer focused Leadership Involvement of people Process Approach System Approach Continual Improvement. Factual Approach to Decision
La formación de maestros investigadores en el campo del lenguaje y más específicamente en la adquisición de la escritura en educación ini- cial desde una perspectiva
In this PhD thesis new organic NIR materials (both π-conjugated polymers and small molecules) based on α,β-unsubstituted meso-positioning thienyl BODIPY have been
RT-qPCR analysis demon- strated that gene expression of MMP3 and MMP9 was increased following IL-1 β stimulation ( p < 0.001, Fig. 1a ), and the induction was especially
