Optimized cross-slot microdevices for homogeneous extension
Francisco J. Galindo-Rosales,
∗aM´onica S. N. Oliveira
b, and Manuel A. Alves
aMicrofluidic cross-slot devices can generate wide regions of vorticity-free strong extensional flow near the stagnation point, resulting in large extensional deformation and orientation of the microstructure of complex fluids, with possible applications in extensional rheometry and hydrodynamic stretching of single cells or molecules. Standard cross-slot devices, with sharp or rounded corners, generate a flow field with a non-homogeneous extension rate that peaks at the stagnation point, but decays significantly with distance from the stagnation point. To circumvent this limitation, an optimized shape cross-slot extensional rheometer (OSCER) was designed numerically and shown to generate constant extension rate over a wide region of the in- and out-flowing symmetry planes [Haward et al. (2012) Phys. Rev. Lett. 109, 128301]. Since the OSCER device was based on a 2D flow approximation, the practical implementation requires a large aspect ratio, which cannot be reproduced by standard soft-lithography techniques. Here, we propose a set of new designs for optimized cross-slot geometries, considering aspect ratios of order 1 and different lengths of the homogeneous inlet/outlet-flow regions. Micro-particle image velocimetry experiments were carried out in order to validate the flow kinematics, and the velocity profiles were found to be linear along the in−and outflow centrelines in good quantitative agreement with the numerical predictions.
1
Introduction
Among the microdevices that generate stagnation-point flows with strong extensional behaviour, the cross-slot device is ar-guably the configuration which has attracted most attention due to its simple geometry and easy flow control1. The stan-dard cross-slot geometry consists of two channels bisecting orthogonally and is a classical geometry for the generation of extensional flow when the opposing inlets and outlets are sup-plied with equal flow rates. In this configuration, it is possible to generate a free stagnation point at the centre of the cross, i.e. a singular point of zero flow velocity, which combined with a very large residence time and a finite velocity gradient, allows the accumulation of very high Hencky strains and large exten-sional stresses near the centre2. These features have made this flow configuration very appropriate for the analysis of elastic instabilities3–7, extensional rheometry of viscoelastic fluids1,6,8–11and for trapping molecules or cells by hydrody-namic means while subjecting them to a strong extensional deformation rate12–23.
Despite its intrinsic potential, the standard cross-slot ge-ometry is only able to generate a uniform extension rate in a short region near the stagnation point6. To circumvent this limitation and provide a geometry with homogeneous exten-sional flow along a wide region near the stagnation point,
∗Corresponding author
a Address: Centro de Estudos de Fen´omenos de Transporte (CEFT),
De-partamento de Engenharia Qu´ımica, Faculdade de Engenharia da Univer-sidade do Porto, Rua Dr. Roberto Frias s/n, 4200-465 Porto, Portugal. Fax: +352 22508 1440; Tel: +351 22508 1079; E-mail: [email protected]; [email protected]
b Address: James Weir Fluids Laboratory, Department of Mechanical and
Aerospace Engineering, University of Strathclyde, Glasgow G1 1XJ, United Kingdom.
Haward et al.24 investigated an optimized shape cross-slot
extensional rheometer (OSCER), with a geometrical shape determined using the numerical optimization scheme devel-oped by Alves25. The OSCER device requires an aspect ratio
(H/W) of order 10 or above, to generate an approximately two-dimensional (2D) flow that provides a nominally constant extension rate over a spatial domain of about 15 times the
width (W) of its arms. Precisely, because the OSCER
de-vice is based on a 2D flow approximation, when fabricated in poly(dimethylsiloxane) (PDMS) by soft lithography tech-niques that limit the aspect ratio of the channel to moderate values, the influence of the end-walls distort the flow field and the OSCER is not able to generate a uniform well-defined ex-tension rate inside the cross-chamber, preventing its use by a wider community that fabricates low aspect ratio
microchan-nels in PDMS26,27. We present here a new set of optimized
cross-slot microdevices considering aspect ratios (AR) of or-der 1, namely AR=0.5,1 and 2. Because the flow is three-dimensional in such devices, hereafter we refer to them as op-timized 3D cross-slot microchannels. These designs were fab-ricated in PDMS by replica mould technique, and the resulting hydrodynamics was validated by means of micro-particle im-age velocimetry (µPIV) experiments carried out over a wide range of Reynolds number (Re∈[10−2,102]) and compared with those obtained for the standard cross-slot and an
2
Materials and methods
2.1 Optimal shape design methodology
In this work, we used the algorithm for optimal shape design of viscoelastic fluid flow developed by Alves25, which in sum-mary consists of a combination of three major components: a fully-automated mesh generator program; a viscoelastic fluid flow solver28,29; and the CONDOR30optimizer. The method-ology aims to find the shape of a cross-slot microfluidic de-vice capable of achieving optimal performance, which corre-sponds to a prescribed objective function. We considered the goal of the optimization to search for the microfluidic device shape that generates an ideal planar extensional flow in the mid-plane with[ux,uy] = [−ε˙x,ε˙y] =2LUextc[−x,y], whereuxand
uyare thex−andy−velocity components, ˙εis the strain-rate,
Ucis the centreline fully-developed velocity at the inlet/outlet
channels, and Lext is the length, measured along the
centre-lines, where a homogeneous extensional flow with constant strain-rate is observed. Starting from an initial estimate of the design variable vector X0, which parametrizes the shape of the flow geometry, the initial mesh is generated and the CFD simulation is undertaken. From the numerical solution the ob-jective function is evaluated, and this information is sent to the optimizer (Fig.1a).
This process is repeated for a number of design variable pa-rameters, supplied by the optimizer, until the optimal shape is found. Due to the symmetry of the flow geometry, only the first quadrant of the cross-slot geometry is optimized, and the remaining walls are obtained assuming geometrical symmetry. The initial estimate used corresponds to a rounded cross-slot geometry with a characteristic radiusR. The CFD flow solver is a finite-volume code developed for simulation of laminar flows of viscoelastic fluids described by differential-type con-stitutive equations. The numerical technique is described in detail in the works of Oliveiraet al.28 and Oliveiraet al.31. The governing equations are those expressing conservation of
mass of an incompressible Newtonian fluid, ∇·u=0, and
the momentum equation, ρDDtu =−∇p+µ∇2u, with DDtu =
∂u
∂t +u·∇urepresenting the material derivative ofu,ρis the
fluid density,t is the time, pis the pressure andµis the
dy-namic viscosity of the fluid. Creeping flow (Stokes flow) con-ditions are obtained by neglecting the material derivative term in the left hand side of the previous equation.
In this work, we have optimized seven different cross-slot microchannels, based on three geometric parameters (Fig.1): the radius (R) of the rounded cross-slot geometry used as ini-tial guess, the length where an uniform extension rate (Lext)
is required along the centrelines and the aspect ratio of the
microchannel (AR=H/W). All the geometries are defined
[image:2.612.305.547.63.294.2]in Table 1, whereHrepresents the channel depth andW the
Fig. 1 Optimal shape design procedure. a) Schematic illustration of the optimization flowchart, b) top-view of an exemplifying optimized design, c) 3D illustration of the optimized design including the geometric parameters, d) target velocity and strain-rate profiles along the vertical centreline (x=0).
inlet/outlet channel widths∗. Thus, for instance, the geome-try named as L2R2.5AR1 has been optimized for a value of Lext =2W, a radiusR=2.5(W/2)and for an aspect ratio of
H/W =1.
Fig.2 shows the normalized velocity profile (uy/U) along
the vertical (outflow) centreline at differentz−planes, where Uis the bulk velocity in the inlet/outlet channels, and the cor-responding extension rate ( ˙ε) profile resulting from the 3D op-timization of cross-slot microchannel using a Newtonian fluid under creeping flow conditions. These profiles follow the
[image:2.612.303.546.580.694.2]ex-∗As an example, the profiles of the geometries L5R8AR0.5, L5R8AR1 and L5R8AR2 are provided as Electronic Supplementary Information.
Table 1 Characteristic dimensions of the cross-slot micro devices.
3D optimized cross-slot H[µm] W[µm] Lext[µm] R[µm]
-10.0 -7.5 -5.0 -2.5 0.0 2.5 5.0 7.5 10.0 -2
-1 0 1 2
z/(H/2)=0
z/(H/2)=0.2
z/(H/2)=0.4
z/(H/2)=0.6
z/(H/2)=0.8
u
y
/
U
y/(W /2)
y
x
Inlet Inlet
Outlet
Outlet
(a)
-10.0 -7.5 -5.0 -2.5 0.0 2.5 5.0 7.5 10.0 0.0
0.1 0.2 0.3 0.4 0.5
z/(H/2)=0
z/(H/2)=0.2
z/(H/2)=0.4
z/(H/2)=0.6
z/(H/2)=0.8
(
u
y
/
U
)
/
[
y/
(
w
/
2
)
]
y/(W /2)
(b)
Fig. 2 Numerical profilesin the 3D optimized cross-slot microchannel (L5R8AR1) along the outlet centrelines (x=0) for a range ofz-planes and for creeping flow. a) Normalized velocity profiles; b) corresponding normalized strain-rate profiles.
pected target functions closely, with a linear variation of the velocity profile in the region of envisaged constant strain-rate and showing sharp edges at the end of this defined zone of constant extension rate, thus providing an excellent control of the extension rate to which the fluid or the object being anal-ysed is subjected to in the central cross chamber of the device. However, there is a clear gradient of extension rate in thez -direction, with the strain-rate reaching its maximum value at the mid-plane and decreasing towards the bottom/top walls as a direct consequence of the no-slip at the end-walls. Despite this strain-rate gradient, we should highlight that the unifor-mity of the extension rate profiles at each z-plane is main-tained. The non-negligible gradient of extension rate along the depth of the channel may limit somehow the
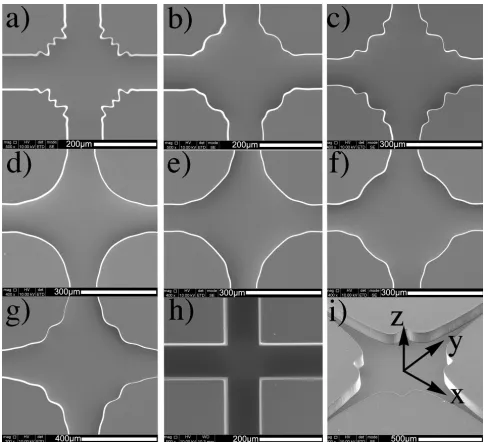
applicabil-Fig. 3 Scanning electron microscopy (SEM)images of the cross-slots used in this work as described in Table1. In cases a)-h) a top-view is shown, while in case i) a perspective view is illustrated.
ity of these 3D optimized cross-slot for extensional microflu-idic rheometry, since it can have repercussions on the extra pressure drop, as well as on flow induced birefringence mea-surements, which rely on a cumulative measurement of the retardation throughout the light path (depth of the channel). However, we note that near the centre plane the variation of the strain-rate with the depth is moderate, as illustrated in Fig.2(b). For the profiles atz/(H/2) =0.2 andz/(H/2) =0.4,
a variation of 20% and 40% along zcorresponds to a
varia-tion of 3.66% and 14.74%, respectively, in the strain-rate with regards to the centreplane (z/(H/2) =0). In the particular case of applications involving the stretching of single macro-molecules or cells, because these specimens can be trapped in the central region of the cross chamber at the mid-plane, the uniformity of the extension profiles around the mid-plane gen-erated by these 3D optimized cross-slots reveals as a promis-ing leap forward towards the mechanical characterisation of molecules and cells in lab-on-a-chip devices.
2.2 Experiments
The optimized shapes were fabricated in PDMS from SU-8 photoresist moulds using standard soft-lithography
tech-niques. A high-resolution chrome mask was employed to
obtain high quality SU-8 moulds with nearly vertical side-walls and well-defined corner features. Fig.3 shows scanning electron microscopy (SEM) images of all optimized cross-slot
[image:3.612.304.548.68.289.2] [image:3.612.61.262.79.445.2]the mid-plane at the centre of the cross chamber. Using the
Matlab®Image Processing Toolbox™and bright field
micro-copy images, we have confirmed that the numerical designs were reproduced in the PDMS channels with a deviation in the dimensions below 5% of the channel width. The depth of the devices and the channel width of the inlet/outlet arms are indicated in Table1.
The experimental results presented here were obtained us-ing distilled water as workus-ing fluid. All the experiments were carried out at an average temperature of 295 K, for which the dynamic viscosity and the density of distilled water are
µ=0.96 mPa·s andρ=997.8 kg/m3, respectively.
The flow in the cross chamber was characterized
exper-imentally using µPIV33,34 following the procedure detailed
by Oliveira et al.35. A CCD camera (FlowSense 2M
cam-era) connected to an inverted microscope (Leica DMI 5000 M) with 10X and 20X objective lenses (numerical aperture, NA=0.30 and NA=0.5, respectively) and a filter cube were
used to acquire the images in the mid-plane (z=0). For
volume illumination of the flow, we used a double-pulsed
Nd:YAG laser system operating at a wavelength ofλ =532
nm. As tracer particles, we used 1 µm diameter
fluores-cent particles (FluoSphere carboxylate-modified, nile red, Ex/Em=535/575 nm) at a concentration of∼0.02% by vol-ume. The time lapse between two consecutive frames was adjusted depending on the flow rate. For all cases, a minimum of 100 image pairs were recorded, divided into interrogation areas of 32x32 pixels. These images were processed and en-semble averaged using the DynamicStudio software (version 2.30.47, Dantec Dynamics).
The flow rate was controlled by means of a neMESYS low pressure syringe pump (Cetoni GmbH) with three indepen-dent modules. The flow rates considered ranged from 2 µl/h
to 36 ml/h in order to cover Reynolds numbers from 10−2
up to 102in all the geometries. Depending on the flow rate different Hamilton syringes (25 µl, 500 µl and 1 ml) were used to ensure pulsation-free dosing. Three pumps controlled two inlet and one outlet flow rates, while the remaining outlet was left open to the atmosphere to balance the flow.
3
Results and Discussion
The exact length of the extension region (Lext) associated with
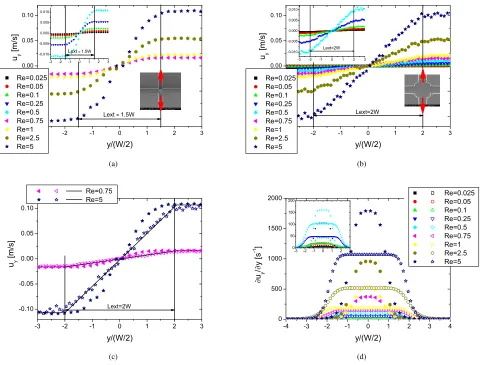
the standard cross-slot is not obviousa priori, but our µPIV measurements revealed thatLext ≈1.5W (Fig.4(a)). For that
reason, we compare directly the standard cross-slot with the geometry optimized using a similarLext (L2R2.5AR1) to
com-pare their performances. Fig.4(b) shows the velocity profiles obtained for the 3D optimized cross-slot L2R2.5AR1 at Re
uniform strain-rate is indeed Lext ≈2W. Fig.4(c) compares
the velocity profiles between both cross-slots atRe=0.75 and Re=5. It is evident that the profile in the 3D optimized cross-slot is clearly linear (within experimental uncertainty) in the zone of extension, following the numerically predicted pro-files, while the one given by the standard cross-slot shows a sigmoidal shape. By means of numerical derivatives we cal-culated the extension rate profiles along the outlet centreline ( ˙ε= ∂uy
∂y), and Fig.4(d) clearly shows that the extension rate
profile is significantly more uniform for the optimized cross-slot. Given the typical small oscillations observed in the ex-perimental results, due to the exex-perimental errors of the µPIV technique, the calculation of the strain-rate from the derivative of the velocity profile requires a careful analysis. To avoid the high (spatial) frequency oscillation in the computed strain-rate that would occur, we fitted the velocity profiles according to the general expressionuy=[(1/ay)p+(11/b)p]1/p and determined
the parametersa,bandpthat minimize the square of the dif-ferences between the fitted expression and the experimental
measurements. This function has the asymptotesuy=ayfor
small |y|anduy=bfor|y| Lext, as expected for the
opti-mized shape. The strain-rates shown in Fig.4(d) are computed from the derivative of this fitted function.
As the optimization was carried out for creeping flow condi-tions, the uniformity of the strain-rate profiles and the length of uniform extension is only close to expected values at low Re. When the flow conditions deviate significantly from in-ertialess flow conditions the strain-rate field becomes less ho-mogeneous (Re&10), even for the channels with the largest aspect ratio as shown in Fig.5. This does not mean that it is impossible to achieve a uniform extension rate at higher val-ues of Re, but instead it requires to optimize a new geome-try taking into account the convective terms in the momentum equation. However, it is not practical to have different geome-tries for different values ofReand therefore we have restricted our analysis to lowRe, since these conditions are easily met and are relevant for microfluidics.
Fig.6(a) shows a comparison between the normalized veloc-ity profiles measured for all the 3D optimized cross-slot mi-crodevices, the OSCER-shaped device and the standard
cross-slot. At AR=1, the OSCER-shaped device and the
cross-slot are clearly not as effective in obtaining a homogeneous flow field along the outlet centrelines, while the velocity pro-files in the extension dominated region are clearly linear for all the optimized devices and the region of uniform extension rate for each one has the predicted length. As a consequence, playing with the flow rate (Q) and the length of the extension region (Lext), it is possible to reach whichever position in the
˙
ε−Reparameter space (Fig.6(b)) required, as long asReis
-3 -2 -1 0 1 2 3 -0.10
-0.05 0.00 0.05 0.10
Re=0.025 Re=0.05 Re=0.1 Re=0.25 Re=0.5 Re=0.75 Re=1 Re=2.5 Re=5
u
y
[
m
/
s]
y/(W/2)
Lext 1.5W Lext 1.5W
-3 -2 -1 0 1 2 3 -0.010
-0.005 0.000 0.005 0.010
(a)
-3 -2 -1 0 1 2 3
-0.10 -0.05 0.00 0.05 0.10
Re=0.025 Re=0.05 Re=0.1 Re=0.25 Re=0.5 Re=0.75 Re=1 Re=2.5 Re=5
u
y
[
m
/
s]
y/(W/2)
Lext=2W -3 -2 -1 0 1 2 3 -0.010
-0.005 0.000 0.005 0.010
Lext=2W
(b)
-3 -2 -1 0 1 2 3
-0.10 -0.05 0.00 0.05 0.10
Re=0.75 Re=5
u
y
[
m
/
s]
y/(W/2)
Lext=2W
(c)
-4 -3 -2 -1 0 1 2 3 4
0 500 1000 1500 2000
Re=0.025 Re=0.05 Re=0.1 Re=0.25 Re=0.5 Re=0.75 Re=1 Re=2.5 Re=5
u
y
/
y
[
s
-1
]
y/(W/2)
-3 -2 -1 0 1 2 3 0
50 100 150 200
[image:5.612.54.538.84.449.2](d)
Fig. 4 Standard cross-slotvs. 3D optimized cross-slot (L2R2.5AR1):Velocity profiles measured at the mid-plane along the centreline (x=0,z=0) for Reynolds numbers ranging from 0.025 to 5 in (a) the standard cross-slot, and (b) the 3D optimized cross-slot; (c) comparison between the target velocity profiles (lines) and those obtained experimentally for the standard cross-slot (solid symbols) and the 3D optimized cross-slot (hollow symbols) atRe=0.75 and 5; (d) comparison between the extension rate ( ˙ε) generated for the standard cross-slot (solid symbols) and the 3D optimized cross-slot (hollow symbols) for Reynolds numbers ranging from 0.025 to 5.
it is possible to create a 3D optimized cross-slot device on demand depending on the requirements for controlled exten-sional flow.
4
Conclusions
A range of 3D optimized cross-slot devices were designed nu-merically in order to generate homogeneous extensional flows. The devices were optimized considering aspect ratios of or-der 1, with the purpose of exploring the widespread use and the benefits of soft lithography techniques for microfabrica-tion. These 3D optimized cross-slots showed a significantly improved performance in comparison with the standard
-7.5 -5.0 -2.5 0.0 2.5 5.0 7.5 -1.0 -0.5 0.0 0.5 1.0 Re =6.35 Re =31.75 Re =57.14 u x / u x m a x , u y / u y m a x x/(W/2), y/(W/2) u x u y
Fig. 5 Working away from the optimized flow conditions.
Normalized velocity profiles measured along the inlet (hollow symbols) and outlet (semi-solid symbols) centrelines at the mid-plane (z=0) for non-creeping flow conditions in the 3D optimized cross-slotL5R8AR2.
Acknowledgements
MMA acknowledges FCT, FEDER and COMPETE through
project PTDC/EME-MFE/114322/2009. FJG-R was
sup-ported by Fundac¸˜ao para a Ciˆencia e a
Tecnolo-gia (FCT), COMPETE and FEDER through scholarship
SFRH/BPD/69663/2010. MSNO acknowledges EPSRC fund-ing through grant EP/L013118/1. The authors would also like to acknowledge Dr. Simon J. Haward and Dr. L. Campo-Dea˜no for helpful discussions and comments.
References
1 F. J. Galindo-Rosales, M. A. Alves and M. S. N. Oliveira,Microfluidics Nanofluidics, 2013,14(1-2), 1–19.
2 S. J. Haward and G. H. McKinley,Physical Review E, 2012,85, 031502. 3 P. E. Arratia, C. C. Thomas, J. Diorio and J. P. Gollub,Physical Review
Letters, 2006,96, 144502.
4 A. M. Afonso, M. A. Alves and F. T. Pinho,Journal of Non-Newtonian Fluid Mechanics, 2010,165, 743–751.
5 S. J. Haward,Rheologica Acta, 2010,49, 1219–1225.
6 S. J. Haward, T. J. Ober, M. S. N. Oliveira, M. A. Alves and G. H. McKin-ley,Soft Matter, 2012,8, 536–555.
7 N. Dubash, P. Cheung and A. Shen,Soft Matter, 2012,8, 5847–5856. 8 J. A. Odell and S. A. Carrington,Journal of non-Newtonian Fluid
Me-chanics, 2006,137, 110–120.
9 S. J. Haward, J. A. Odell, M. Berry and T. Hall,Rheologica Acta, 2011, 50, 869–879.
10 S. J. Haward, V. Sharma and J. A. Odell,Soft Matter, 2011,7, 9908–9921. 11 G. Juarez and P. E. Arratia,Soft Matter, 2011,7, 9444–9452.
12 E. S. G. Shaqfeh,Journal of Non-Newtonian Fluid Mechanics, 2005,130, 1–28.
-10 -8 -6 -4 -2 0 2 4 6 8 10
-1.0 -0.5 0.0 0.5 1.0 Lext=3W Lext=2W u y / u y m a x y/(W/2) Standard L2R2.5AR1 L3R4AR1 L5R6AR1 L5R8AR0.5 L5R8AR1 L10R10AR1 OSCER-shape (a)
0.0 2.5 5.0 7.5 10.0
0 500 1000 1500 2000 2500 3000 3500 4000 Standard L2R2.5AR1 L3R4AR1 L5R6AR1 L5R8AR0.5 L5R8AR1 L10R10AR1 OSCER-shape LinearFit [ s -1 ] Re Lext 0.00 0.25 0.50 0.75 1.00
[image:6.612.57.262.87.243.2]0 50 100 150 200 250 300 350 (b)
Fig. 6 Length of the extension regions in the 3D optimized cross-slots.a) Normalized velocity profiles measured at the mid-plane (z=0) for each 3D optimized cross-slot atRe=0.1. b) Extension rate ( ˙ε) generated for the 3D optimized cross-slots, the standard cross-slot and the OSCER-shape as a function ofRe.
13 A. G. Balducci, J. Tang and P. S. Doyle,Macromolecules, 2008,41, 9914– 9918.
14 R. Dylla-Spears, J. E. Townsend, L. Jen-Jacobson, L. L. Sohn and S. J. Muller,Lab on a Chip, 2010,10, 1543–1549.
15 M. Tanyeri, E. M. Johnson-Chavarria and C. M. Schroeder, Applied Physics Letter, 2010,96, 224101.
16 M. Tanyeri, M. Ranka, N. Sittipolkul and C. M. Schroeder,Lab on a Chip, 2011,11, 1786–1794.
17 M. Curtis, G. J. Sheard and A. Fouras,Lab on a Chip, 2011,11, 2343– 2351.
18 D. Gossett, T. H.T.K., S. Lee, Y. Ying, A. Lindgren, O. Yang, J. Rao, A. Clark and D. Di Carlo,Proceedings of the National Academic of Sci-ence, 2012,109(20), 7630–7635.
19 W. Xu and S. J. Muller,Lab on a Chip, 2012,12, 647–651. 20 W. Xu and S. J. Muller,Lab on a Chip, 2012,11, 435–442.
10560–10572.
22 J. Dudani, D. Gosset, H. Tse and D. Di Carlo,Lab on a Chip, 2013,13, 3728–3734.
23 P. A. May and J. S. Moore,Chem. Soc. Rev., 2013,42, 7497–7506. 24 S. J. Haward, M. S. N. Oliveira, M. A. Alves and G. H. McKinley,
Physi-cal Review Letters, 2012,109, 128301.
25 M. A. Alves,AIP Conference Proceedings, 2008,1027, 240–242. 26 D. C. Duffy, J. C. McDonald, J. A. Schueller and G. M. Whitesides,
Ana-lytical Chemistry, 1998,70, 4974–4984.
27 J. C. McDonald, D. C. Dufy, J. R. Anderson, D. T. Chiu, H. Wu and G. M. Whitesides,Electrophoresis, 2000,21, 27–40.
28 P. J. Oliveira, F. T. Pinho and G. A. Pinto,Journal of Non-Newtonian Fluid Mechanics, 1998,79(1), 1–43.
29 M. A. Alves, P. J. Oliveira and F. T. Pinho,International Journal for Nu-merical Methods in Fluids, 2003,1027, 47–75.
30 F. V. Berghen and H. Bersini, Journal of Computational and Applied Mathematics, 2005,181, 157–175.
31 M. S. N. Oliveira, F. T. Pinho and M. A. Alves,Journal of Fluid Mme-chanics Nanofluidics, 2012,711, 171–191.
32 R. B. Bird, R. C. Armstrong and O. Hassager,Dynamics of polymer liq-uids. Volume 1 - Fluid mechanics. Second edition., John Wiley and Sons Inc., United States, 1987.
33 J. G. Santiago, S. T. Wereley, C. Meinhart, D. J. Beebe and R. J. Adrian,
Experiments in Fluids, 1998,25, 316–319.
34 C. D. Meinhart, S. T. Wereley and M. H. B. Gray,Measurement Science and Technology, 2000,11, 809–814.