An Evaluation Methodology for
Crowdsourced Design
Hao Wu
Department of Design, Manufacture and Engineering Management University of Strathclyde
Glasgow, UK [email protected]
Jonathan Corney
Department of Design, Manufacture and Engineering Management University of Strathclyde
Glasgow, UK [email protected]
Michael Grant Department of Architecture
University of Strathclyde Glasgow, UK [email protected]
Abstract—In recent years, the “power of the crowd” has been repeatedly demonstrated and various Internet platforms have been used to support applications of collaborative intelligence in tasks ranging from open innovation to image analysis. However, crowdsourcing applications in the fields of design research and creative innovation have been much slower to emerge. So, although there have been reports of systems and researchers using Internet crowdsourcing to carry out generative design, there are still many gaps in knowledge about the capability and limitations of the technology. Indeed the process models developed to support traditional commercial design (e.g. Pugh’s Total Design, Agile, Double-Diamond etc.) have yet to be established for Crowdsourced Design (cDesign). As a contribution to the development of such a general model this paper proposes a cDesign framework to support the creation of crowdsourced design activities. Within the cDesign framework the effective evaluation of design quality is identified as a key component that not only enables the leveraging of a large, virtual workforce’s creative activities but is also fundamental to almost all iterative optimisation processes. This paper reports an experimental investigation into two different Crowdsourced design evaluation approaches; free evaluation and ‘Crowdsourced Design Evaluation Criteria’ (cDEC). The results are benchmarked against a ‘manual’ evaluation carried out by a panel of experienced designers. The results suggest that the cDEC approach produces design rankings that correlate strongly with the judgements of an “expert panel”. The paper concludes that cDEC assessment methodology demonstrates how Crowdsourcing can be effectively used to evaluate, as well as generate, new design solutions.
Keywords—crowdsourcing; crowdsourced design methodology; design evaluation; crowdsourced design evaluation criteria; collaborative design, human based genetic algorithm
1. INTRODUCTION
assessment of a crowdsourced design task’s sensitivity to payment and evaluation methods (section 3), the results of these experiments are then presented (section 4). In section 5 the results of the experimental prototype are benchmarked against an ‘expert panel’s’ evaluation of the results and the paper ends with conclusions and recommendations for future work in section 6.
1.1Crowdsourcing
Commercial design tasks are rarely undertaken by individuals, but rather by groups of people with various skills (i.e., marketing, designers, manufacturers, engineers, purchasing managers, salesmen and after-sale service workers, etc. ) [2][3][4]. This collection of people could be regarded as a form of crowd, so in many commercial enterprises, design and creativity has been seen as attributable to an internal crowd for many years. However, over time, the nature of the “crowd” has been changing.
In 2006, “crowdsourcing” was defined by Jeff Howe as “the act of a company or institution taking a function once performed by employees and outsourcing it to an undefined (and generally large) network of people in the form of an open call”[5]. However, these people do not have the same composition as the internal company “crowd” discussed earlier. This new type of “crowd” is composed of anonymous, isolated individuals [6]. In this crowd, members do not know each other; and usually work alone on tasks that, if their results are accepted, are rewarded with, typically, small amounts of money. [7]. Crowdsourcing groups include online product communities [8][9][10], virtual communities of special interests [11], the general public [12][13], and employees who typically would not participant in the tasks to be completed [14]. Since 2006, two distinct approaches have emerged to support design using crowds, which are described in the next sections.
1.2Crowdsourced Design - Methodologies 1.2.1 The Human-based Genetic Algorithms
One of the most impressive methodologies to emerge for collaborative, crowdsourced design is the Human-based Genetic Algorithm (HBGA) that has been used for generative innovation tasks [15][16][17]. The approach uses selective combinations to develop creativity [18][19], and has been applied to a number of different applications [16][15][20]. This is a theoretical appealing approach because it has been suggested by some researchers that creative design comes from combinations [19]. In the HGBA, new ideas are basically separated into different generations. Participants from the crowdsourcing platform create the first generation of designs. Then a second crowd evaluates the first generation and chooses a number of the best pairs for a combination process to construct the second generation. In generation 2, some of the ideas were selected directly from the top ranked generation 1 designs, and others were generation 2 designs (arising from combinations). The process repeats with a third generation generated from combinations of the best second generation results [16][15]. So, iteratively, generation after generation, new designs are created.
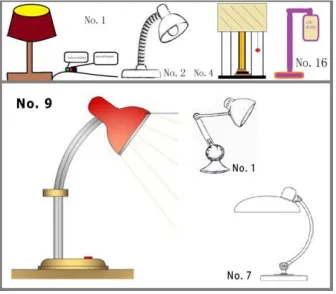
Fig. 1 Desk Lampshade generated by HBGA: Generation 1(Top Line); Generation 3 (bottom).
The HBGA combination system is illustrated by a “lamp design task” (implemented by the authors on Amazon’s public crowdsourcing site called Mechanical Turk). Anonymous workers were paid to create a sketch of a lamp design as the first generation, and then a different crowd evaluated the results. After evaluation, another group of MTurk workers (known as Turkers) created new lamps by combining the best designs from the first generation. After that, other Turkers evaluated all designs. The results (Figure 1) show that even though most participants had no design experience, the HBGA combination system produced viable (but in this case) not very novel designs. However HBGA is not the only approach used to generate designs from crowds and the next section describes how the idea of public design competitions has been adapted for the Internet age.
1.2.2 Public Design Competitions
[image:2.612.223.391.403.550.2]organizations. The payment offered for each task (usually paid only to the “winner”) could be as low as ¥200 (about $33), and as high as ¥20,000 (about $3,306). The total payments made on Taskcn is ¥37,751,630 ($6,031,094) [22]. By the end of January of 2014, the total number of registered users on Taskcn was 3,494,352 [22]. Malone [23] claimed that future freelance marketplaces will be like the Witkey (crowdsourcing) model. Witkey is not entirely open, participants are required to have expertise in a particular subject area [24]. Similar restrictions are seen on many platforms the requirements for workers in the crowd to have a level of skill in a specific task in frequently seen. For example, in Galaxy Zoo [25], only users having a basic knowledge of astronomy are able to do the image classification tasks.
Although the “winner take all” approach employed by such a public competition site will be simple for the requester to administer, it limits the number (and so the diversity) of solutions this is because workers are aware that their chance of payment are small. To mitigate these effects competitions can be conducted in a number of stages in which participants are guaranteed a level of reward. A good example of this approach is the “GE Jet Engine Bracket Challenge” in which participants were required to design a structurally efficient and cost effective jet engine bracket [26].
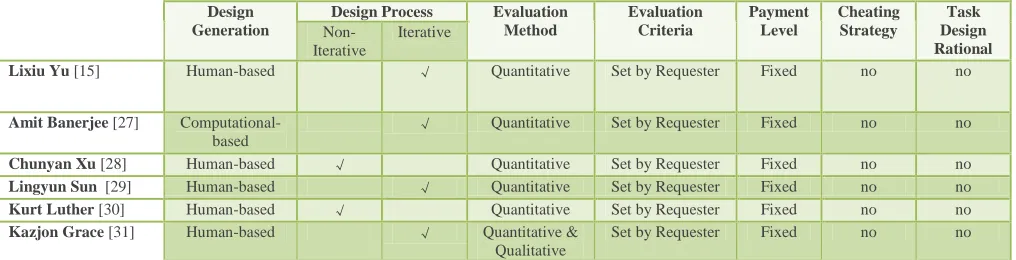
[image:3.612.54.562.324.454.2]Although the HBGA and competition methodologies are clearly effective, they are only components of the overall design process. At a high level the creators of crowdsourced design tasks must select the “tools” (i.e., components) they are going to employ and define the parameters (e.g., crowd size, payment level) and workflows needed to implement the task online. The components used to implement the crowdsourced design tasks reported by different researchers are illustrated in Table I. Although the authors’ selection of parameter values (e.g., payment level) and components (e.g. iterative design) effectively enables their investigations, none of the papers explicitly enumerate the choices available or the rational for final selection. The lack of an explicit process design model for crowdsourced design creates a barrier to the wide spread adoption of the method. To address this gap the authors propose a novel framework that explicitly defines the major steps in the creation of a crowd-based design task.
TABLE I TABLE IREPORTED COMPONENTS OF CROWDSOURCED DESIGN TASKS
Design Generation
Design Process Evaluation Method
Evaluation Criteria
Payment Level
Cheating Strategy
Task Design Rational
Non-Iterative
Iterative
Lixiu Yu [15] Human-based √ Quantitative Set by Requester Fixed no no Amit Banerjee [27]
Computational-based
√ Quantitative Set by Requester Fixed no no
Chunyan Xu [28] Human-based √ Quantitative Set by Requester Fixed no no Lingyun Sun [29] Human-based √ Quantitative Set by Requester Fixed no no Kurt Luther [30] Human-based √ Quantitative Set by Requester Fixed no no Kazjon Grace [31] Human-based √ Quantitative &
Qualitative
Set by Requester Fixed no no
The next section synthesises the reported experience of researchers and practitioners into an overall “Crowdsourced Design Framework” (cDesign) that summarises all the stages of a systematic model for using open commercial crowdsourcing platforms in creative tasks.
2. CDESIGN FRAMEWORK
Fig. 2 The cDesign methodology
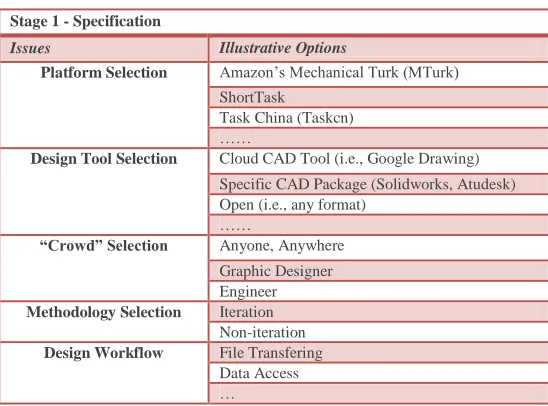
[image:4.612.167.450.53.307.2]Each of these stages can be expanded into a specific checklist of issues and options that must be addressed by the creators of crowdsourced design tasks. Table II illustrates the components of the Specification Stage.
TABLE IISPECIFICATION TASKS
Stage 1 - Specification
Issues Illustrative Options
Platform Selection Amazon’s Mechanical Turk (MTurk)
ShortTask
Task China (Taskcn) ……
Design Tool Selection Cloud CAD Tool (i.e., Google Drawing)
Specific CAD Package (Solidworks, Atudesk) Open (i.e., any format)
……
“Crowd” Selection Anyone, Anywhere Graphic Designer Engineer Methodology Selection Iteration
Non-iteration Design Workflow File Transfering
Data Access …
[image:4.612.169.443.373.576.2]Stage 2: Without prior experience of running similar tasks many of the choices made in the specification stage will be educated guesses whose effectiveness is uncertain. Stage 2 validates the choice made in Stage 1 by trialing prototype versions of the task. There are 6 implementation decisions (identified in Table III) that need to be specified and validated in Stage 2: the payment for participants (per person per task); time to undertake the task; clarity of the task instruction; results submission method and the manner in which workers who attempt to scam, or cheat, the system should be handled.
TABLE III VALIDATION TASKS
Stage 2 – Prototype Validation
Issues Illustrative Strategies
Payment Payment Strategy (flat rate or bonus) Time Time Strategy (how long to do the task?) Results Submission The required format for file submission
Cheats Avoiding Avoidance
Qualication task (before participants accept the prototype task)
Objective/Subjective questions and answers
Task Instruction Writing Written instructions Illustrration of typical outputs Evaluation for Prototype
Results How are the results judged?
The design of the crowdsourced task is refined through the process of prototype testing until the require Quantity and Quality (Q & Q) of results are being produced. At which point the process moves to the Execution stage.
Stage 3 & 4: Execution is essential a scaling up of the task for presentation to a larger crowd. The length of the execution stage will be determined by the method set in Stage 1. A competition might last many weeks whereas an HPGA will often cycle through generations of design every few days. So a crowdsourced design task could be characterised by the nature of the designing process as either Iterative Design Tasks (IDT) or Non-iterative Design Tasks (NIDT). Regardless of the mechanism used, the process ends with Evaluation task which reviews the crowd’s work and select the best outputs.
At both the validation and execution stages the ability to accurately evaluate designs is crucial to tasks such as the setting of payment levels (Stage 2) or selecting the best design for iterative improvement (Stage 3). Design Execution and Design Evaluation are regarded as separate stages because although tightly coupled they are distinct activities which occur sequentially (i.e., the process alternates between designing and evaluating). The next section describes an experiment, in terms of the cDesign framework, that was created to investigate the effectiveness of two different approaches to Crowdsourced design assessment.
3. EXPERIMENTAL DESIGN
This section reports an experimental crowdsourced design task in terms of the cDesign framework. The objective of the experiment was to first generate a representative sample of crowdsourced designs for a simple 2D layout task and then investigate two different approaches to their evaluation. The following sections describe the components of the experiment (e.g. platform, tools and workflows) and how varying payment levels were used to create a wide spectrum of design solutions for an interior design problem. Two approaches are then employed to assess the quality of the generated designs: firstly a free (i.e., unguided assessment) in which the crowd are simply asked to mark (i.e., rank) the design on quality without any instruction (this is analogous to the approach adopted in the reported HPGA work) and secondly a three-step process where the crowd are used to first generate the assessment criteria which are later used, by a different crowd, to judge the results.
3.1Stage 1: Specification
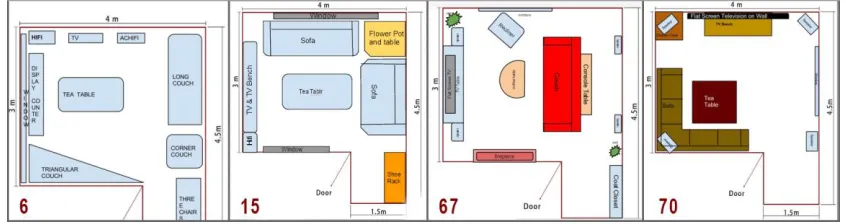
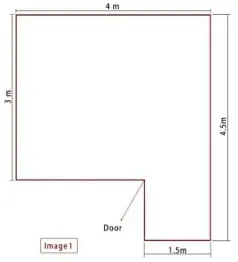
The experiment will use the task of designing an interior layout for a domestic home from a specified list of furnishings for a fixed room size and shape (examples of the crowd’s designs are shown in Figure 3).
[image:5.612.94.517.575.687.2]3.1.1 Platform Selection
The nature of the design brief will determine the platform, design tools, crowd type, methodology and workflow. In this case, the task is one that could be attempted by most educated people (familiar with urban living rooms) and does not require any specialized knowledge of engineering or graphics design. Consequently, a public crowdsourcing platform (MTurk) was selected rather than a specialise site (e.g., GrabCAD for engineering, or Taskcn for graphic design experts).
3.1.2 Design Tool Selection
Prior experience of crowdsourced design tasks, [34] [26] which placed no restrictions on the type of CAD tool used by the crowd to fulfil an assignment, suggested that the many different formats in which work was submitted (e.g., sketches, CAD files, scans, etc.) are too uneven in their appearance to be objectively compared. Furthermore the solution files were difficult to organize because of their non-uniform format. This lead the authors to reflect on what kind of platform can be best used as a design tool for crowdsourcing. It was concluded from a review of previous research that the CAD tools used for public crowdsourcing sites should contain the following features: first, they should have minimal barriers to use (i.e., low cost or free, little or no installation, no registration); second, be easily learnt (so worker who have never used the tool before can still undertake the task); 3rd, use a standardized file format (to enable easy processing of results and organizing files).
Given these requirements, it was determined that the “Google Drawing” system (in Google Drive Applications https://docs.google.com/drawings/) could be an appropriate choice. In an early trial task on MTurk, Google Drawing enabled a workflow in which workers could return 2D results as text string (i.e., URL for a shared doc) and it was also noted that L. Yu’s Children’s Chair design experiment [15] established that the Google Drawing application could work well as a tool for 2D crowdsourced design. Initial testing by the authors suggested that with only a little practice users could finish drawing in Google Drawing of the required complexity in about 30 minutes.
3.1.3 Crowd Selection
It is possible to restrict jobs to a sub-set of the workers available on any platform by qualification tests or other means. However, the nature of the task meant that there was no necessity that participants should have specialist skills or be of a particular nationality or background. Consequently all people using the internet and having an account on the selected crowdsourcing platform would be welcome to participate in the design as well as evaluation experiments.
3.1.4 Methodology Selection
There are two generic crowd design methodologies namely 1) linear competition (non-iterative) and 2) iterative improvements. Linear competitions might be single or multistage and reward workers with staged payments or a winner-take-all prize. Similarly iterative improvement can range from the very structured HPGA process to a looser process, where workers compete for bonus payments by improving on previous solutions. The details can be decided later (after the evaluation and payment levels) have been determined. In Stage 1, it is sufficient that the high level methodology is fixed. This choice will allow the workflow to be defined. In the case of the 2D interior design task, it was decided that a non-iterative process would be suitable since the objective is to generate many solutions and then used the crowd to evaluate them. A well designed living room will work efficiently for many different types of users (e.g., from families to young professionals), consequently the “solution” generated by a single member of the crowd would be unlikely to offer all the possible perspectives. Because of this an iterative design process was selected, since the objective is to generate many solutions (from different potential living room users) and then use the crowd to evaluate them generation by generation.
3.1.5 Design Workflow
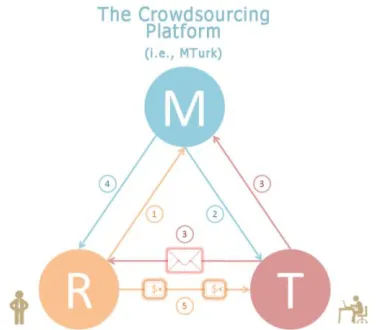
Fig. 4 Main stages of the experiment: 1. Requesters post work on MTurk; 2.Turkers (workers) find tasks via MTurk; 3. Google Drawing tool is used by workers to draw the living room layout; Turkers upload their results to Requesters on MTurk and share the drawings via Google Drawing; 4 & 5. Once solutions are
approved by Requesters on MTurk, payment will be given to Turkers.
3.2Stage 2: Validation (Prototype)
The engagement of a large, motivated crowd is crucial to the success of any crowdsourcing task. Key to this is the way that the crowd is rewarded. The main focus of the task in this section is to investigate the relationship between quality of design and the payment for workers (payment for one person for one task). Although there is an obvious financial motivation (i.e., if payment is optimised, “requesters” may be able to spend less but gain more innovative designs), there are many trade-offs. For example, increasing the rewards may mean that the quality of design might improve. It is also possible that payment will have a correlation with the speed and quantity of designs submitted. Generally, when posting a task on a crowdsourcing platform, the parameters required are: 1), the payment for workers; 2), how much time is allowed to complete the task; 3) how they submit their solutions; 4) how to avoid cheats (e.g., individuals trying to ‘scam’ the system). Once these parameters have been decided, they must be communicated clearly in the task instructions.
3.2.1 Payment & Time Strategy
To establish the response of the selected platform’s crowd to a design task, the prototype must be tested in a structured manner. In Crowdsourced design applications researchers have reported that there is a weak correlation between the level of payment (per worker per task) and the quality of results but a strong relationship between the level of payment and the quantity of designs generated [34]. Given this, it was decided to offer the experimental task to the Crowd with different levels of payment to establish the level of response from the Crowdsourcing platform. The lowest payment was $0.15 and the highest $1.00. Between these two extremes, the levels of payment were $0.35, $0.50 and $0.75. These are generous payment levels in comparison to other reported research studies which could as low as $0.01 [35], $0.10 [36][35]. However, in consideration of the experiment’s level of difficulty, the lowest rate was fixed as $0.15 [37][38]. By choosing $1.00 as a maximum payment the task would by one of the best paid on the platform where only some translation jobs might be paid as much as $1.40 per hour [35][39]. The time allowed for workers to complete the task was set at an hour this being based on observation and prior experience of using the platform.
3.2.2 Results Submission
The participants were required to use the Google Drawing application to represent and communicate their design solutions. Because the native Google Drawing format files could not be submitted via MTurk directly, each worker had to “share” their results with one of the authors and also submit a screen-shot of the results via MTurk when they finished. This enabled payment to be made through MTurk.
3.2.3 Cheating Strategy
In crowdsourcing platforms, participants often demonstrate high levels of intelligence. But at the same time on open public platforms, a number of workers always attempt to subvert the system [40][41][42]. In this experiment, the authors chose the following methods to validate submissions. First, based on the fixed design tool, participants would need to share their raw drawing file with the authors instead of only submitting results on MTurk, which would then require workers to draw the layouts by themselves (and so avoiding people simply submitting random images). Second, when evaluating designs, participants need to input some text giving subjective reasons for why they ranked the designs as they did. This step avoided the possibility that participants rank designs randomly just for payment.
[image:7.612.211.399.53.218.2]Once the above decisions had been made the focus turned to the writing of the task instruction. Several drafts were reviewed to make sure the text was easy to understand and as clear as possible. Because Crowdsourced worker can come from all over the world a large number of participants will not be native English speakers. The following are the final instructions for the design task:
“Please use Google Drawing to design a livingroom plan. In this livingroom (the plan outline and main size are shown as image 1 – Figure 3 below), first, you need to insert the image 1 into your new Google Drawing document. Second, draw some appliances and furniture (at least, a TV, a TV bench, Hifi devices, a tea table, a set of sofa are required; specifically, the more the better, the more detailed the better) which fit the outline and main size. Additionally, the position of a window (any size fitting the plan outline and the main size) needs to be fixed. It is also required that you need to add texts into your graphics to explain what are in your drawings.”
Fig. 5 Room outline supplied to workers
Result Uploading:
1. Please directly use the snipping tool to upload your design drawing result (screen shot) as a JPEG document (at least 300 x 300 pixels, 96 dpi) for MTurk task submission.
2. Please name your drawing document in Google Drawing as your MTurk worker ID. Then, please share your design drawing result with “[email protected]” via Google Drawing sharing tool.”
Participants had 1 hour to draw the layout, and each task within a different payment category was posted for seven days (after one week the task would expire). The quantity of solutions for each task was unlimited so both the volume of responses and their quality could be studied simultaneously. Previously reported work has only explored a limited range of payments (in Kazai’s experiment for example [43], there were only two levels of payment: $0.10 or $0.25). In contrast, the design task was repeated five times with different degrees of remuneration. Each time the same task was posted, but with different payment levels being set at: $0.15, $0.35, $0.50, $0.75 and $1.00.
3.2.5 Evaluation of Prototype Results
After the design workflow was fixed, the task was made available on the Crowdsourcing platform for a small number of workers to test the job’s design. The researchers judged the prototype results by their quality and quantity (i.e., Q & Q). In this case sufficient responses were required to allow statistical analysis so a minimum of 40 designs were needed. In terms of the Quality of the results from the prototype stage, the basic requirement is that only valid results were accepted, no cheating is allowed (i.e., copies from the Internet, like ‘GoogleTM Image’, or any work that did not follow the task instruction). As a result, after the evaluation showed that the results satisfy the Q & Q, the design and its workflow was deemed suitable to move to prototyping the Evaluation Stage. If this had not happened the prototype would needs to be corrected (e.g., payment or instructions changed), until it reaches the Q & Q requirements.
3.3Execution
The cDesign framework identifies two general approaches to the execution stage: Non-iterative Design Task (NIDT) and Iterative Design Task (IDT). From the section above it can be seen that this experiment applied the non-iterative design method. After the Prototype Design stage, the design method, platform, payment and the design tool were all validated such that the task could collect design results of acceptable quantities. The following sections discuss the design results, design evaluation method and the evaluation results.
3.4Evaluation
[image:8.612.247.366.162.293.2]This enabled the 83 layouts to be separated into 7 groups (12*6+11*1=83) randomly. Each group was posted on MTurk as a separate evaluation task. The next section will represent the details of two evaluation methods and their results.
4. EVALUATION AND RESULTS
It is well documented that Crowds can design [15][16][44], so it appears likely that they could also evaluate design quality. In the development of the HBGA method the crowd evaluated the designs [20], but their judgement was never validated. Consequently there is a need for a robust, validated approach to the crowd based assessment of design quality. After 83 designs at different payment levels had been generated, the qualities of the results were assessed by using two different approaches:
Evaluation Method 1: Free Evaluation
Evaluation Method 2: Crowdsourced Design Evaluation Criteria (cDEC)
The following sections describe these processes:
4.1 Evaluation Method 1 (Free-Evaluation)
At the end of the five living room layout design tasks (i.e., posted at 5 different payment levels), there were a total of 83 drawings created by the MTurk workers and approved for payment. Although some reported crowdsourcing investigations involved thousands of participants, design science research frequently conducts experiments on groups of 20 or less participants, so consequently it was judged that 87 design results would be sufficient for this study. The first (and also the most commonly adopted approach reported in the literature) is to evaluate them simply by asking the crowd to judge their relative worth with no criteria other than ‘common sense’. Prototype testing of this approach showed it was important that all the designs being assessed could be seen on a single screen. The evaluation process used to judge the design quality comprised the following 3 steps. First: the 83 results were randomly separated into 7 groups. In group 1-6, there were 12 drawings; in group 7, there were 11 drawings. Second: each group was posted on MTurk and workers asked to allow them to be ranked from best to worst. Third: the results were aggregated.
The following paragraphs are the layout evaluation task description:
“Please evaluate the 12 different room layouts shown below. The dark red color figure in the lower-left corner in each room layout is the number of the different layout. Please give marks from 0 to 100 to judge the quality of each design. “0” means impractical or not original at all, and “100” means perfect or the best design.
After the layouts design evaluation, please choose the best 3 designs from those 12 layouts, and provide a short description illustrating the reason why you choose them.”
The scale of 1-100 numerical marks gave a broad range of responses for workers to express their assessment of different design quality levels. The raw number of layout designs submitted by the MTurk workers (including the approved solutions as well as the rejected designs) rises strongly with the increasing payment level. The time for collecting designs submitted at each payment level was one week. For $0.15 payment, only 3 layouts were received. However, when the payment increased to $1.00, the number of designs submitted was 93.
The 83 “approved” (i.e., accepted for payment by the requesters) room layout designs were assessed for their quality by asking the MTurk worker to assign a mark between 1 and 100 to each member of seven groups. The overall average score for each member of each group was calculated and the following observations were made. The highest average mark 59.4 comes from the $1.00 payment and the lowest 53.7 points to $0.75 (rather than $0.15). In addition to marking designs, Turkers performing the assessment tasks also voted on the best 3 drawings in each group. Analysis of these votes showed that some of the layouts did not even receive one vote. In contrast, one layout in the $1.00 payment group was voted 8 times (the most votes). However, reviewing the methodology, it was realized that marking and voting did not provide easily comparable information. As a result, a ranking process was performed.
All the submitted designs were divided into groups of 12, each of which was marked by 10 different workers. These marks were expressed as a value between 1 and 100, and used to establish the rank order (i.e., best to worst) for each worker’s assessment (shown in the columns of table III). The use of rank position, rather than raw numerical value, was done to moderate against over or under marking (i.e., excessively generous or hard assessments) by individual worker. Finally for each design, an average rank position was determined (rows in table III). In this way the relative quality of each design in each group was determined.
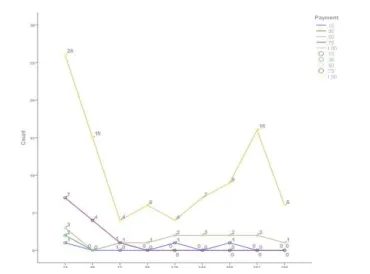
Fig. 6 Number of designs generated by workers for different payment levels over time.
[image:10.612.214.399.52.189.2]The results show that the quantity of designs generated by Turkers increased significantly when the payment rose, but in most cases the rate of submission fell from an initial peak. The exception was when payment increased to $1.00 when although output fell from an initial peak, it rebounded strongly at the end (as Figure 6). One possible explanation for this phenomenon is: in MTurk, although there are over 500,000 workers from over 190 countries [47], the number of Turkers who are interested in the same or similar categories is fixed. When a new task is published, workers find it, complete it and gain the payment from requesters after their solution is approved. Then they hunt for new tasks rather than the same one. As a consequence, and always in the first 24 hours, requesters receive the most number of submissions. A more detailed analysis of the relationship between the payment and the design quality was reported in an authors’ previous paper [34].
TABLE IV DESIGN RANKS FOR GROUP 1USING FREE EVALUATOIN
Number of Design (Design ID)
Design Rankings Ranking Average STDEV
No. 28 12 11 8 3 10 6 11 10 8 10 12 2.73
No. 29 11 8 2 1 3 2 10 6 2 7 4 3.68
No. 46 8 11 10 12 5 2 9 8 4 5 9 3.27
No. 65 8 6 11 10 4 5 7 12 4 9 11 2.88
No. 39 1 8 4 6 12 1 5 2 2 4 3 3.47
No. 49 4 4 1 1 11 2 5 4 4 2 1 2.90
No. 72 2 5 3 5 9 7 3 3 1 2 2 2.49
No. 66 4 1 9 9 8 10 3 6 4 1 5 3.37
No. 71 3 3 5 8 1 12 11 5 8 10 7 3.75
No. 75 4 1 11 3 6 7 1 10 8 7 6 3.49
No. 76 4 8 7 7 7 9 2 8 11 5 8 2.57
No. 78 10 6 6 10 2 11 7 1 12 10 10 3.78
Average STDEV = 3.20
4.2 Evaluation Method 2 (cDesign Evaluation Criteria)
It is clear from Table IV that in this method there is a great deal of variation in the assessment of design quality. In addition, the standard deviations (STDEV) of the rankings as well as the average STDEV are listed in the table and considered in the Discussion section. The second approach to assessing the design quality used the crowd to first generate the assessment criteria and then rank the designs against the measures suggested. Although there are a large number of evaluation criteria for interior design, the hypothesis underlying the second evaluation method investigated was that crowds could create the criteria which are appropriate for crowds themselves. Consequently, a crowdsourced design evaluation criteria (cDEC) collection task was posted on the platform: “Please list 5 features you think that the best living room layout design should have”.
[image:10.612.118.495.320.493.2]submitted 100 responses each suggesting criteria against which designs could be assessed. However, in recent years with the improvement of the software in the qualitative research domain, textual data analysis is easier to undertake. The process of Coding is one method to classify and summarise qualitative results, and it is convenient to integrate data by using a qualitative research tool called Nvivo into the final evaluation criteria that the authors have named as cDesign Evaluation Criteria (cDEC). Therefore it can be seen that the qualitative research method was applied in the crowdsourced design area supported by a commercial crowdsourcing site.
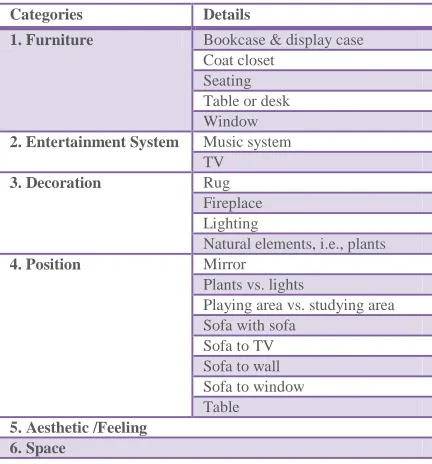
[image:11.612.199.414.190.424.2] [image:11.612.198.414.194.426.2]In the cDesign evaluation criteria collection task, 113 evaluation criteria were collected from the crowd. Six categories emerged from the integrating and classifying process: furniture, entertainment system, decoration, position, aesthetic and space (as shown in Table V). After the coding process, 5 top ranked criteria were selected (from high to low): space (20 references), seating (15 references), table or desk (8 references), TV (8 references) and Aesthetic/Feeling (8 references).
TABLE V CDESIGN EVALUATION CRITERIA CLASSIFICATION
Categories Details
1. Furniture Bookcase & display case Coat closet
Seating Table or desk Window 2. Entertainment System Music system
TV
3. Decoration Rug
Fireplace Lighting
Natural elements, i.e., plants
4. Position Mirror
Plants vs. lights
Playing area vs. studying area Sofa with sofa
Sofa to TV Sofa to wall Sofa to window Table 5. Aesthetic /Feeling
6. Space
The execution parameters of the design evaluation task (i.e., platform, crowd, payment, etc.) using the cDEC were the same as the free evaluation task except that it uses the explicit evaluation criteria suggested by the crowd. In the free-evaluation task, layouts were given a numerical mark in the range of 1 to 100 in contrast to the cDEC process where preference was recorded on a 7-Likert Scale against the crowdsourced criteria. Consequently the two different groups of results needed to be transferred to the same representation to allow comparison. Regardless of the format of the representation, if the evaluation methods are effective then the best and worst designs, within the group, should be identified by an evaluation method. To enable this, the Likert Scale values were used to rank (i.e., order) the designs from best to worst. The ranking is shown in Table VI where the columns show the rank order (from the best to the worst) assigned to the designs by a single worker and the rows show all the assessments made and calculate the average and standard deviation.
TABLE VI RANKING RESULTS USING CDEC FOR GROUP 1
Number of Design (Design ID)
Design Rankings Average Ranking STDEV
No. 28 8 3 10 6 9 8 12 12 3 8 9 3.18
No. 29 3 6 2 1 3 7 5 1 10 7 3 2.99
No. 46 2 7 5 10 8 10 6 3 12 3 5 3.41
No. 65 1 10 7 4 2 3 8 5 1 1 2 3.22
No. 39 4 4 3 3 1 2 1 2 4 6 1 1.56
No. 49 6 11 6 2 7 4 9 7 8 10 8 2.71
No. 72 5 8 4 5 10 6 10 6 11 4 7 2.64
No. 66 10 2 8 11 5 5 2 10 5 2 4 3.53
No. 71 7 9 12 8 4 9 4 9 7 11 11 2.62
No. 75 11 1 1 12 12 1 3 11 6 9 6 4.83
No. 76 12 5 9 9 11 11 7 8 2 5 9 3.18
[image:11.612.119.496.554.713.2]Average STDEV = 3.06
5. DISCUSSION
When comparing two different measurement methods, a standard, or benchmark, reference is required to calibrate the results. In this experiment the results of the crowd were benchmarked against the judgements of an “expert panel” formed of postgraduate architecture students (used because the arrangement of space is a core skill of their discipline). The objective of the expert evaluation was to produce a “definitive” ranking (i.e. canonical assessment) of the relative quality of the designs and so allow comparison of the accuracy of the two different evaluation methods (free-evaluation and cDEC methods), and thus determine which one is most appropriate to use in crowdsourced design tasks. The expert panel’s manual evaluation process is shown in Figure 7. Working in five groups, the architecture students used the following four steps evaluation process: 1, choose the best 50% (41 designs) from all 83 designs; 2, choose the best 50% (20 designs) from the remaining 41 layouts; choose the best 50% (10 designs) from the remaining 20 designs; finally rank those 10 designs with top 1, 2 and 3. There were no compulsory evaluation criteria provided to the students, they evaluated designs based on the task requirements (from the task instruction) and their own knowledge. In total, there were five groups of students; each layout was evaluated five times.
Fig. 7 Examples of the best ranking layouts (numbers following the “Drawing” in the process figure are scores for designs; once a layout moves to the next stage, it would gain +1 or -1 score; the start score for 41 good layouts is +1 and for 42 poor layouts is -0; for the best 3 designs, scores are +7, +6 and +5; for the
worst design, the score is -5)
[image:12.612.120.506.240.515.2]As with previous analysis, the expert panel’s scores were translated into rank order (from the best to the worst) (Table VII), which allowed a comparison with the cDEC and the free-evaluation method. It was observed that from these three evaluation results, different scores and rankings emerged.
TABLE VII DESIGN RANKINGS BY EXPERT PANEL FOR GROUP 1
Number of Design (Design ID)
Design Rankings Average Ranking STDEV
No. 28 8 4 1 10 2 8 4 1 10 2 8 3.65
No. 29 5 4 6 1 4 5 4 6 1 4 5 1.76
No. 46 5 9 1 1 4 5 9 1 1 4 5 3.13
No. 65 3 1 1 1 4 3 1 1 1 4 1 1.33
No. 39 1 3 1 10 4 1 3 1 10 4 4 3.49
[image:12.612.118.498.616.719.2]No. 72 4 1 5 1 4 4 1 5 1 4 3 1.76
No. 66 9 4 6 1 4 9 4 6 1 4 7 2.78
No. 71 9 4 6 1 11 9 4 6 1 11 10 3.74
No. 75 5 9 11 1 4 5 9 11 1 4 9 3.77
No. 76 12 12 12 12 2 12 12 12 12 2 12 4.22
No. 78 11 11 10 1 12 11 11 10 1 12 11 4.27
Average STDEV = 3.01
Although design evaluation is often subjective, the results show that there was reasonable consensus amongst the experts (evidenced by the lower standard deviation). Table VIII shows the degree of statistical correlation between the three different evaluation methods (i.e., Free-evaluation, cDEC and Expert Panel). The correlation between the design quality assessments of the expert panel and the crowd using the cDEC approach is strong (Pearson correlation = 0.660), and much higher than that between the Free-evaluation method ranks and expert panel ranks (Pearson correlation = 0.392). Consequently, the correlation results validate the assertion that the cDEC method is a more effective method for crowdsourcing judgements of design quality than the Free-evaluation method. Furthermore the results suggest that the use of qualitative research methods to develop the evaluation criteria for subjective design task is an effective way of “correctly” evaluating design. Interestingly the cDEC method also produces a variance in quality assessment that is much closer to the experts’ than the free evaluation. This is seen in the values of the Average STDEV (AS) in Tables where the value (3.06) from the cDEC method is closer to the number (3.01) from the expert panel. Overall the variance in design quality assessment is: AS (Free-evaluation) = 3.20 > AS (cDEC) = 3.06 > AS (Expert Panel) = 3.01.
TABLE VIII CORRELATION OF 3EVALUATIONS
Correlations Free-evaluation
Ranking
cDEC Ranking
Expert Panel Ranking Free-evaluation
Ranking
Pearson Correlation 1 .392
Sig. (2-tailed) .207
N 12 12
cDEC Ranking Pearson Correlation 1 .660*
Sig. (2-tailed) .020
N 12 12
Expert Panel Ranking
Pearson Correlation .392 .660* 1
Sig. (2-tailed) .207 .020
N 12 12 12
*. Correlation is significant at the 0.05 level (2-tailed).
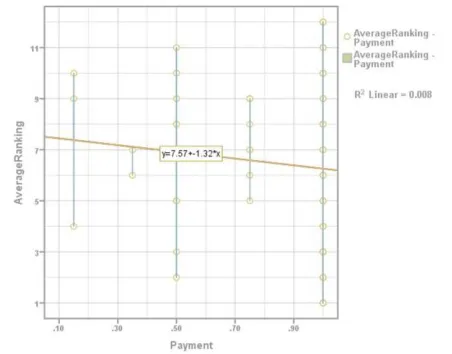
It is interesting to compare the assessments of design quality with payment levels. The Pearson Correlation (between the payment and the average Free-evaluation ranks of all layouts) shows that r=0.138>0 (Sig=0.215), and |r|=0.138. The data suggests that although there is a positive correlation between payment and average rank, it is a weak one. In figure 8 the best fit line proves that there is no strong relationship between ranking and payment (R2 Linear=0.008). The top two highest rankings come from $0.50 and $1.00 payment.
[image:13.612.195.421.495.672.2]6. CONCLUSION,LIMITATIONS AND FUTURE WORK
This paper has discussed generic issues related to the crowdsourcing of design tasks. After establishing a general framework for the design of crowdsourced design tasks the paper investigates the sensitivity of the crowd’s response to different payment levels. Although the quantity of results generated by various payment levels is easily measured, the impact on the quality of the crowd’s design work is harder to judge. Indeed the effective assessment of design quality was seen to be key to the success of almost all approaches to crowdsourced design (i.e., HBGA, Competition, Multi-stage competition, etc.). Because of this selection of a method of design quality assessment is identified as an explicit activity in the cDesign framework and also the subject of an experimental investigation to establish if the crowd could match the judgement of human experts. The evaluation of the same set of designs were crowdsourced on both the basis of purely individual subjective judgements (free-evaluation) and then again against an explicit set of criteria (cDEC) proposed by the crowd.
The cDEC process used qualitative research methods to determine evaluation criteria, that the Crowd where able to apply to make collective judgements on design quality that correlated strongly with those of an expert panel. In other words before Crowdsourced workers are used to evaluate designs, it is appropriate to collect the evaluation criteria from the crowd itself, and then use those crowdsourced evaluation criteria (called cDEC) to evaluate designs. The statistical analysis of the cDEC framework is based on a relatively small sample which limits the accuracy of any analysis. Consequently, future work will investigate the effectiveness of the approach using different design tasks and a larger sample size.
In conclusion, crowds can design, and crowds can evaluate design. Although they might lack design experience, training and skills, etc., their instinctive understanding can be effectively employed. Further work will investigate the crowd’s performance in 3D design, and explore links between theories of Group Decision Making (GDM) and the crowdsourcing methodologies. Indeed the authors believe there are other insights from academic work on collaborative/collective intelligence that could be useful in helping to understand the potential of crowdsourced design.
REFERENCES
[1] R. Whitfield, A. Duffy, G. Coates, and W. Hills, “Distributed design coordination,” Res. Eng. Des., vol. 13, pp. 243–252, 2002.
[2] S.-W. Hsiao and J.-R. Chou, “A creativity-based design process for innovative product design,” Int. J. Ind. Ergon., vol. 34, no. 5, pp. 421–443, Nov. 2004.
[3] R. G. Cooper and E. J. Kleinschmidt, “An Investigation into the New Product Process: Steps, Deficiencies, and Impact,” J. Prod. Innov. Manag., vol. 3, no. 2, pp. 71–85, Jun. 1986.
[4] D. Dougherty, “Interpretive Barriers To Successful Product Innovation In Large Firms,” Organ. Sci., vol. 3, 1992. [5] J. Howe, “The rise of crowdsourcing,” Wired Mag., no. 14, pp. 1–5, 2006.
[6] Yochai Benkler, “The wealth of networks: How social production transforms markets and freedom,” Yale Univ. Press, 2006.
[7] A. Kittur, E. H. Chi, and B. Suh, “Crowdsourcing user studies with Mechanical Turk,” Proceeding twenty-sixth Annu. CHI Conf. Hum. factors Comput. Syst. - CHI ’08, p. 453, 2008.
[8] D. Brabham, “Crowdsourced advertising: how we outperform Madison Avenue,” Flow A Crit. Forum Telev. Media Cult., 2009.
[9] L. B. Jeppesen and L. Frederiksen, “Why Do Users Contribute to Firm-Hosted User Communities? The Case of Computer-Controlled Music Instruments,” Organ. Sci., vol. 17, no. 1, pp. 45–63, Jan. 2006.
[10] R. V. Kozinets, a. Hemetsberger, and H. J. Schau, “The Wisdom of Consumer Crowds: Collective Innovation in the Age of Networked Marketing,” J. Macromarketing, vol. 28, no. 4, pp. 339–354, Dec. 2008.
[11] C. Hogue, “Crowdsourcing for science,” Chem. Eng. News, 2011.
[12] S. Chilton, “Crowdsourcing is radically changing the geodata landscape: Case study of OpenStreetMap,” 24th Int. Cartogr. Conf., 2009. [13] M. Haklay and P. Weber, “Openstreetmap: User-generated street maps,” Pervasive Comput. IEEE, pp. 12–18, 2008.
[14] O. Stewart, J. Huerta, and M. Sader, “Designing crowdsourcing community for the enterprise,” ACM SIGKDD Work. Hum. Comput., pp. 50–53, 2009. [15] L. Yu and J. Nickerson, “Cooks or cobblers?: crowd creativity through combination,” CHI 2011, May 7–12, Vancouver, BC, Canada, 2011.
[16] L. Yu and J. Nickerson, “Generating creative ideas through crowds: An experimental study of combination,” in Thirty Second International Conference on Information Systems, Shanghai 2011.
[17] L. Yu and Y. Sakamoto, “Feature selection in crowd creativity,” Found. Augment. Cogn. Dir. …, pp. 383–392, 2011. [18] A. F. Osborn, Applied imagination; principles and procedures of creative problem-solving. Published by Scribner’s, 1957.
[19] T. Amabile, Creativity in Context: Update to the Social Psychology of Creativity. Westview Press, June 7, 1996.
[20] J. Bao, Y. Sakamoto, and J. Nickerson, “Evaluating Design Solutions Using Crowds,” in Seventeenth Americas Conference on Information Systems, August 4th-7th, Detroit, Michigan, 2011.
[21] “Witkey.com.” [Online]. Available: http://www.witkey.com/. [Accessed: 20-Jan-2014]. [22] “TaskChina.” [Online]. Available: http://weike.taskcn.com/.
[23] T. W. Malone, The Future of Work: How the New Order of Business Will Shape Your Organization, Your Management Style, and Your Life. Harvard Business Press, 2004.
[26] H. Wu, J. Corney, and M. Grant, “Crowdsourcing Measures Of Design Quality,” in 34th Computers and Information in Engineering Conference (CIE), 2014.
[27] A. Banerjee, J. Quiroz, and S. Louis, “A model of creative design using collaborative interactive genetic algorithms,” Des. Comput. Cogn., pp. 397–416, 2008.
[28] C. Xu, S. Qin, and Z. Xiao, “Crowdsourcing based product innovation design service model for small-and medium-sized enterprises,” Autom. Comput. (ICAC), 2012 …, no. September, 2012.
[29] L. Sun, X. Wei, S. Chen, and Z. Yang, “Collaborative sketching in crowdsourcing design: a new method for idea generation,” in Int J Technol Des Educ (2015) 25:409–427, 2014, p. 19.
[30] K. Luther, J.-L. Tolentino, W. Wu, A. Pavel, B. P. Bailey, M. Agrawala, B. Hartmann, and S. P. Dow, “Structuring, Aggregating, and Evaluating Crowdsourced Design Critique,” in CSCW 2015, March 14–18, 2015, Vancouver, BC, Canada, 2015, p. 13.
[31] K. Grace, M. Lou Maher, J. Preece, T. Yeh, A. Stangle, and C. Boston, “A Process Model for Crowdsourcing Design: A Case Study in Citizen Science,” in Design Computing and Cognition ’14, 2014, p. 18.
[32] S. Pugh, Total Design: integrated methods for successful product engineering. Addison-Wesley Pub. Co., 1991. [33] G. Pahl, W. Beitz, J. Feldhusen, and K. Grote, Engineering design: a systematic approach. 2007.
[34] H. Wu, J. Corney, and M. Grant, “Relationship between quality and payment in crowdsourced design,” in Proceedings of the 2014 IEEE 18th International Conference on Computer Supported Cooperative Work in Design (CSCWD), 2014, pp. 499–504.
[35] G. Paolacci, J. Chandler, and P. Ipeirotis, “Running experiments on amazon mechanical turk,” Judgm. Decis. Mak., vol. 5, no. 5, pp. 411–419, 2010. [36] M. Kosinski and Y. Bachrach, “Crowd IQ: Measuring the intelligence of crowdsourcing platforms,” in WebSci ’12 Proceedings of the 3rd Annual ACM
Web Science Conference, NY, USA, 2012, pp. 151–160.
[37] a. P. Jagadeesan, a. Lynn, J. R. Corney, X. T. Yan, J. Wenzel, a. Sherlock, and W. Regli, “Geometric reasoning via internet CrowdSourcing,” 2009 SIAM/ACM Jt. Conf. Geom. Phys. Model. - SPM ’09, p. 313, 2009.
[38] J. R. Corney and C. Torres-Sanchez, “Putting the crowd to work in a knowledge-based factory,” Adv. Eng. Informatics, vol. 24, no. 3, pp. 243–250, Aug. 2010.
[39] J. Horton and L. Chilton, “The labor economics of paid crowdsourcing,” in Proceedings of the 11th ACM conference on EC’10, June 7–11, 2010, no. 1, pp. 209–218.
[40] C. Eickhoff and A. de Vries, “Increasing cheat robustness of crowdsourcing tasks,” Inf. Retr. Boston., vol. 16, no. 2, pp. 121–137, Feb. 2012. [41] A. Wang, C. D. V. Hoang, and M.-Y. Kan, “Perspectives on crowdsourcing annotations for natural language processing,” Lang. Resour. Eval., vol. 47,
no. 1, pp. 9–31, Mar. 2012.
[42] G. Little, L. B. Chilton, R. Miller, and M. Goldman, “TurKit : Tools for Iterative Tasks on Mechanical Turk,” IEEE Symp. Vis. Lang. HumanCentric Comput. VLHCC, no. Figure 1, pp. 252–253, 2009.
[43] G. Kazai, “In Search of Quality in Crowdsourcing for Search Engine Evaluation,” pp. 165–176, 2011.
[44] J. Nickerson, Y. Sakamoto, and L. Yu, “Structures for creativity: The crowdsourcing of design,” in CHI 2011 Workshop on Crowdsourcing and Human Computation: Systems, Studies, and Platforms, May 8, 2011, Vancouver, BC, Canada.
[45] L. Yu, “Crowd creativity through combination,” Proc. 8th ACM Conf. Creat. Cogn. - C&C ’11, p. 471, 2011. [46] M. Maher, “Design creativity research: From the individual to the crowd,” Des. Creat. 2010, 2011.
[47] “Amazon Mechanical Turk_Wikipedia,” 2013. [Online]. Available: http://en.wikipedia.org/wiki/Amazon_Mechanical_Turk#cite_note-awsdevforum-6. [48] G. McCracken, The Long Interview, Reprint. SAGE, 1988.
[49] L. B. Ludovic Lebart, A. Salem, Exploring Textual Data. Springer, 1998.
[50] R. R. Sinkovics, E. Penz, and P. N. Ghauri, “Analysing textual data in international marketing research,” Qual. Mark. Res. An Int. J., vol. 8, no. 1, pp. 9–38, 2005.
[51] P. Burnard, “Teaching the analysis of textual data: an experiential approach.,” Nurse Educ. Today, vol. 16, no. 4, pp. 278–281, 1996.
[52] P. Losiewicz, D. W. Oard, and R. N. Kostoff, “Textual data mining to support science and technology management,” J. Intell. Inf. Syst., vol. 15, no. 2, pp. 99–119, 2000.
[53] T. Basit, “Manual or electronic? The role of coding in qualitative data analysis,” Educ. Res., vol. 45, no. 2, pp. 143–154, Jun. 2003.