Aggregation of nanoparticles on one and two-component bilayer
membranes
David L. Cheung
Department of Pure and Applied Chemistry,
University of Strathclyde, Glasgow, G1 1XL, UK∗
Abstract
Using dissipative particle dynamics simulations the aggregation of nanoparticles on single and
two-component bilayers is investigated. For a uniform bilayer the aggregation of nanoparticles
depends strongly on the location of the particles in the bilayer; particles residing on the bilayer
exterior cluster strongly under the influence of bilayer-mediated interactions, whereas the
inter-action between the particles in the bilayer interior is significantly weaker leading to more loosely
bound, dynamic aggregates. The aggregation of nanoparticles on two-component bilayers
com-posed of immiscible components changes due to competition between nanoparticle clustering and
their adsorption on the boundary between the bilayer components. This reduces the size of the
nanoparticle clusters formed on the bilayer exterior, with the clusters adhering onto the boundary
between the bilayer components. Due to their weaker attraction nanoparticles in the interior of
a mixed bilayer no longer aggregate and instead form strings along the boundary between the
two bilayer components. Nanoparticles with an affinity to one bilayer component nucleate small
domains of their favoured component around themselves. For asymmetric mixtures this leads to a
I. INTRODUCTION
Polymer vesicles1, fluid filled sacs formed by polymer bilayers, may be considered as nanometre scale containers and have attracted much attention over the past decade for a range potential and current applications. In contrast to other polymer nanostructures, such as micelles, they can encapsulate both hydrophilic and hydrophobic molecules (in the fluid filled interior and core of the bilayer respectively) giving them more flexibility in delivery applications. Due to the larger size of the constituent molecules polymer vesicles possess higher mechanical stability than those formed by small lipid molecules and the properties of polymer vesicles may be further controlled through changes to polymer length.
As polymer vesicles consist of a bilayer enclosing a sac of fluid they are often thought of as being minimal models of biological cells. In comparison to synthetic bilayers, biological membranes possess a large degree of extra complexity. Rather than being a simple bilayer, the cell membrane is a complex mixture of different lipid types, as well as containing a variety of non-lipid molecules, such as cholesterol. The cell membrane is further complicated by the presence of membrane proteins, both attached to and embedded within it. There are also a number of additional structures that nature builds on top of the cell membrane. One example are the shells of inorganic nanoparticles that are built on the outside of many microogranisms such as calcium carbonate shells on the outside of coccoliths2
and silica shells on diatoms. Many bacterial produce similar structures though the formation of crystalline protein layers (so-called S-layers)3 on the exterior of their outer membranes.
In recent years there have been a number of studies aimed at incorporating some de-gree of this biological complexity into synthetic systems4. One notable example was the work of Christain et al who studied polymer vesicles and micelles formed from mixtures of poly(acrylic-acid)-poly(butadiene) and poly(ethyleneoxide)-poly(butadiene) copolymers5
. Addition of calcium ions leads to strong lateral phase separation in the vesicles, causing the appearance of patchy and Janus vesicles, depending on the vesicle composition and solution conditions. Using coarse-grain molecular dynamics simulations Pantano et al rationalised this due to local structural rearrangements caused by the polyvalent calcium ions6. The patchy structure, with feature sizes on the order of microns, is reminiscent of domains that have been observed in lipid vesicles create in vitro. These domains are significantly larger than those found in cell membranes. The disparity in size may be attributable to
brane proteins nucleating or stabilising these small domains, non-equilibrium recycling7 or coupling between membrane curvature and domain formation8.
The adhesion of particles onto polymer vesicles has also attracted attention9. Chen et
al showed it is possible to create armoured vesicles by adhering negitively charged colloidal particles onto positively charged polymer vesicles10
. Simple Monte Carlo simulations were used to study the packing of binary mixtures of particles on the vesicles, pointing out the key role played by electrostatic repulsion between particles on their packing. For smaller particles adhesion onto vesicles can also lead to changes in the bilayer structure. Binder et al showed that by changing nanoparticle hydrophobicity it is possible to guide the location of these in the vesicle11. Through adding anionic nanoparticles onto phospholipid vesicles Wanget alshowed that it was possible to induce reconstruction of the vesicle and formation of patchy domains12, similar to the work of Christian et al5. While these studies have examined single component vesicles recently it has been generalised to mixed vesicles which exhibit macroscopic phase separation. When membrane binding proteins are added to these mixed vesicles their structure changes, reflecting a decrease in the line tension between the different domains13. This was attributed to the proteins adhering to the interface between the different lipid domains and reducing the interfacial free energy, in a manner reminiscent of the adhesion of colloids or nanoparticles onto liquid-liquid interfaces in the formation of Pickering emulsions14.
A number of molecular simulation studies have been performed on nanoparticle-bilayer systems. Due to the interest in the use of nanoparticles in biomedical applications15, such as drug delivery or medical imaging, and on the potential toxic effects of nanomaterials, many of these have focused on how nanoparticles penetrate bilayers. Much of this work has focused on the translocation of individual nanoparticles16–18or changes to bilayer struc-ture induced by nanoparticles19
Likos have investigated effect of membrane fluctuations on self-assembly of virus capsids25 and clathrin26. Most closely related to this paper Reynwar and Desereno27 have studied the aggregation of model proteins on a symmetric two-component bilayer close to demixing and found composition-driven formation of protein clusters.
In this paper molecular simulation is used to study the aggregation of small (∼nm) nanoparticles on model bilayer membranes. The aggregation of nanoparticles on uniform polymer bilayers will be discussed, focusing on how the location within the bilayer affects the clustering of the nanoparticles. Next the aggregation of nanoparticles on phase separated bilayers will be examined, in particular showing that these tend to aggregate on the boundary between the two components. Finally the behaviour of nanoparticles on bilayers composed of two miscible components is investigated.
II. SIMULATION DETAILS
A. Methodology
The system was simulated using dissipative particle dynamics simulations (DPD)28 . The interaction between two beads is given by
Fij =Fc ij +F
D ij +F
R
ij (1)
where the right hand terms are the conservative, dissipative, and random forces respectively.
The conservative force is given by the usual soft, repulsive form29
Fij =Aij
1−
r
rc
ˆ
rij =Aijw(r) ˆrij (2)
where Aij is the repulsion strength between two beads (see below), r = |rij|, and rc is the bead size. To enforce the polymer topology bonds between bonded monomers are modelled using harmonic springs
Fspring=−krij (3)
where k = 2 kBT rc−2 is the force constant. Note no bond angle bending potentials are applied.
FD
ij and FijR are given by
FD
ij =−γw 2
(r)( ˆrij.vij) ˆrij (4a)
FR ij =
σw(r)R
√
δt ˆ
rij (4b)
where γ is the damping coefficient (γ = 4.5kBT τ rc−2), σ = √2kBT γ is the random force strength, R is a Gaussian random number (with zero mean and variance of one), and δt is the timestep.
B. Model
The simulated system contained 144000 beads in total in a cuboidal box measuring 40rc ×40rc ×30rc (corresponding to a number density ρ = 3r−c3). It contained a single bilayer consisting of 1920 H8T12 polymer chains (960 in each leaflet, which corresponds to the zero surface tension state for a single component bilayer) and up to 80 nanoparticles, corresponding to between 24 and 192 polymer chains per nanoparticle, comparable to previ-ous work20. For particles that reside on the bilayer exterior these were split equally between the two leaflets. Each nanoparticle was a rigid FCC array of interaction sites of radius 1.5rc (containing 44 interaction sites in total). The spacing between the interaction sites (0.55rc) was sufficient to ensure that no solvent beads entered the nanoparticle interior.
The interaction parameters were derived from those of Groot and Rabone30
. In all cases the repulsion strength between identical particles was set to Aii = 78kBT r−c1,while for in-teractions between the solvent and head, tail, and nanoparticle the repulsion parameter was set to AHS = 79.3kBT r−c1, AT S = 104kBT r−c1 and AN S = 90kBT rc−1, while for the head-tail interaction AHT = 86.7kBT r−c1 (rc is the same for all interactions, which following the map-ping of Groot and Rabone rc ∼ 6.46 ˚A). To model two-component bilayers the repulsion strength between either the head or tail beads in unlike polymers is increased (with the other repulsion parameters unchanged). For unlike head groups AHH′ values of 90kBT rc−1 or 80kBT rc−1 were used, while for unlike tail groups AT T′ values of 85kBT r−c1 or 79kBT rc−1
case. It should be noted that while these values were not chosen to match a specific ex-perimental system a number of schemes for determining DPD interaction parameters from experimental data31,32 which generally give values for bead-bead repulsion similar to these. Two different bilayer compositions were investigated, xb = 0.50 (symmetric) and xb = 0.25 (asymmetric). Simulations of mixed bilayers in the absence of nanoparticles indicate that phase separation between the two components is seen for AHH′ = 84kBT rc−1 (xb = 0.50)
and AHH′ = 85kBT rc−1 (xb = 0.25) for unlike heads and AT T′ = 82kBT r−c1 (xb = 0.50) and AT T′ = 84kBT rc−1 (xb = 0.25) for unlike tails. Throughout this paper the two compo-nents will be referred to as A and B (where in the asymmetric mixture B is the minority component) respectively.
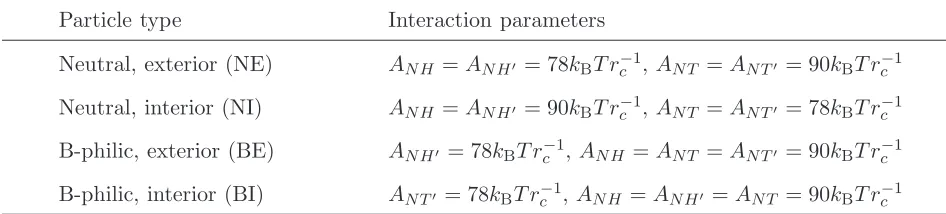
Four different types of nanoparticles were considered depending on their preferred lo-cation in the bilayer (either in the bilayer exterior or interior) and affinity for the bilayer components (either neutral or with a preference for the minority B component). To en-sure the location of the nanoparticles in their preferred location the repulsion parameter between the nanoparticle beads and their preferred component is set to 78kBT rc−1 (i.e. the nanoparticle is treated as chemically identical to its preferred component) while the repul-sion parameters for the other interactions are set to 90kBT r−c1 which was large enough to restrict them to the bilayer interior or exterior as appropriate. The interaction parameters for each of these cases are given in Table I.
Particle type Interaction parameters
Neutral, exterior (NE) AN H =AN H′ = 78kBT r−c1,AN T =AN T′ = 90kBT r−c1
[image:6.595.71.544.478.585.2]Neutral, interior (NI) AN H =AN H′ = 90kBT r−c1,AN T =AN T′ = 78kBT r−c1 B-philic, exterior (BE) AN H′ = 78kBT rc−1, AN H =AN T =AN T′ = 90kBT r−c1 B-philic, interior (BI) AN T′ = 78kBT rc−1,AN H =AN H′ =AN T = 90kBT r−c1
TABLE I. Interaction parameters for nanoparticle-polymer interactions.
For all systems the initial state was a flat bilayer with polymers randomly placed in thexy -plane in a fully extended configuration. Nanoparticles were randomly inserted in the bilayer at the boundary between the head and tail blocks. For mixed bilayers the two components were placed randomly (corresponding to an initially well mixed state). A short energy minimisation and DPD run (with uniform interaction parameters) was performed before the
repulsion between unlike polymers was applied. For each system three simulations starting from different initial configurations were performed, with final results obtained by averaging over these. Each simulation was run for 106
−2×10⁶timesteps, where a time stepδt= 0.02t∗, was used. Following Groot and Rabone t∗ = 88 ps. All simulations were performed using
the lammps molecular dynamics package33. It should be noted that in these simulations
the cross-sectional area of the bilayer was held constant. While simulations of bilayers at constant surface tension are commonly used, only minor distortions in the shape of the bilayer were observed (Fig. 1) suggesting that the results are unlikely to be qualitatively changed by this choice.
III. NANOPARTICLE AGGREGATION ON UNIFORM BILAYERS
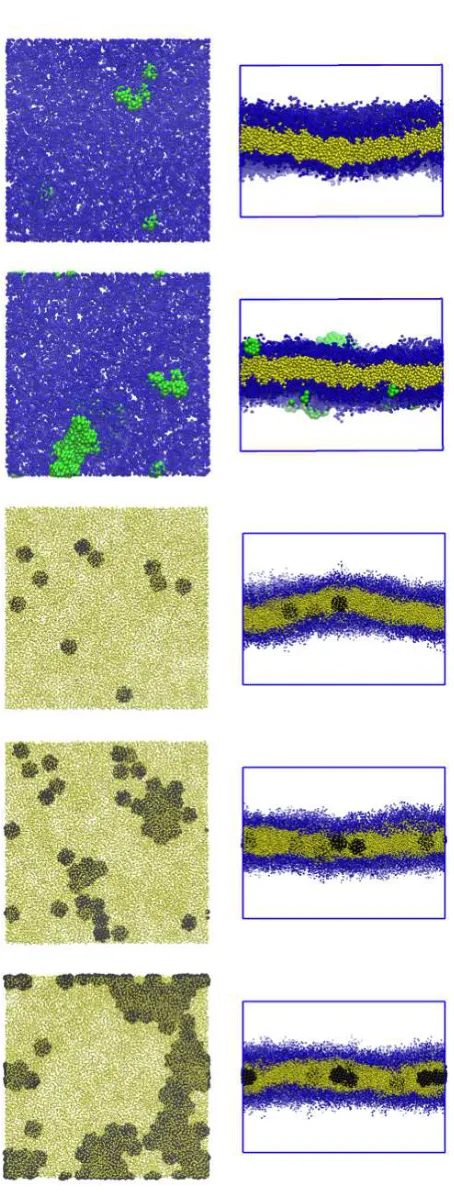
While nanoparticles both on the exterior of the bilayer and in the bilayer interior have a tendency to aggregate, the degree of this is strongly dependent on the location of the nanoparticles in the bilayer (Fig. 1). For particles on the bilayer exterior cluster formation is observed for even small numbers of particles, indicating a strong attraction between the particles. By contrast for small Npar particles in the bilayer interior show little tendency to aggregate, reflecting a weaker interaction between the particles in the interior. Side on views of the bilayers show that the addition of particles causes little distortion to the bilayer; in particular the bilayer appears approximately flat for the different systems studied.
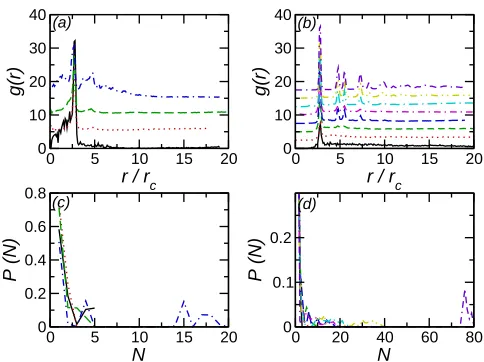
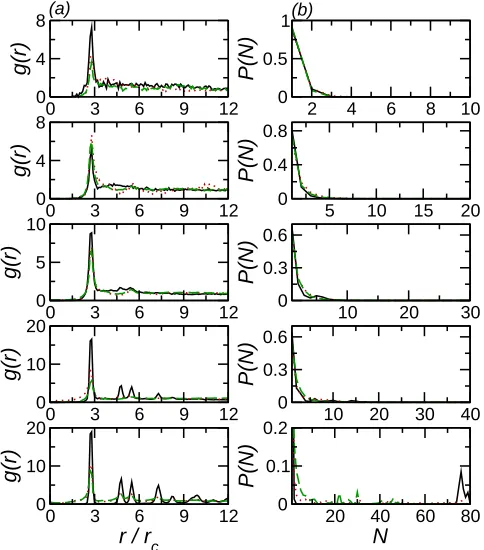
The aggregation of particles on the bilayer may be examined more quantitatively through radial distribution functions and histograms of nanoparticle cluster sizes. Due to the quasi-two-dimensional nature of the bilayer throughout this paper we only consider the in-plane RDF (as a function of the separation between nanoparticles in the plane of the bilayer). The tendency of nanoparticles to cluster strongly may be seen from the large peak in the in-plane RDF (Fig. 2(a)), which is largest for small particle numbers. Increasing Npar reduces the height of this peak. There is also some additional structure at larger r for larger particle number, which appears somewhat diffuse. This indicates that there is a lack of long-range order, suggesting that these larger clusters have a disordered structure.
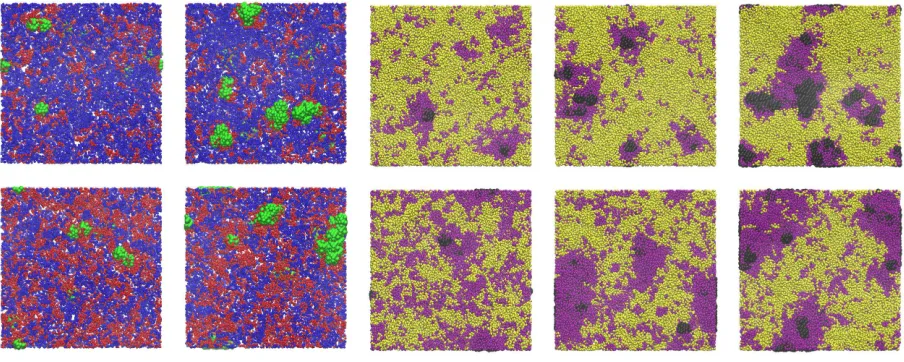
FIG. 1. Simulation snapshots showing representative configurations for (top to bottom) NE
nanoparticles with Npar= 10, NE nanoparticles with Npar= 40, NI nanoparticles with Npar= 10, NI nanoparticles with Npar = 40, and NI nanoparticles with Npar = 80. Left hand column shows top down view, right hand column side view. In all cases blue, yellow, green, and black spheres
0 5 10 15 20
r / rc
0 10 20 30 40
g(r)
0 5 10 15 20
r / rc
0 10 20 30 40
g(r)
0 5 10 15 20
N
0 0.2 0.4 0.6 0.8
P (N)
0 20 40 60 80
N
0 0.1 0.2
P (N)
(a) (b)
(d) (c)
FIG. 2. (a) RDF for NE nanoparticles on uniform bilayer. Solid line (black) denotes Npar = 10, dotted line (red) denotes Npar = 20, dashed line (green) denotes Npar = 30, and dot-dashed line denotes Npar = 40. For clarity successive curves have been shifted by 5 along the y-axis. (b) RDF for NI nano particles on uniform bilayer. Solid line (black) denotes Npar = 10, dotted line (red) denotes Npar = 20, dashed line (green) denotes Npar = 30, long-dashed line (blue) denotes
Npar = 40, dot-dashed line (magenta) denotes Npar = 50, dot-long-dashed line (cyan) denotes
Npar = 60, double-dot-dashed line (yellow) denotesNpar = 70, and dot-double-dashed line (violet) denotes Npar = 80. For clarity successive curves have been shifted by 2.5 along the y-axis. (c) Nanoparticle cluster size histograms for NE nanoparticles on uniform bilayers. Symbols as in (a).
(d) Nanoparticle cluster size histograms for NI nano particles on uniform bilayers. Symbols as in
(b).
the particles behave as a 2D liquid. Above Npar= 40 a number of well-defined peaks appear at larger separations in the RDF. The spacing between these peaks suggests local hexagonal ordering of the nanoparticles, which may be seen from the simulation snapshots (Fig. 1).
[image:9.595.184.426.68.249.2]Reflecting the weaker interactions between particles the cluster size distributions for par-ticles in the bilayer interior are broader than those for parpar-ticles on the exterior (Fig. 2(d)). For small Npar the cluster size distribution is peaked at N = 1 with a rapid decay. As
Npar increases peaks in the distribution at larger N, indicating the existence of finite sized aggregates. For the largest studied Npar the cluster size distribution suggests the formation of a single system spanning cluster (containing ∼75−80 particles) are found, with a small number of isolated particles. This transition to an infinitely-large cluster above a critical density is consistent with aggregation in two-dimensional systems34.
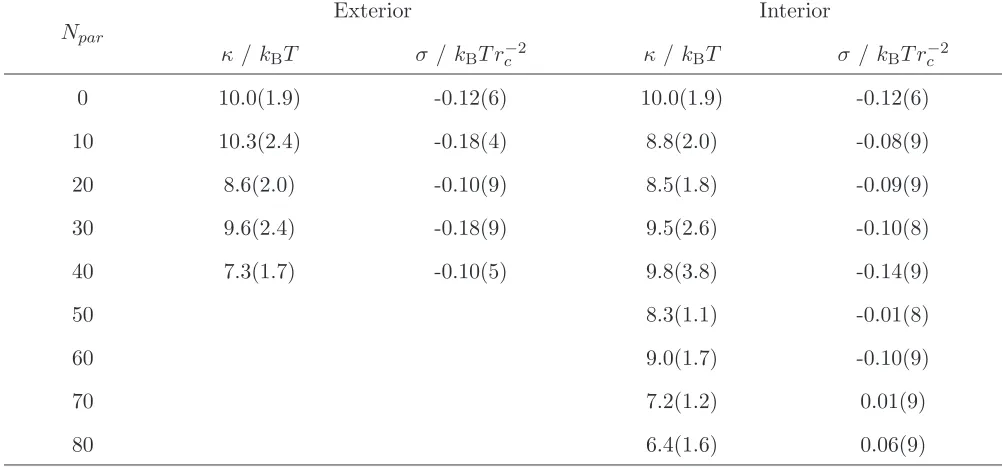
The difference in the interaction between nanoparticles on the bilayer exterior and interior may be due to differences in the bilayer bending modulus κ35,36. From simulation κ may be extracted from the fluctuation spectrum of bilayer undulations37,38
(Table II). κ is generally similar for bilayers with both interior and exterior nanoparticles and it tends to decrease with increasing Npar. For low particle numbers, where the analytic expressions for the bilayer-induced interactions generally valid, κ is larger for the bilayer with exterior nanoparticles compared to the interior case, which is consistent with the stronger interaction between the nanoparticles seen in that case. The bilayer surface tension, calculated from the difference between the normal and transverse pressures are also presented in Table II. In all cases this is small suggesting that the bilayers are close to the zero surface tension state.
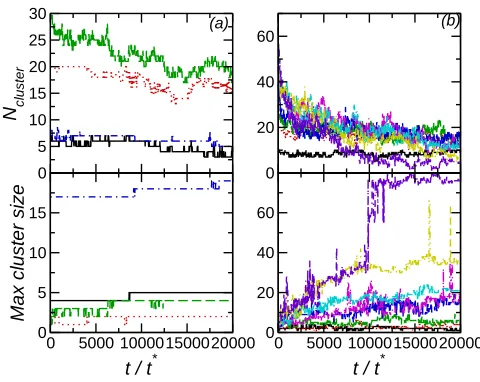
The difference in interactions between particles on the bilayer exterior and interior also affects how the numbers and sizes of clusters vary with time. When the particles are on the exterior both the number of clusters and largest cluster size show little variation with time, which is particularly noticeable forNpar = 10 when maximum cluster size is 4-5. This corresponds to the particles in one leaflet forming a single long-lived cluster, due to the strong interparticle interactions. For interior nanoparticles both Ncluster and the maximum cluster size show more variation with time, reflecting that the nanoparticles are less strongly bound allowing these to dynamically join and leave clusters. The formation of a single nanoparticle cluster for the Npar = 80 system can be clearly seen in the sudden jump in the maximum cluster size to∼75−80 approximately half way through the simulation.
Npar
Exterior Interior
κ /kBT σ /kBT r−c2 κ/ kBT σ /kBT r−c2
0 10.0(1.9) -0.12(6) 10.0(1.9) -0.12(6)
10 10.3(2.4) -0.18(4) 8.8(2.0) -0.08(9)
20 8.6(2.0) -0.10(9) 8.5(1.8) -0.09(9)
30 9.6(2.4) -0.18(9) 9.5(2.6) -0.10(8)
40 7.3(1.7) -0.10(5) 9.8(3.8) -0.14(9)
50 8.3(1.1) -0.01(8)
60 9.0(1.7) -0.10(9)
70 7.2(1.2) 0.01(9)
[image:11.595.70.571.80.314.2]80 6.4(1.6) 0.06(9)
TABLE II. Calculated surface tension and bending modulus for uniform bilayers. Figures in
parenthesis give the estimated error in the final digit(s). For σ the error was taken to be the
standard error of the mean (taken over 25000 measurements).
IV. PARTICLES ADHERE TO BOUNDARIES IN PHASE SEPARATED
BILAY-ERS
0 5 10 15 20 25 30
N cluster
0 20 40 60
0 5000 100001500020000
t / t*
0 5 10 15
Max cluster size
0 5000 100001500020000
t / t*
0 20 40 60
(a) (b)
FIG. 3. (a) Time series of number of nanoparticle clusters (top) and largest cluster size (bottom)
for NE nanoparticles. (b) Time series of number of nanoparticle clusters (top) and largest cluster
size (bottom) for NI nanoparticles.
smaller clusters.
In contrast to the single component bilayer nanoparticles in the interior of a phase sepa-rated bilayer show little tendency to cluster in two component bilayers. Instead they adhere individually onto the boundary between the two components. The structures of the bilayers (shown in Fig. 6) resemble a two-dimensional analogue of a particle stabilised emulsion39.
The adsorption of nanoparticles onto the boundary between the two bilayer components
boundary between the two components creates closely packed nanoparticle layers. These
layers inhibit domain coalescence increasing the stability of smaller domains. The tendency for particles to adhere individually is reflected in the RDFs (Fig. 7(a)). For small numbers of particles the first peak is significantly smaller than for the uniform bilayer and there is a complete lack of structure beyond this. For larger particle numbers some additional structure is present in the RDF at larger r, however, this is much weaker than in the sin-gle component bilayer. This suggests that the decrease in interfacial free energy caused by nanoparticle adsorption at the boundary between the bilayer components is greater than the weak attractive interaction that drives nanoparticle aggregation. For small numbers of particles the nanoparticle cluster size distribution is largely identical for both uniform and phase separated bilayers (Fig. 7(b)), which differs from the exterior case. As Npar increases differences between the cluster size distributions for the uniform and phase separated
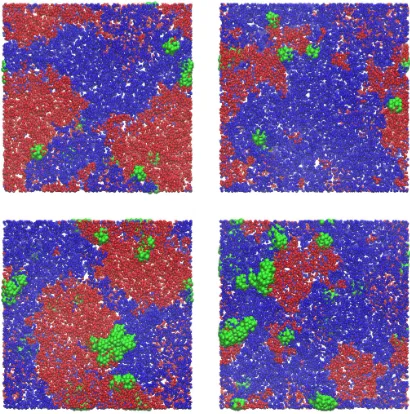
[image:12.595.184.424.69.260.2]FIG. 4. Simulation snapshots showing representative configurations for NE nanoparticles on phase
separated bilayers with (top to bottom) Npar = 10 and xb = 0.50, Npar = 40 and xb = 0.50,
Npar = 10 and xb = 0.25, and Npar = 40 and xb = 0.25. Blue, red, and green spheres denote A-head, B-head, and NP beads respectively.
ers appear, with fewer large clusters forming for the phase separated systems, again caused by competition between cluster formation and adsorption at the boundary.
In order to rationalise the difference between the aggregation of nanoparticles in the two cases it is useful to compare the free energy of adsorption of a nanoparticle on the boundary to the interaction strength between nanoparticles. From simulation of completely phase separated bilayers the line tension between the two components may be estimated from the difference between the normal and transverse pressures (in the bilayer plane)
τ = 1
2LxLz
(Pyy−Pxx) (5)
where the interface between the two-components is parallel to the x-axis. Using this the line tension between the two components is τ = 0.13kBT r−c1 for AHH′ = 90.0kBT rc−1 and
τ = 3.92kBT rc−1 forAT T′ = 85.0kBT rc−1. Estimating the free energy of adsorption of a single nanoparticle as
0 3 6 9 12 0 10 20 30 40 g(r)
1 2 3 4 5
0 0.2 0.4 0.6 0.8 P(N)
0 3 6 9 12
0 10 20 30
g(r)
2 4 6 8 10
0 0.2 0.4 0.6 0.8 P(N)
0 3 6 9 12
0 5 10 15 20 g(r)
2 4 6 8 10
0 0.2 0.4 0.6 0.8 P(N)
0 3 6 9 12
r / rc
0 5 10 15 20 g(r)
5 10 15 20
N 0 0.2 0.4 0.6 P(N) (b) (a)
FIG. 5. (a) RDF for NE particles on mixed bilayers for (top to bottom) Npar = 10, Npar = 20,
Npar = 30, and Npar = 40. In all cases solid line (black) denotes uniform bilayer, dotted line (red) denotes xb = 0.50, and dashed line (green) denotes xb = 0.25. (b) Nanoparticle cluster size distributions for NE particles on mixed bilayers for (top to bottom) Npar = 10, Npar = 20,
Npar = 30, andNpar = 40. Symbols as in (a).
whereR= 1.5rc is the nanoparticle radius. Using this gives ∆Fads = 0.38kBT and 11.80kBT for unlike heads and tails respectively. The interaction strength between the nanoparticles may be estimated from the potential of mean force, which in the limit of low nanoparticle concentrations may be found from
P M F(r) =−kBT logg(r) (7)
The strength of the interaction between two nanoparticles can be estimated from the different between the PMF at first peak in the RDF and at infinite separation; for nanoparticles on the exterior of a uniform bilayer we then have ∆P M F = 4.82kBT while for nanoparticles in the bilayer interior we have ∆P M F = 2.54kBT. For particles in the bilayer interior this interaction strength is significantly smaller than the adsorption free energy, which is consistent with the adsorption of nanoparticles individually onto the boundary. By contrast the interaction strength between nanoparticles on the bilayer exterior is larger than the adsorption free energy for individual nanoparticles so in this case the nanoparticles remain bound into clusters, which adsorb onto the boundary (the adsorption free energy of these
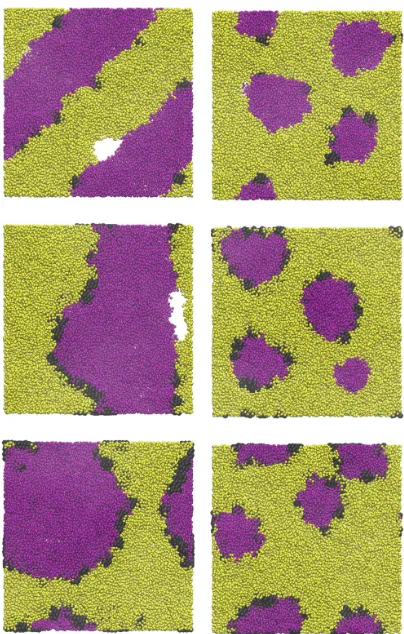
[image:14.595.184.426.70.271.2]FIG. 6. Simulation snapshots showing representative configurations for NI nanoparticles on phase
separated bilayers with (top to bottom) Npar = 10, Npar = 40 and Npar = 80. Snapshots for
xb = 0.50 in the left hand column, snapshots forxb= 0.25 in right hand column. For clarity head beads are omitted (note white areas denote regions where head beads are in the bilayer interior
and do not correspond to pores or voids in the bilayer). Yellow, purple, and black spheres denote
A-tail, B-tail, and NP beads respectively.
clusters being larger than individual nanoparticles by virtue of their larger size).
V. PARTICLES CAN NUCLEATE DOMAINS IN MIXED BILAYERS
com-0 3 6 9 12 0
4 8
g(r)
2 4 6 8 10
0 0.5 1
P(N)
0 3 6 9 12
0 4 8
g(r)
5 10 15 20
0 0.4 0.8
P(N)
0 3 6 9 12
0 5 10
g(r)
10 20 30
0 0.3 0.6
P(N)
0 3 6 9 12
0 10 20
g(r)
10 20 30 40
0 0.3 0.6
P(N)
0 3 6 9 12
r / rc 0
10 20
g(r)
20 40 60 80
N 0 0.1 0.2 P(N) (a) (b)
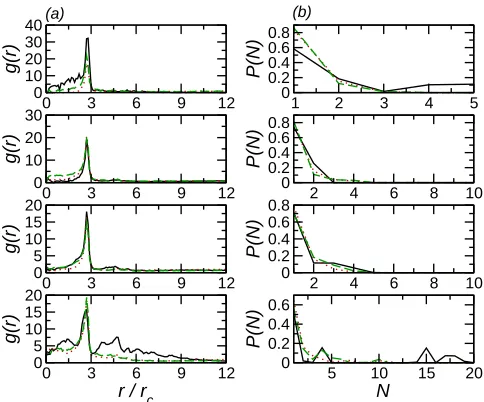
FIG. 7. (a)RDF for NI particles on mixed bilayers for (top to bottom) Npar = 10, Npar = 20,
Npar = 30,Npar = 40, andNpar = 80 . In all cases solid line (black) denotes uniform bilayer, dotted line (red) denotes xb = 0.50, and dashed line (green) denotes xb = 0.25. (b) Nanoparticle cluster size distributions for NE particles on mixed bilayers for (top to bottom) Npar = 10, Npar = 20,
Npar = 30,Npar= 40, andNpar= 80. Symbols as in (a).
ponents tend to remain in the bulk of their favoured phase. For bilayers composed of immiscible components non-neutral particles have little effect on the phase separation, with the particles remaining far from the interface. For miscible polymers, however, nanoparticles with an affinity for one phase nucleate domains of their favoured phase around them, as is shown in Fig. 8. Such behaviour is similar to that seen by Reynwar and Deserno27for model proteins on a symmetric, near-critical mixed bilayer. Experimentally the ability of proteins to induce phase separation in mixed bilayers has been observed in a number of systems40,41.
This formation of small domains affects the clustering of nanoparticles. For Npar ≥ 20 the peak in the RDF is larger for the two-component bilayers than in the uniform case (Fig. 9(a)). This suggests the presence of an attractive composition-mediated interaction, in agreement with previous simulations27. For intermediate numbers of particles this also
[image:16.595.185.427.72.347.2]FIG. 8. Simulation snapshots showing representative configurations for (left to right) BE
nanopar-ticles with Npar = 10, BE nanoparticles with Npar = 40, BI nanoparticles with Npar = 10, BI nanoparticles with Npar= 40, and BI nanoparticles withNpar= 80. Top showsxb = 0.25, bottom showsxb = 0.50. Colours as in Figs. 4 and 6.
leads to the formation of slightly larger nanoparticle clusters (Fig. 9(b)). Interestingly for the largest particle number studied the clusters formed in the two-component bilayer are smaller than in the uniform case. This suggests that the clustering may be size-limited possibly due to competition between the tendency for the effective attraction between the particles and B-heads leading and entropic gain in having the two components uniformly mixed.
0 5 10 15 20 0 10 20 30 40 g(r)
1 2 3 4 5
0 0.2 0.4 0.6 0.8 P(N)
0 3 6 9 12
0 10 20 30
g(r)
2 4 6 8 10
0 0.2 0.4 0.6 0.8 P(N)
0 3 6 9 12
0 10 20 30
g(r)
2 4 6 8 10
0 0.2 0.4 0.6 0.8 P(N)
0 3 6 9 12
r / rc
0 10 20 30
g(r)
5 10 15 20
N 0 0.2 0.4 0.6 P(N) (b) (a)
FIG. 9. (a) RDF for BE nanoparticles with (top to bottom) Npar = 10, Npar = 20, Npar = 30, and Npar = 40. Solid line (black) denotes uniform bilayer, dotted line (red) denotes xb = 0.50, and dashed line (green) denotes xb = 0.25. (b) Nanoparticle cluster size distributions for BE nanoparticles with (top to bottom) Npar = 10, Npar= 20, Npar = 30, and Npar= 40. Symbols as in (a).
again suggestive of stronger composition mediated interactions.
VI. CONCLUSIONS
Using dissipative particle dynamics simulations the aggregation of nanoparticles on one and two component model bilayers has been studied. For single component bilayers the aggregation of particles depends strongly on whether they reside in the bilayer exterior or interior. Particles on the bilayer exterior exhibit a strong attraction, which leads to the formation of tightly bound clusters, which remain bound over long timescales. Particles in the bilayer interior form less strongly bound, more dynamic clusters, suggesting that the inter particle interactions are weaker in this case. For small Npar particles tend to exist as isolated particles, with only a few larger aggregates, while for the largest number of particles they form a single large cluster, with a few isolated particles, as would be expected for two-dimensional aggregation.
When the bilayer consists of two immiscible components the particles without an
[image:18.595.184.426.70.271.2]0 3 6 9 12 0 10 20 30 40 g(r)
2 4 6 8 10
0 0.5 1
P(N)
0 3 6 9 12
0 10 20 30
g(r)
5 10 15 20
0 0.4 0.8
P(N)
0 3 6 9 12
0 10 20 30
g(r)
10 20 30
0 0.3 0.6
P(N)
0 3 6 9 12
0 10 20
g(r)
10 20 30 40
0 0.3 0.6
P(N)
0 3 6 9 12
r / rc 0
10 20
g(r)
20 40 60 80
N 0 0.1 0.2 P(N) (a) (b)
FIG. 10. (a) RDF for BI nanoparticles with top to bottom) Npar = 10, Npar = 20, Npar = 30,
Npar = 40, and Npar = 80. Solid line (black) denotes uniform bilayer, dotted line (red) denotes
xb = 0.50, and dashed line (green) denotesxb= 0.25. (b) Nanoparticle cluster size distributions for BI nanoparticles with top to bottom)Npar= 10,Npar = 20,Npar = 30,Npar= 40, and Npar= 80. Symbols as in (a).
ity to either component tend to cluster at the boundary between these. Particles on the bilayer exterior remain bound in clusters with these clusters attaching to the boundary. The tendency of particles to cluster is weaker than on single component bilayers, possibly due to competition between particle clustering and adsorption onto the boundary. Due to their weaker interactions formation of clusters is suppressed for nanoparticles in the bilayer interior with these instead forming lines along the boundary, acting in a similar manner to nanoparticles at fluid interfaces in three dimensions39. This suggests that the desire to re-duce the interfacial free energy (due to the line tension between the two bilayer components) is stronger than particle-particle interaction.
[image:19.595.184.427.72.347.2]phase around them, consistent with experimental simulation studies of proteins in mixed lipid bilayers. For particles in the bilayer exterior this leads to an increase in the attraction between the nanoparticles. This, however, is accompanied by a decrease in the ordering at longer range, with similar behaviour being seen for particles in the bilayer interior. While only one value of the repulsion between unlike polymers (i.e. AHH′ or AT T′) for each of
the cases is presented here, preliminary simulations for unlike polymers without an excess repulsion (i.e. AHH′ =AHH =AH′H′ andAT T′ =AT T =AT′T′) have shown that in this case
nanoparticles with an affinity for one component may also nucleate domains. How the sizes of these domains vary with the repulsion between the unlike polymers and how sensitive this is to the nanoparticle-polymer interaction will be investigated more fully in future work.
This work demonstrates that composition changes and ordering of nanoparticles on mul-ticomponent bilayer membranes are coupled and that this may be used to control the ag-gregation of nanoparticles adsorbed on them. In particular the formation of linear and circular arrays of nanoparticles at the boundary between demixed polymer membranes may be used to form nanostructures for optical or electronic applications42. Particles with an affinity for one bilayer component cluster together due to composition driven interactions, which may be used to template the formation of polymer domains. Although this work has demonstrated this possibility future work will more fully explore how the nucleation of these domains is affected by chaining the affinity of the particles for the different components and the repulsion between the unlike components. This paper has focused on the aggregation of nanoparticles on bilayers it may be expected that nanoparticles may be used to control phase separation in mixed bilayers. While study of the interfacial length and other quanti-ties suggest that this is possible the results are still inconclusive (not shown here) and more exhaustive simulations, using constant surface tension rather than surface area simulations, would be necessary to fully explore this. This would also allow for the investigation of the effect of bilayer flexibility on the phase behaviour and ordering of nanoparticles.
ACKNOWLEDGEMENTS
Some of these results were obtained using the EPSRC funded ARCHIE-WeSt High Per-formance Computer (EPSRC grant no. EP/K000586/1). Simulation snapshots were created
using VMD43
1 D. E. Discher and A. Eisenberg, Science297, 967 (2002).
2 J. R. Young, H. Andruleit, and I. Probert, Journal of Phycology 45, 213 (2009).
3 U. B. Sleytr, E. M. Egelseer, N. Ilk, D. Pum, and B. Schuster, FEB-Journals274, 323 (2007).
4 X. Zhang, P. Tanner, A. Graff, C. G. Palivan, and W. Meier, Journal of Polymer Science Part
A: Polymer Chemistry 50, 2293 (2012).
5 D. A. Christian, A. Tian, W. G. Ellenbroek, I. Levental, K. Rajagopal, P. a. Janmey, A. J. Liu,
T. Baumgart, and D. E. Discher, Nature materials 8, 843 (2009).
6 D. A. Pantano, M. L. Klein, D. E. Discher, and P. B. Moore, Journal of Physical Chemistry B
115, 4689 (2011).
7 M. Turner, P. Sens, and N. Socci, Physical Review Letters 95, 168301 (2005).
8 S. Meinhardt, R. L. C. Vink, and F. Schmid, Proceedings of the National Academy of Sciences
110, 4476 (2013).
9 M. Schulz, A. Olubummo, and W. H. Binder, Soft Matter 8, 4849 (2012).
10 R. Chen, D. J. G. Pearce, S. Fortuna, D. L. Cheung, and S. A. F. Bon, Journal of the American
Chemical Society133, 2151 (2011).
11 W. H. Binder, R. Sachsenhofer, D. Farnik, and D. Blaas, Physical chemistry chemical physics
9, 6435 (2007).
12 B. Wang, L. Zhang, S. C. Bae, and S. Granick, Proceedings of the National Academy of Science
105, 18171 (2008).
13 J. B. Hutchison, R. M. Weis, and A. D. Dinsmore, Langmuir28, 5176 (2012).
14 S. U. Pickering, Journal of Chemical Society Transactions91, 2001 (1907).
15 Y. Yan, G. K. Such, A. P. R. Johnston, J. P. Best, and F. Caruso, ACS Nano6, 3663 (2012).
16 Y. Li, X. Chen, and N. Gu, Journal of Physical Chemistry. B112, 16647 (2008).
17 H.-M. Ding, W.-d. Tian, and Y.-Q. Ma, ACS Nano6, 1230 (2012).
18 T. H. F. Thake, J. R. Webb, A. Nash, J. Z. Rappoport, and R. Notman, Soft Matter9, 10265
(2013).
20 A. Alexeev, W. E. Uspal, and A. C. Balazs, ACS Nano2, 1117 (2008).
21 T. Yue and X. Zhang, ACS Nano 6, 3196 (2012).
22 A. ˇSari´c and A. Cacciuto, Soft Matter 9, 6677 (2013).
23 A. ˇSari´c and A. Cacciuto, Physical Review Letters108, 118101 (2012).
24 P. G. Dommersnes and J. Fournier, European Physical Journal B 12, 9 (1999).
25 R. Matthews and C. N. Likos, Physical Review Letters 109, 178302 (2012).
26 R. Matthews and C. N. Likos, Soft Matter 9, 5794 (2013).
27 B. J. Reynwar and M. Deserno, Biointerphases 3, FA117 (2008).
28 P. J. Hoogerbrugge, J. M. V. a. Koelman, and A. B. Rijswijk, Europhysics Letters (EPL) 19,
155 (1992).
29 R. D. Groot and P. B. Warren, Journal of Chemical Physics 107, 4423 (1997).
30 R. D. Groot and K. L. Rabone, Biophysical Journal81, 725 (2001).
31 A. Maiti and S. McGrother, The Journal of chemical physics120, 1594 (2004).
32 K. P. Travis, M. Bankhead, K. Good, and S. L. Owens, The Journal of chemical physics 127,
014109 (2007).
33 S. Plimpton, Journal of Computational Physics 117, 1 (1995).
34 J. N. Israelachvili, Intermolecular and surface forces (Academic Press, 2011), 3rd ed.
35 M. Goulian, R. Bruinsma, and P. Pincus, Europhysics Letters 22, 145 (1993).
36 J. Fournier and P. G. Dommersnes, Europhysics Letters 39, 681 (1997).
37 E. Lindahl and O. Edholm, Biophysical Journal79, 426 (2000).
38 W. K. den Otter and W. J. Briels, The Journal of Chemical Physics 118, 4712 (2003).
39 B. P. Binks, Current Opinion in Colloid & Interface Science 7, 21 (2002), ISSN 13590294.
40 A. T. Hammond, F. A. Heberle, T. Baumgart, D. Holowka, B. Baird, and G. W. Feigenson,
Proceedings of the National Academy of Sciences of the United States of America 102, 6320
(2005).
41 T. Baumgart, S. T. Hess, and W. W. Webb, Nature 425, 821 (2003).
42 C. H. Lee, A. J. Crosby, R. C. Hayward, and T. Emrick, ACS applied materials & interfaces6,
4850 (2014), ISSN 1944-8252.
43 W. Humphrey, A. Dalke, and K. Schulten, Journal of Molecular Graphics 14, 33 (1996).