A data management platform for personalised real-time energy
feedback
David Murray
1, Jing Liao
1, Lina Stankovic
1, Vladimir Stankovic
1, Richard
Hauxwell-Baldwin
2, Charlie Wilson
2, Michael Coleman
3, Tom Kane
3, Steven
Firth
3University of Strathclyde
1, University of East Anglia
2, Loughborough
University
3Abstract
This paper presents a data collection and energy feedback platform for smart homes to enhance the value of information given by smart energy meter data by providing user-tailored real-time energy consumption feedback and advice that can be easily accessed and acted upon by the household. Our data management platform consists of an SQL server back-end which collects data, namely, aggregate power consumption as well as consumption of major appliances, temperature, humidity, light, and motion data. These data streams allow us to infer information about the household’s appliance usage and domestic activities, which in turn enables meaningful and useful energy feedback. The platform developed has been rolled out in 20 UK households over a period of just over 21 months. As well as the data streams mentioned, qualitative data such as appliance survey, tariff, house construction type and occupancy information are also included. The paper presents a review of publically available smart home datasets and a description of our own smart home set up and monitoring platform. We then provide examples of the types of feedback that can be generated, looking at the suitability of electricity tariffs and appliance specific feedback.
1 Introduction
Research into Home Energy Management Systems (HEMS) is currently developing at a rapid rate, spurred on by the imminent requirement of utility suppliers to be able to supply advanced services for improving customer retention and make their business more attractive. This reinforces the push on research into data collection and analysis and the development of energy disaggregation algorithms [1, 2, 3] as well as the development of activity recognition [4, 5] and other decision support tools to provide much needed energy feedback for long-term user engagement and interaction.
To facilitate the above research efforts, it is important that researchers have access to data which can be used for the purposes of building HEMS, providing effective energy feedback and studying domestic energy consumption behaviour. There are many datasets publically available that contain raw power consumption readings. Some datasets consist of a small number of houses at very high sampling rates of the order of kHz (e.g., BLUED [6], REDD [1]), and others have a large number of houses with low sampling rates of the order of 2 or 10 minutes (e.g., UK HES [7]).
With the UK nationwide rollout of smart meters underway, the UK-based REFIT project aims to provide data similar to what can be expected from UK smart meters, as defined by the Smart Metering Equipment Technical Specification (SMETS) [9] proposal by UK’s DECC (Department of Energy and Climate Change). Therefore we chose an 8-10 second sampling rate for electrical readings, similar to what can be provided by households that install a Consumer Access Device in their homes to read the Smart Meter measurements directly [9]. This is a higher rate than the half-hourly rate that can be provided via opt-in to energy suppliers and their trusted third parties should home owners wish to be given additional feedback in terms of general energy usage.
etc.) where qualitative data, the occupancy group and building type are not provided so it is harder to draw conclusions on the efficiency of the participants against similar homes.
This paper focuses on the design and development of a data management platform for personalised real-time energy monitoring, developed as part of the UK REFIT project [8], and the potential understanding of household consumption and behaviour that can be inferred from this platform from simple to more advanced analytics. The main contribution of the paper is to demonstrate the ease of energy feedback generation as well as a reliable backend for remotely monitoring real-time data such as active power and environmental parameters. The backend includes a database that enables simple and quick access to variety of quantitative data related to domestic energy research via simple queries. To the best of our knowledge, there is no similar data platform publicly available of the same scale or duration which is supplemented by such in-depth participant information.
The remainder of the paper is organised as follows. Section 2 provides a review of similar publically available datasets and sets out the motivation for this study. Section 3 explains the setup of our data monitoring platform including details of measurements collected during our study. Section 4 details the software and database backend for data management. Section 5 discusses the initial analysis of the data gathered with a view towards improving the quality of personalised feedback that can be generated for households. Section 6 concludes the paper.
2 Review of Publicly Available Domestic Electrical Consumption Datasets
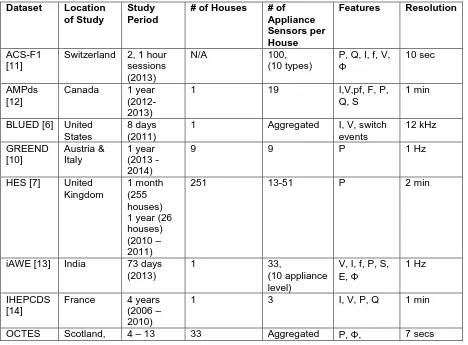
[image:2.595.66.534.420.765.2]A range of datasets are already available which can be used in a similar way to the REFIT electrical dataset. We review these to help show why our database aims to help supply more in-depth information than existing databases. It can be seen in Table 1 that there are a number of datasets that can be used for advanced analytics such as energy disaggregation. Projects that run for a long period of time (> 1 year) tend to focus on a small number of houses (< 10) (AMPds, IHEPCDS), while short projects, of the order of days or several months, may have a large sample set.
Table 1: Publically Available Dataset Comparison
Dataset Location of Study
Study Period
# of Houses # of Appliance Sensors per House
Features Resolution
ACS-F1 [11]
Switzerland 2, 1 hour sessions (2013)
N/A 100,
(10 types)
P, Q, I, f, V,
Φ 10 sec
AMPds [12]
Canada 1 year (2012-2013)
1 19 I,V,pf, F, P,
Q, S
1 min
BLUED [6] United States
8 days (2011)
1 Aggregated I, V, switch events 12 kHz GREEND [10] Austria & Italy 1 year (2013 -2014)
9 9 P 1 Hz
HES [7] United Kingdom
1 month (255 houses) 1 year (26 houses) (2010 – 2011)
251 13-51 P 2 min
iAWE [13] India 73 days (2013)
1 33,
(10 appliance level)
V, I, f, P, S, E, Φ
1 Hz
IHEPCDS [14]
France 4 years (2006 – 2010)
1 3 I, V, P, Q 1 min
[15] Iceland & Finland months (2012 - 2013) Energy price
REDD [1] United States
3 – 19 days (2011)
6 9 - 24 Aggregate:
V, P; Sub-metered: P
15 kHz (aggr.) 3 secs (sub) REFIT [8] United
Kingdom
2 years (2013 – 2015)
20 11+ P, Energy
price 8 seconds Smart* [16] United States 3 months (2012 – 2013) 1 sub-metered, + 2 (Aggregated + Sub-metered) 25 circuit, 29 appliance P, S (circuit), P (sub) 1 Hz Tracebase [17]
Germany N/A (2012) 15 158
(43 types)
P 1 – 10 sec
UK-DALE [18] United Kingdom 499 days (2012 – 2014)
4 5 (house 3)
53 (house 1)
Aggregated P, Sub P, switch status 16 Khz (aggr.) 6 secs (sub) Active Power (P), Reactive Power (Q), Apparent Power (S), Energy (E), Frequency (f), Phase Angle (Φ), Voltage (V) and Current (I).
The largest dataset in terms of length and study size is HES [7]. However, the monitoring interval is small and sampling rate of 2 minutes is low. This makes it less suitable for energy disaggregation research as it becomes harder to distinguish individual appliances and events. It does however provide information about the recorded households, including type, size and number of occupants.
The OCTES [15] dataset is similar to our own, recording Active Power, phase and energy cost. It has a slightly shorter study duration, a slightly larger study size and data are recorded at a similar resolution to ours. It publically provides the electrical data for each house; however, it does not provide any information about the houses other than their geographical location based on country. The example of analysis given describes the use of a sauna in one household; however, this information is not provided publically, therefore an assumption would have to be made as to the power consumption.
Tracebase [17] is a dataset that contains appliance signatures, which helps disaggregation research. The signatures, obtained with 1 second sampling rate, could be used for training but cannot be used to investigate usage patterns as no information is given with respect to the make or model of the appliances being monitored. It currently contains 43 different devices. Each device has a number of recordings from different days and different houses. Also available in the dataset are readings of date, power and average power sampled at 8 seconds.
In all the above datasets, there is no information about the environment where consumption is taking place. Our platform provides an appliance survey and household composition which will help researchers to develop a much more in-depth picture and allow for more types of analysis. Our dataset has a similar output to the OCTES and ACS-F1 datasets but is unique due to the addition of temperature, light, and movement data augmented with house surveys detailing size, age, heating type, insulation, construction type and information about the occupants, working status and age. Qualitative data gathered from interviews with the occupants of households provide a unique way for researchers to validate results with regards to observed patterns and to reduce the number of assumptions that need to be made.
3 Data Collection
The REFIT project aims to provide retrofitting advice to households on the basis of smart home data. The data has been collected and analysed by an inter-disciplinary team of researchers from disciplines including Electronic and Electrical Engineering, Buildings and Civil Engineering, Design, and Sociology. A combination of different methods has generated a wealth of data for each of the 20 households in the study. The data has been collected over a two year period, which has provided electrical, gas and heating data which can be viewed over multiple seasons. During recruitment, households were chosen so the sample varied in terms of technical competence, house age and construction, and occupancy.
These 20 households were selected from a set of 46 applicants to ensure a range of household types including single occupancy, dual-income families with children and retired couples. Respondents ranged in age from ten to seventy four, and were drawn from professions that included students, carers, IT consultants and those not currently in paid work. As all the respondents have signed up to participate in a smart home trial and were therefore interested in experimenting with and learning about smart home technologies in their own homes, they may be considered more representative of early adopters than users engaged in studies that elicit a much broader range of public opinions and perspectives.
3.1 Hardware
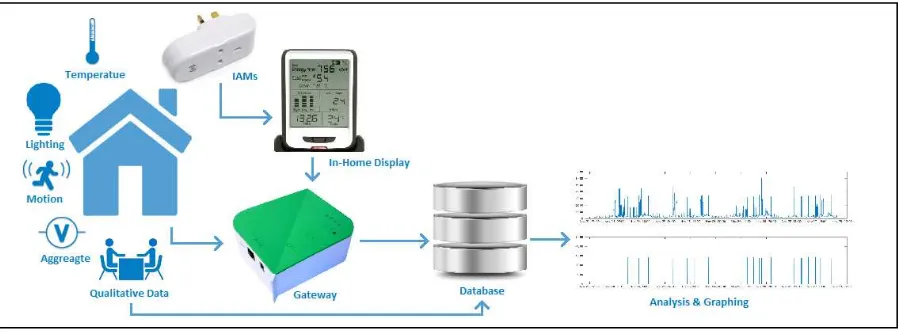
[image:4.595.74.523.503.669.2]Each house was fitted out with an off-the-shelf gateway. The reason for using an off-the-shelf gateway was to minimise time on hardware development and increase time to gather energy data. Our gateway needed to be reliable, compact, and provide a backbone for daisy-chaining additional sensor types which would have required in depth testing and a concrete plan with regards to sensor availability (which has changed since the projects inception). The gateway also needed to be robust to the addition and removal of sensors as and when needed, and compatible with the communications technology widely used in the HEMS market, such as Z-wave and RFX devices operating at 433MHz. The gateway is connected wirelessly to a range of environmental sensors, and via a cable to a separate power monitoring hub. Environmental sensors include temperature, light and occupancy (3-in-1) sensors, and smart plugs, which in addition to returning the active power load of an appliance, can also be remotely switched on/off. The hub is wirelessly communicating to off-the-shelf power sensors: an aggregate current clamp as well as 9 individual appliance monitors (IAMs) for sub-metering, and also provides a real-time display of electricity consumption, in Watts (W) and GBP (£), of the aggregate and 9 appliances being monitored, as well as a comparison of consumption over the past week and month, and over the morning and evening of the previous day (see Figure 1).
Figure 1: Data collection system
The home gateway comes with its own web-based dashboard (Figure 2) that allows the REFIT team and the households to organise how sensors are zoned, to name appliances being monitored, and to add additional sensors and automation devices such as remote control plugs, lighting and security sensors.
Figure 2: Online off-the-shelf dashboard
This online interface is the initial point of contact for the REFIT database and allows for real-time remote data collection by the server located at University of Strathclyde. This allows for real-time data management and efficient data collection querying only the sensors whose readings have changed. Each house has around 16 – 20 sensors installed, with readings from most sensors taken every 6-8 seconds.
Some specialised sensors are also available in some houses such as the inclusion of solar panel output monitoring sensors.
3.2 Measurements Catalogued
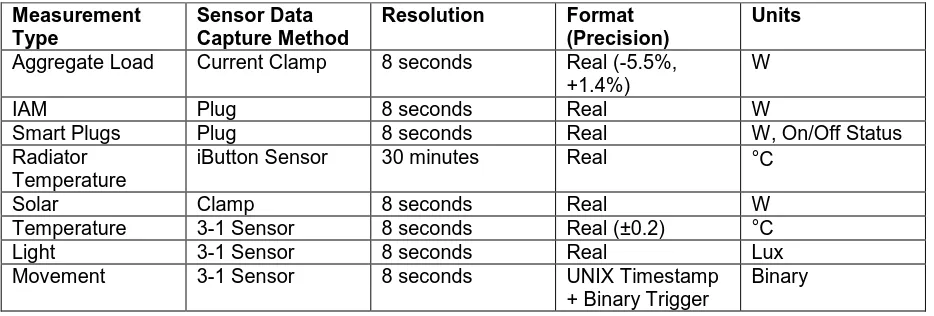
The quantitative data types stored in our database are shown in Table 2. The resolution of data may vary if a sensor or base station becomes temporarily unavailable.
Table 2: Recorded data
Measurement Type
Sensor Data Capture Method
Resolution Format (Precision)
Units
Aggregate Load Current Clamp 8 seconds Real (-5.5%, +1.4%)
W
IAM Plug 8 seconds Real W
Smart Plugs Plug 8 seconds Real W, On/Off Status
Radiator Temperature
iButton Sensor 30 minutes Real °C
Solar Clamp 8 seconds Real W
Temperature 3-1 Sensor 8 seconds Real (±0.2) °C
Light 3-1 Sensor 8 seconds Real Lux
Movement 3-1 Sensor 8 seconds UNIX Timestamp
+ Binary Trigger
Binary
[image:5.595.66.533.513.671.2]of their domestic activities. Interview data were recorded, transcribed, and then coded in terms of both activities and technologies. Video data were similarly reviewed and coded using the same template, adding salient information that had not come out in the interviews. The coded qualitative data provides a rich set of contextual information to support the analysis and interpretation of the real-time energy and environmental data (Table 2).
In addition, home surveys were carried out as part of the preparation process for installing the data monitoring system. The home surveys mapped out room sizes and configurations, and the distribution of appliances, technologies and devices. The home surveys provide a snapshot of the physical and hardware characteristics of the home, and provided complementary information to the qualitative data.
4 Database
The database is designed to be as flexible as possible. Households were not all added at the same time, and therefore the database could not be predefined. Data collection also has to be automated along with checking sensors affiliations. Due to the nature of the incoming sensor stream provided by the gateway, MySQL is chosen as it is a powerful open source solution which suited the structured data that was being recorded. MySQL has many benefits as well, when working with a multidisciplinary project, such as easy to use language, good documentation, portability to other systems, ease of integration with other solutions and user friendly tools in which to query the server.
Data are collected via Python scripts which monitor an account connected to each house’s gateway. This setup allows each household to use their own individual gateway as they see fit and a separate project team user account to continue to harvest data without causing any interference. Each Python script is dedicated to its own task, checking gateways are available, checking the sensor availability of each house and a taskmaster that spawns collection processes for each active house. Python was chosen as it has excellent compatibility with MySQL and JSON (JavaScript Object Notation the format which API requests are returned) and therefore is ideally used to bridge between household and database.
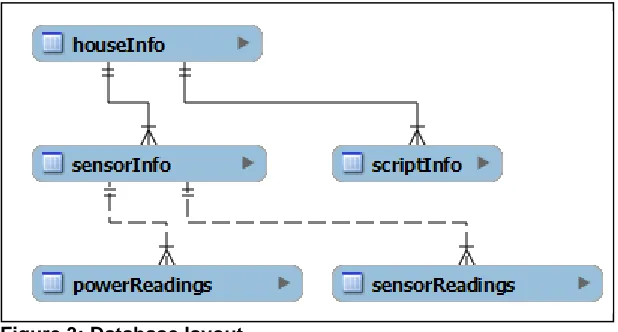
[image:6.595.72.381.513.679.2]The communication between gateway and server is kept to a minimum. To reduce the amount of duplicate records only sensors that have changed in value every 8 seconds are returned and stored. All data are stored with an associated MySQL date-time format based on when the data was harvested, not on the date-time recorded by the gateway as this is not always reliable and is dependent on what time zone the gateway is set to. The date-time format was chosen to make it simple for queries to be completed by those not used to working with UNIX, and MySQL can convert between the two easily when results are being downloaded from the server.
Figure 3: Database layout
entire household's power usage in one results table with each column being Aggregate/IAM grouped to a single concurrent timestamp.
4.1 Challenges
Smart home sensors and technology are still in their infancy. There is no defined structure that sensor platforms are required to conform to and in many cases sensors may be designed only to interface with their predefined base station. This provides a challenge since to provide scalability, it should be possible to add different sensors ‘on the fly’ and interface them to the gateway used.
In some cases there have been certain problems with sensor IDs. If the base station is reset or suffered a crash when it recreates its star network, it may assign sensors different IDs to what they previously had. Thus data accountability at the server harvester script must be designed to account sensors by their unique IDs.
During our study, a number of hardware, software and human interaction challenges were encountered. During monitoring, some IAMs ceased to function correctly. This was detected by a long period of time without a value change. These IAMs were quickly replaced.
The gateway used in the study has a reasonably well thought out API for querying each household to gather sensor readings; however, a standard response format for every type of query would greatly improve usability. One such example is a request for the sensors that have generated a new reading since the last query; this option, however, does not return all of the information that will have remained static between calls, such as static IDs, which can be used for identifying the sensor without the need to keep an up-to-date record of its variable assigned IDs. This means that certain useful IDs are not returned, for example, the sensor UUID (Universally Unique Identifier) which would be extremely useful. This however is only available via a different API query and returns multiple variables without a format such as JSON or XML (Extensible Mark-up Language) and would require regular expressions to validate every time, which adds complexity and creates the need for much more stringent error checking. The other option to query every sensor would have generated a lot more traffic and records which would not have provided meaningful data as in most cases it would be reporting the same value as it had during the last query.
Finally, human interaction is one of the most difficult issues to account for. In some cases, appliances were changed or moved without informing the research team in contact with the households. This is normal for real-world research with households in their domestic environments, but presents a challenge for database management. Similarly, the 3-1 sensors could be positioned poorly or moved without the research team’s knowledge for periods of time. In general, however, most of this activity is logged correctly and can be correlated against other device usage.
4.2 Remote Data Checking
Data checking is essential and where possible has been automated. Scripts automatically reconnect to household gateways when they become unavailable and check the following variables to ensure that data is still being collected: time since the script last managed an update, time between sensor readings and change in sensor readings. The gateways also allow for multiple accounts to have access; this enables remote resets as well as performing updates by the research team if the household did not notice or check via their gateway’s internet portal. If a sensor has been disconnected or has stopped functioning correctly, this was recorded and a member of the project team physically replaced the sensor.
5 Data Analysis
This section presents some examples of analytics that are enabled by our platform, and hence the potential for more salient and meaningful personalised feedback to households.
5.1 Aggregate Power Load Analysis
analysis is quick and easy to do and can be provided to households without the need for any expertise.
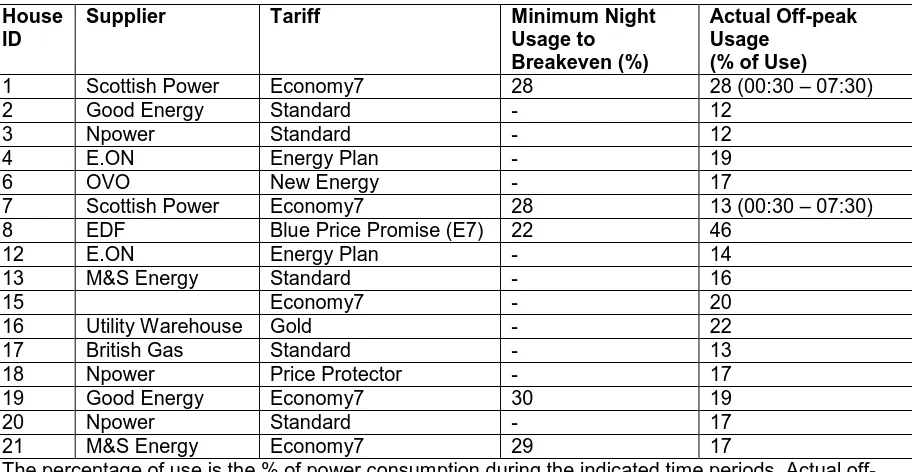
[image:8.595.64.532.189.432.2]Comparison of different tariffs can also be done quickly, since data are collected at 8 second intervals. The suitability of specialised energy tariffs such as Economy7 can be analysed. Economy7 is a tariff available in the UK which consists of a day cost and an off-peak cost (between 10pm – 8am depending on location and supplier). It is an ideal tariff for households that use electricity for storage or water heating and for those who use electricity significantly more during off-peak hours.
Table 3: Suitability of Economy7 electrical tariff
House ID
Supplier Tariff Minimum Night Usage to Breakeven (%)
Actual Off-peak Usage
(% of Use)
1 Scottish Power Economy7 28 28 (00:30 – 07:30)
2 Good Energy Standard - 12
3 Npower Standard - 12
4 E.ON Energy Plan - 19
6 OVO New Energy - 17
7 Scottish Power Economy7 28 13 (00:30 – 07:30)
8 EDF Blue Price Promise (E7) 22 46
12 E.ON Energy Plan - 14
13 M&S Energy Standard - 16
15 Economy7 - 20
16 Utility Warehouse Gold - 22
17 British Gas Standard - 13
18 Npower Price Protector - 17
19 Good Energy Economy7 30 19
20 Npower Standard - 17
21 M&S Energy Economy7 29 17
The percentage of use is the % of power consumption during the indicated time periods. Actual off-peak period set by the supplier is 12am – 7am unless specified, e.g., House 1. Consumption figures refer to the period September – December 2014.
Table 3 shows tariff and off-peak energy consumption values for a selection of houses. It can be seen that a number of houses are on non-standard tariff; in all cases tariffs that are not ‘Economy7’ should be considered single rate. The minimum night usage column shows the amount of usage required to break even against the same supplier’s standard tariff when using Economy7. The last column shows the actual off-peak usage of the household, which is to be compared with the previous column to determine whether the household is making the most of their tariff.
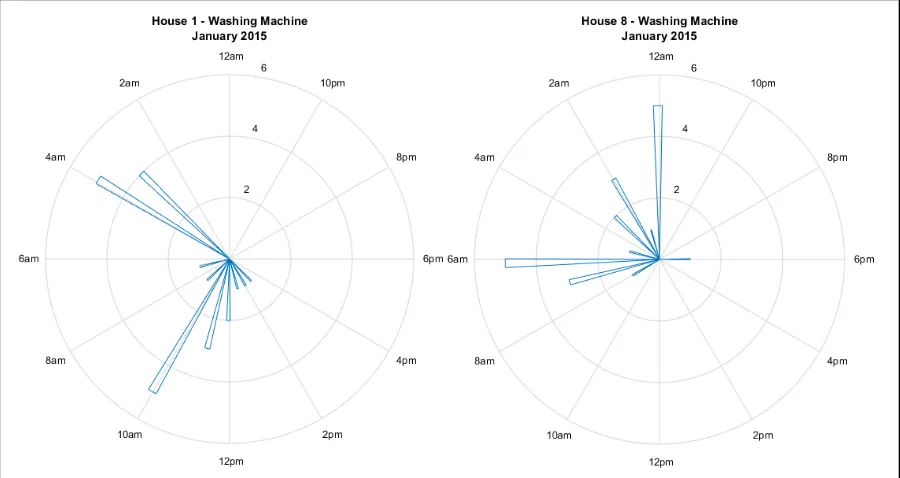
Using the latest figures from the utility websites [21, 22, 23, 24], it can be seen that to benefit from the Economy7 tariff a household would have to use a minimum of 22-30% during the off-peak rate. Looking back at Table 3 it can be observed that only 2 houses benefit from being on an Economy7 tariff: House 8 where over 40% power usage is off-peak and House 1 which is on the limit of minimum usage for their specific tariff. The other houses on Economy7 fall short of this minimum target (Houses 7, 19 and 21) and will in many cases be paying more than if they were on a standard tariff. Those on Economy7 should look at adjusting large white appliance schedules such as dishwashers, washing machines and tumble dryers to make better use or consider switching tariff to reduce costs.
[image:8.595.71.527.192.428.2]Figure 4: Washing machine usage time. Values refer to the number of washes started during each hour during January 2015.
Figure 5: Household base load. The base load is the minimum level of demand on the
household’s supply system over 24 hours. Data recorded January 2015. Number at the top of bars represents the household occupancy.
Figure 5 shows the base load (the lowest most frequent value) extracted from the aggregate load data; this is a good indication of the number of appliances being left on standby or background appliances such as boiler control units, fridges and freezers. A high base load can be investigated by the household. Benchmarking with other households, households may be motivated to evaluate what they are leaving on or in standby and decide if this is really necessary. The costs can also be significant; considering the cost of an average UK electricity tariff, House 5 could be spending up to £40 per month on background appliances, representing a substantial cost per year and highlighting the need to investigate the probable causes. Our data revealed that the computer in House 5 is left on almost continuously, thus contributing around 150W continuously to the base load.
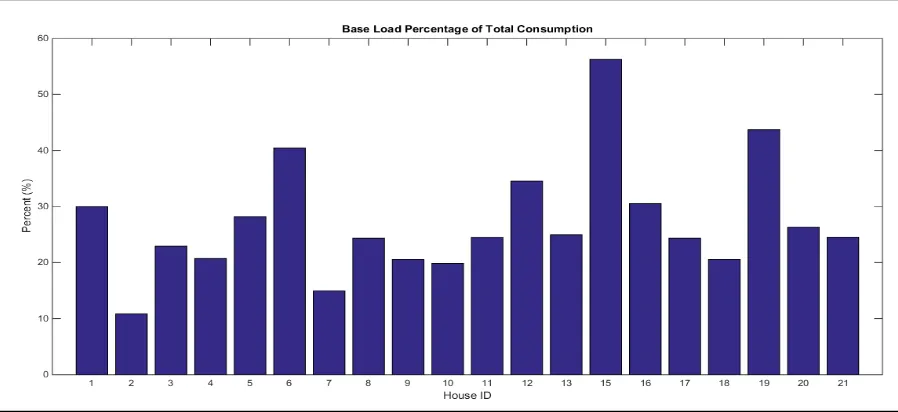
4,154 kWh, a baseload of 220W continuously over the year would consume 1,927kWh meaning that baseload would account for 46% of total consumption. Figure 6 shows that most of the houses in our study are below this threshold. House 15 has a significant percentage being the baseload, however this can be attributed to computers which are left on constantly throughout the year. House 5 can be seen to have a very high baseload (see Figure 5), but this only accounts for a small percentage of total usage because House 5 is a high consumer.
Figure 6: Base load percentage contribution to household total consumption, using data for the month of January 2015.
Due to the nature of the database layout, importing and exporting data is made easy and therefore raw data can be provided to be used by households if they wish to look at certain events themselves. This would be provided as a csv file with a single time series and the labelled sensors, location and units associated with that house.
5.2 Appliance-Specific Usage
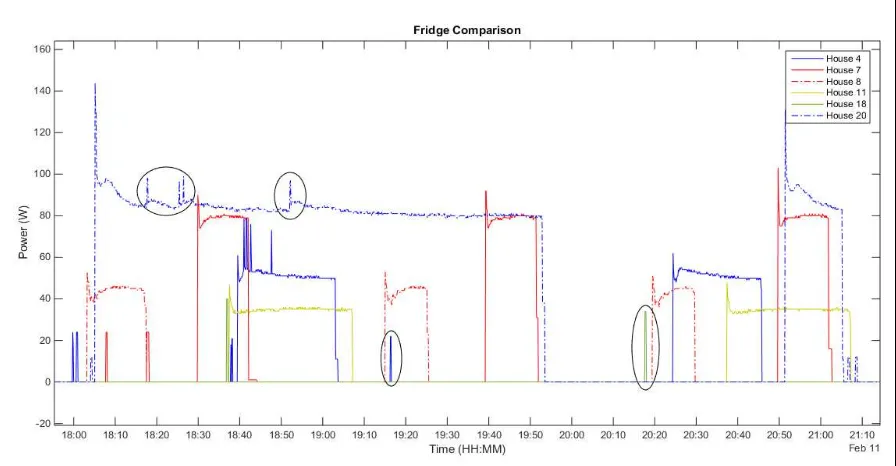
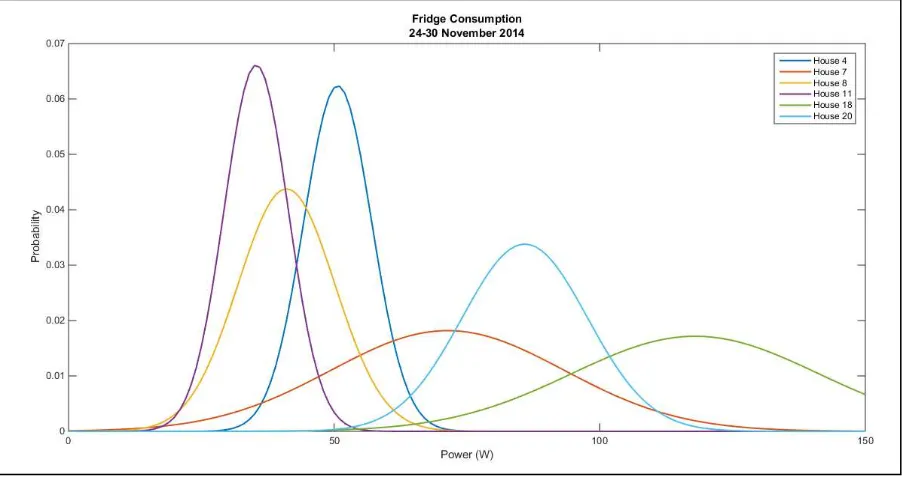
Figure 7: Fridge power comparison plot
Figure 7 shows the different operating characteristics exhibited by some of the fridges. It can be seen that they all have similar signatures. However the frequency and duration vary significantly. The areas circled indicate the fridge door being opened and hence how often the fridge is used, that is, the longer the door is left opened, the higher the consumed load. This plot is very useful to researchers to assess efficiency of fridges, but not necessarily for households to visualise. All fridges have a starting edge spike that is attributed by the fridge motor.
Figure 8: Fridge power bands
To help convey this information to households in a meaningful manner, Table 4 is provided with the associated power consumption along with financial cost.
Table 4: Comparison of fridges in six houses.
House ID
Average Duration (s)
Average Active
Power (W) kWh per Year
Cost per Year (14.05p/kWh)
House 4 1130 51.7 81 £11.38
House 7 535 67.9 114 £16.03
House 8 832 42.1 63.4 £8.91
House 11 1736 34.8 117.9 £16.56
House 18 408 117.8 135.6 £19.05
House 20 1109 89.1 241.8 £33.98
Table notes: Data recorded February 2015. Average duration is the active period during normal cooling. kWh per Year extrapolated from cost of February.
[image:12.595.67.530.386.492.2]Analysis on individual appliances allows usage patterns to be analysed daily, weekly, monthly, seasonally and so on. These patterns can reveal specific routines, for example, laundry on alternate days or the duration of time spent watching television. Alternatively analysis can show the time when entertainment-related appliances have been left on standby.
Table 5: Monthly energy consumption of television and ancillary components
House ID Consumption (kWh)
Standby Consumption (kWh)
% of
Consumption Attributed to Standby
Hours in Standby
Cost per Year
(14.05p/kWh)
6 31 6 22 523 £4
8 31 5 16 602 £4
9 21 5 24 586 £3
17 12 7 58 652 £1
[image:12.595.65.536.592.704.2]19 10 5 51 643 £1
Table notes: Data collected January 2015. Ancillary components include set-top boxes, games consoles, etc. 14.05p stands for 14.05 pence or GBP0.1405, which is the average electricity tariff in UK in February 2015. [http://www.energysavingtrust.org.uk/]
[image:12.595.66.531.592.705.2]portion of usage in the standby power range. From the hours left in standby, it is clear that the television and associated devices, including set-top box, game consoles, DVD players, are never switched off at the socket point. Completely turning off any non-essential devices in these houses could amount to a reasonable saving over the course of a year. The other houses have a larger period of time in use but the consumption of standby devices is still significant and feeding this information back to homeowners may make them re-evaluate habits with regard to fully switching off appliances.
6 Further analytics enabled with our platform
Initial work on further analysing the quantitative and qualitative data collected using advanced algorithms, e.g., Nonintrusive Appliance Load Monitoring (NALM) [2, 3] and activity recognition [4, 5] has shown the potential of our platform. Activity recognition allows electricity usage to be apportioned between activities such as cooking, cleaning, washing, laundering, watching TV, and playing computer games. This is a potentially powerful means of providing feedback as it reflects households' own lived experience. We note that while some other datasets publically available, such as BLUE, GREEN, REDD, can be used for NALM, they cannot be applied to activity recognition due to the lack of qualitative data necessary to associate accurately appliance usage to domestic activities.
Gas data together with available temperature data will facilitate gas disaggregation which differentiates the gas consumption used for space, water heating, and gas hobs used for cooking. Gas and temperature monitoring will also enable the development of statistical building energy models and allow the accuracy of conventional steady-state models to be tested [25].
The dataset also enables other types of analysis. As an example, [26] investigates the reception, adoption and influence of smart technologies and the usage of remote control smart equipment, by analysing available qualitative data in relation to remote/scheduled usage patterns logged in the database. Another example is [27] which looks at the available house data and associated power usage and how this can be used to generate retrofit advice which is then fed back to occupants in a way where they will be in position to make informed decision about retrofitting their house.
7 Conclusion
This paper has laid out the different components of the REFIT monitoring platform and dataset, and some of the possible information that can be gleaned about consumer habits with a view to promote energy saving behaviour via meaningful feedback. We have shown that households and appliances have distinct energy consumption patterns, and thus a personalised approach is needed.
The results demonstrate the progress towards our goal to provide an easy to use in-depth study on a number of houses for use by researchers to perform disaggregation and household analysis from multiple perspectives with the ability to combine data gathered from different fields of study. We hope that by fairly representing the UK Smart Metering Equipment Technical Specification, home energy management systems can be developed using similar in-depth datasets, like ours, that takes into account the additional meta data provided alongside power which can be used to help tailor the platform to the intended market.
Acknowledgements
This work has been carried out as part of the REFIT project (‘Personalised Retrofit Decision Support Tools for UK Homes using Smart Home Technology’, £1.5m, Grant Reference EP/K002457/1). REFIT is a consortium of three universities - Loughborough, Strathclyde and East Anglia - and ten industry stakeholders funded by the Engineering and Physical Sciences Research Council (EPSRC) under the Transforming Energy Demand in Buildings through Digital Innovation (BuildTEDDI) funding programme. For more information see: www.epsrc.ac.uk and www.refitsmarthomes.org
References
[2] Liao, J., Elafoudi, G., Stankovic, L., & Stankovic, V. (2014). Disaggregation for low sampling rate data. In 2nd International Workshop on Non-Intrusive Load Monitoring. Austin, Texas.
[3] Liao, J., Elafoudi, G., Stankovic, L., & Stankovic, V. (2014). Non-intrusive appliance load monitoring using low-resolution smart meter data. 535-540. Paper presented at IEEE International Conference on Smart Grid Communications, Venice, Italy.10.1109 / SmartGridComm.2014.7007702
[4] Liao, J., Stankovic, L., & Stankovic, V. (2014, June). Detecting Household Activity Patterns from Smart Meter Data. In Intelligent Environments (IE), 2014 International Conference on (pp. 71-78). IEEE.
[5] Wilson, C., Stankovic, L., Stankovic, V., Liao, J., Coleman, M., Hauxwell-Baldwin, R., Kane, T., Firth, S., Hassan, T. Identifying the time profile of everyday activities in the home using smart meter data. To be published in Proc. European Council for an Energy Efficient Economy (ECEEE) 2015 Summer Study on Energy Efficiency, June 2015, France
[6] Anderson, K., Ocneanu, A., Benitez, D., Carlson, D., Rowe, A., & Berges, M. (2012, August). BLUED: A fully labelled public dataset for event-based non-intrusive load monitoring research. In Proceedings of the 2nd KDD workshop on data mining applications in sustainability (SustKDD) (pp. 1-5).
[7] Zimmermann J.-P., Evans M., Griggs J., King N., Harding L., Roberts P., and Evans C. Household electricity survey, 2012. Available at https://www.gov.uk/
[8] http://www.refitsmarthomes.org/
[9] Department of Energy and Climate Change (December 2013) - Smart metering equipment technical specifications: second version. [ONLINE] Available at: https://www.gov.uk/government/uploads/system/uploads/attachment_data/file/381535/SMIP_E 2E_SMETS2.pdf
[10] Monacchi, A., Egarter, D., Elmenreich, W., D'Alessandro, S., & Tonello, A. M. (2014, November). GREEND: an energy consumption dataset of households in Italy and Austria. In Smart Grid Communications (SmartGridComm), 2014 IEEE International Conference on (pp. 511-516). IEEE.
[11] Gisler, C., Ridi, A., Zujferey, D., Khaled, O. A., & Hennebert, J. (2013, May). Appliance consumption signature database and recognition test protocols. In Systems, Signal Processing and their Applications (WoSSPA), 2013 8th International Workshop on (pp. 336-341). IEEE.
[12] Makonin, S., Popowich, F., Bartram, L., Gill, B., & Bajic, I. V. (2013, August). AMPds: A public dataset for load disaggregation and eco-feedback research. In Electrical Power & Energy Conference (EPEC), 2013 IEEE (pp. 1-6). IEEE.
[13] Batra, N., Gulati, M., Singh, A., & Srivastava, M. B. (2013, November). It's Different: Insights into home energy consumption in India. In Proceedings of the 5th ACM Workshop on Embedded Systems For Energy-Efficient Buildings (pp. 1-8). ACM.
[14] Individual Household Electric Power Consumption DateSet, [ONLINE] Available at: https://archive.ics.uci.edu/ml/datasets/Individual+household+electric+power+consumption
[15] Octes Dataset [ONLINE] Available at: http://octes.oamk.fi/final/
[16] Barker, S., Mishra, A., Irwin, D., Cecchet, E., Shenoy, P., & Albrecht, J. (2012). Smart*: An open data set and tools for enabling research in sustainable homes. SustKDD, August.
[18] Kelly, J., & Knottenbelt, W. (2014). UK-DALE': A dataset recording UK Domestic Appliance-Level Electricity demand and whole-house demand. arXiv preprint arXiv:1404.0284.
[19] Jahn, M., Jentsch, M., Prause, C. R., Pramudianto, F., Al-Akkad, A., & Reiners, R. (2010, May). The energy aware smart home. In Future Information Technology (FutureTech), 2010 5th International Conference on (pp. 1-8). IEEE.
[20] Paris, J., Donnal, J. S., & Leeb, S. B. (2014). NilmDB: The Non-Intrusive Load Monitor Database.
[21] Scottish Power [ONLINE], https://www.scottishpower.co.uk/tariff-information.process?execution=e1s1
[22] Marks & Spencer [ONLINE], http://www.mandsenergy.com/ourprices/
[23] Good Energy [ONLINE], http://www.goodenergy.co.uk/switch/our-tariffs
[24] EDF [ONLINE], https://my.edfenergy.com/gas-electricity/tariff-information-labels
[25] Kane, T., Cockbill, S., May, A., Mitchell, V., Wilson, C., Dimitriou, V., Liao, J., Murray, D., Stankovic, L., Stankovic, V., Fouchal, F., Hassan, T., and Firth, S.K., “Enhancing retrofit decision support using Smart Metering data: A multi-disciplinary approach,” European Council for an Energy Efficient Economy (ECEEE) 2015 summer study on energy efficiency, 1–6 June 2015, Presqu’île de Giens, Toulon/Hyères, France
[26] Department of Energy and Climate Change (December 2013) – Early Findings: Demand Side
Management Report. [ONLINE] Available at:
https://www.gov.uk/government/uploads/.../early_findings_revised.pdf